


Want it delivered daily to your inbox?
-
US stock prices and home prices have increased much faster than US household debt over the past 15 years, see chart below.
As a result, debt in the US household sector is at the lowest level in 50 years relative to assets.
In other words, US households benefit tremendously from the exceptional performance in US financial markets and the continued rise in US home prices.
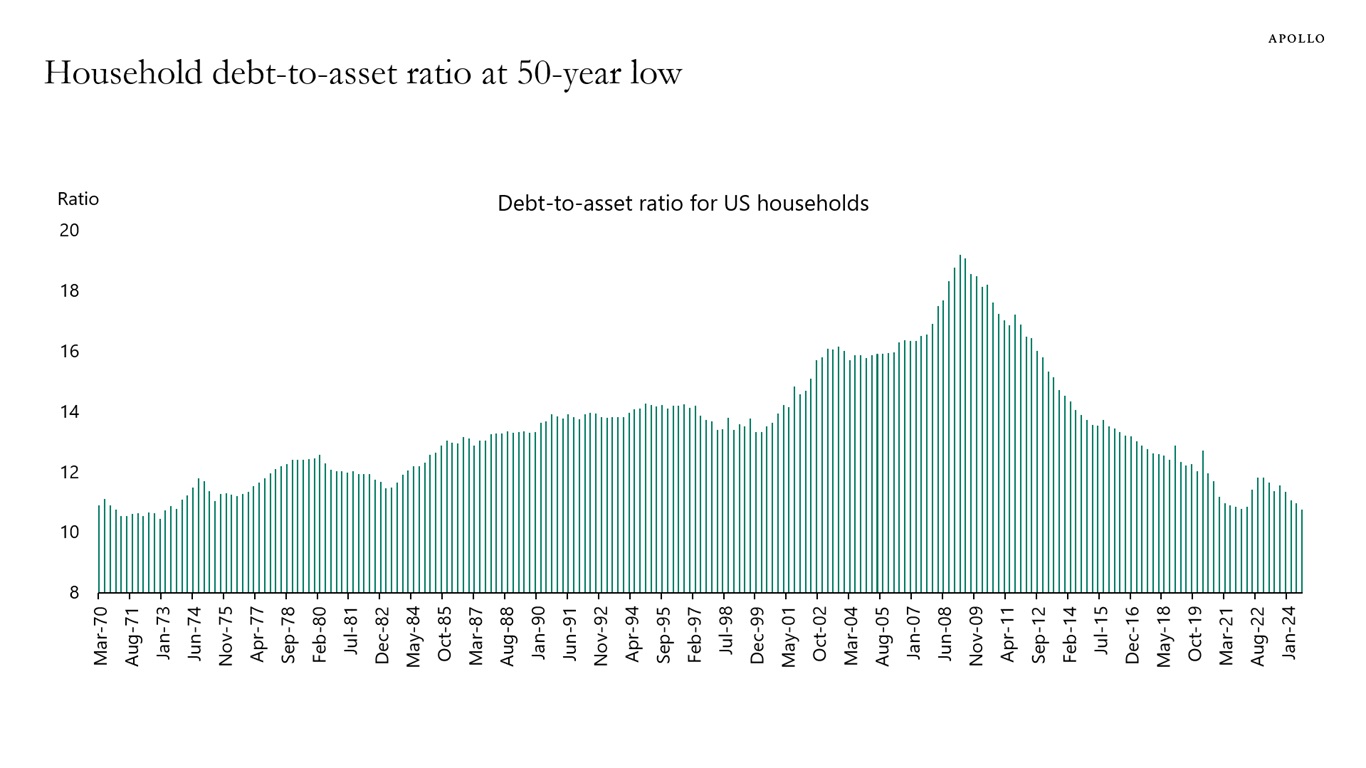
Source: Federal Reserve, Haver Analytics, Apollo Chief Economist See important disclaimers at the bottom of the page.
-
The narrative in markets is that the outlook for the US is great, and the outlook for Europe, UK, and China is not good.
For markets, the problem with this narrative is that 41% of revenues in the S&P 500 come from abroad. If we have a recession in Europe and a continued slowdown in China, it will have a significant negative impact on earnings for S&P 500 companies.

Source: FactSet, Apollo Chief Economist See important disclaimers at the bottom of the page.
-
This week, the employment report came in stronger than expected, weekly same-store retail sales were better than expected, and Prices Paid for ISM Services came in higher than expected.
The bottom line is that momentum in the economy is strong, and the narrative that monetary policy is restrictive is wrong.
Combined with higher animal spirits and the latest Atlanta Fed GDP estimate at 2.7%, we see a 40% probability that the Fed will hike rates in 2025.
Our latest chart book with daily and weekly indicators for the US economy is available here.
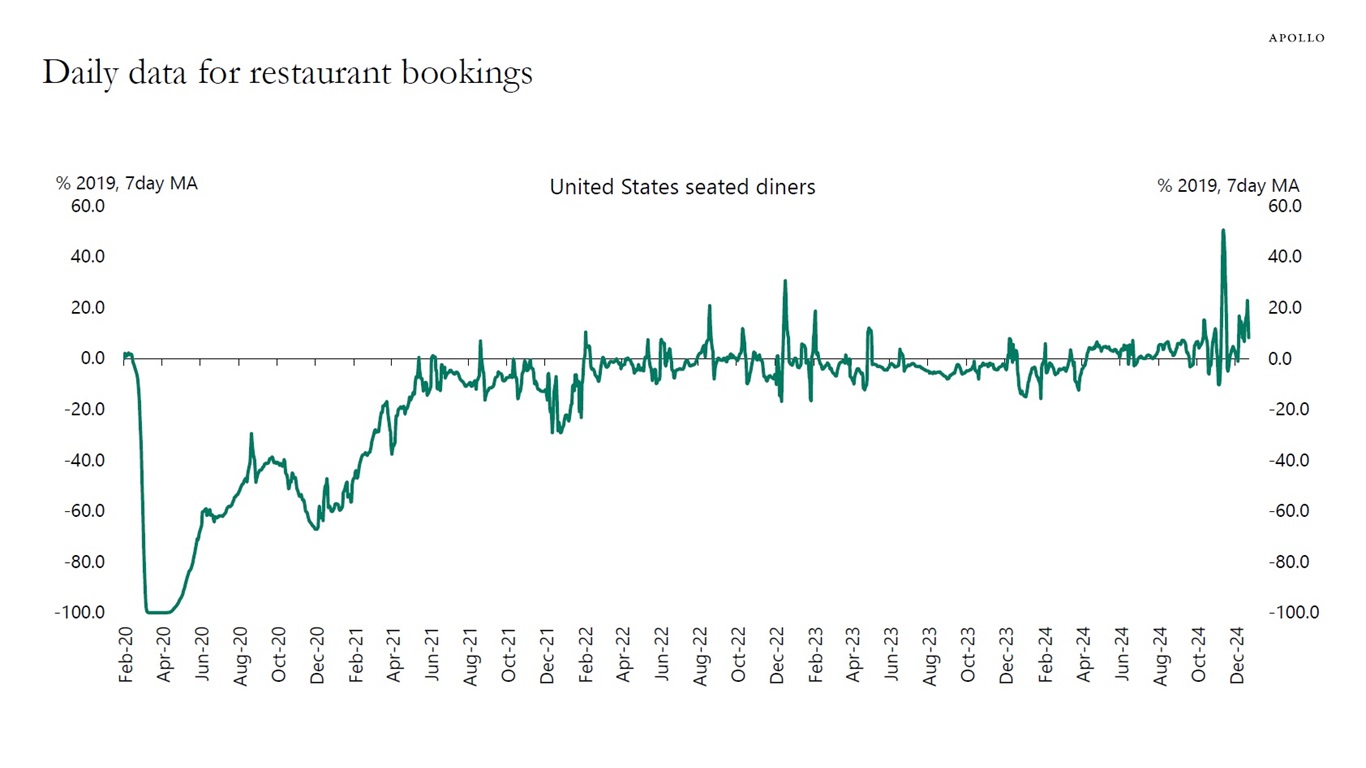
Source: OpenTable, Apollo Chief Economist 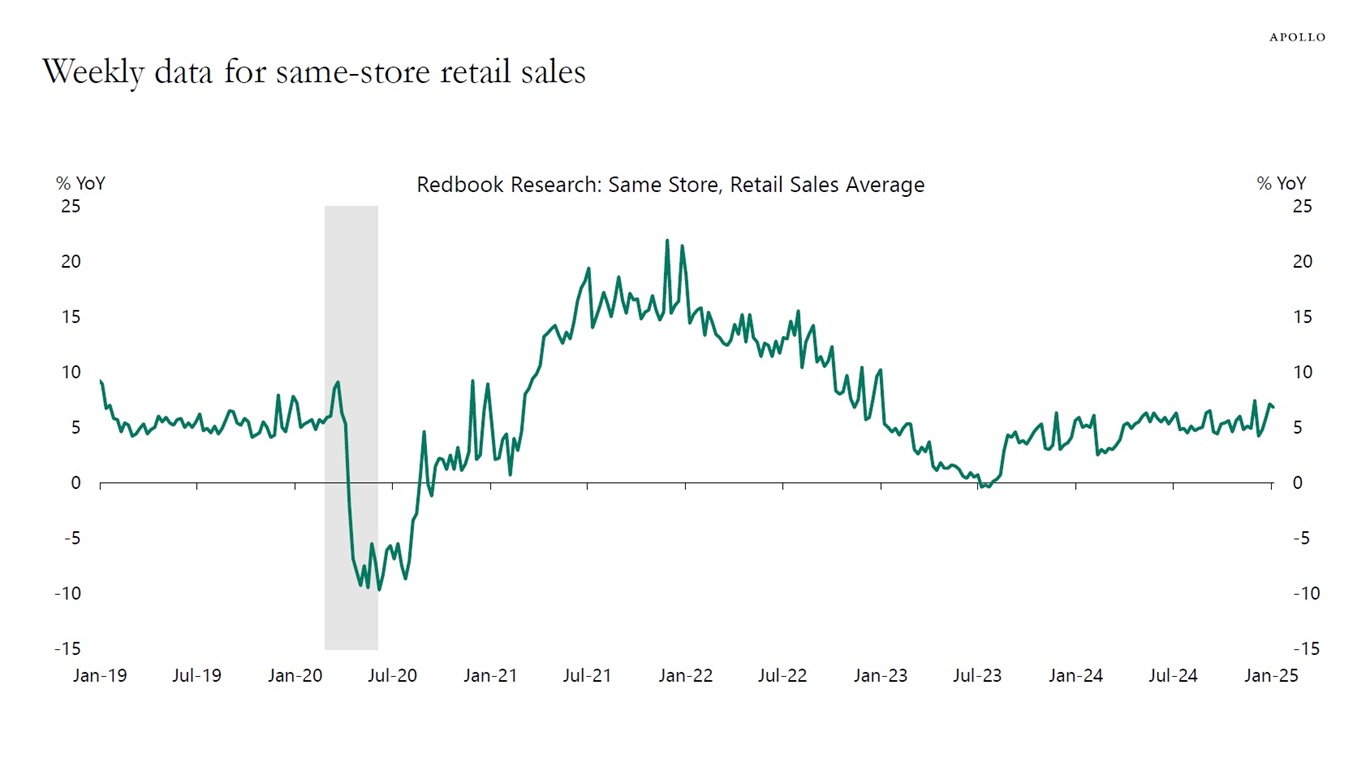
Source: Redbook, Haver Analytics, Apollo Chief Economist 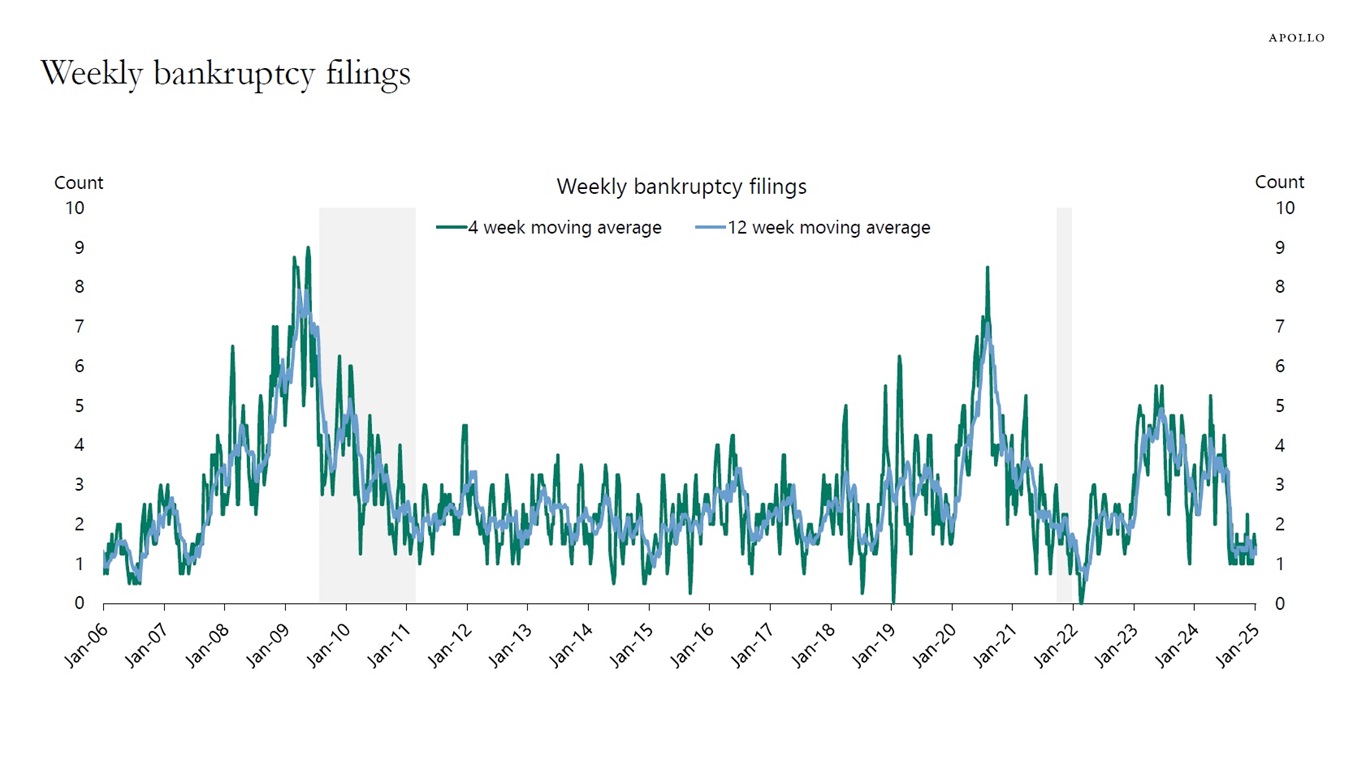
For week ending on January 10th, 2025. Note: Filings are for companies with more than $50 million in liabilities. Source: Bloomberg, Apollo Chief Economist 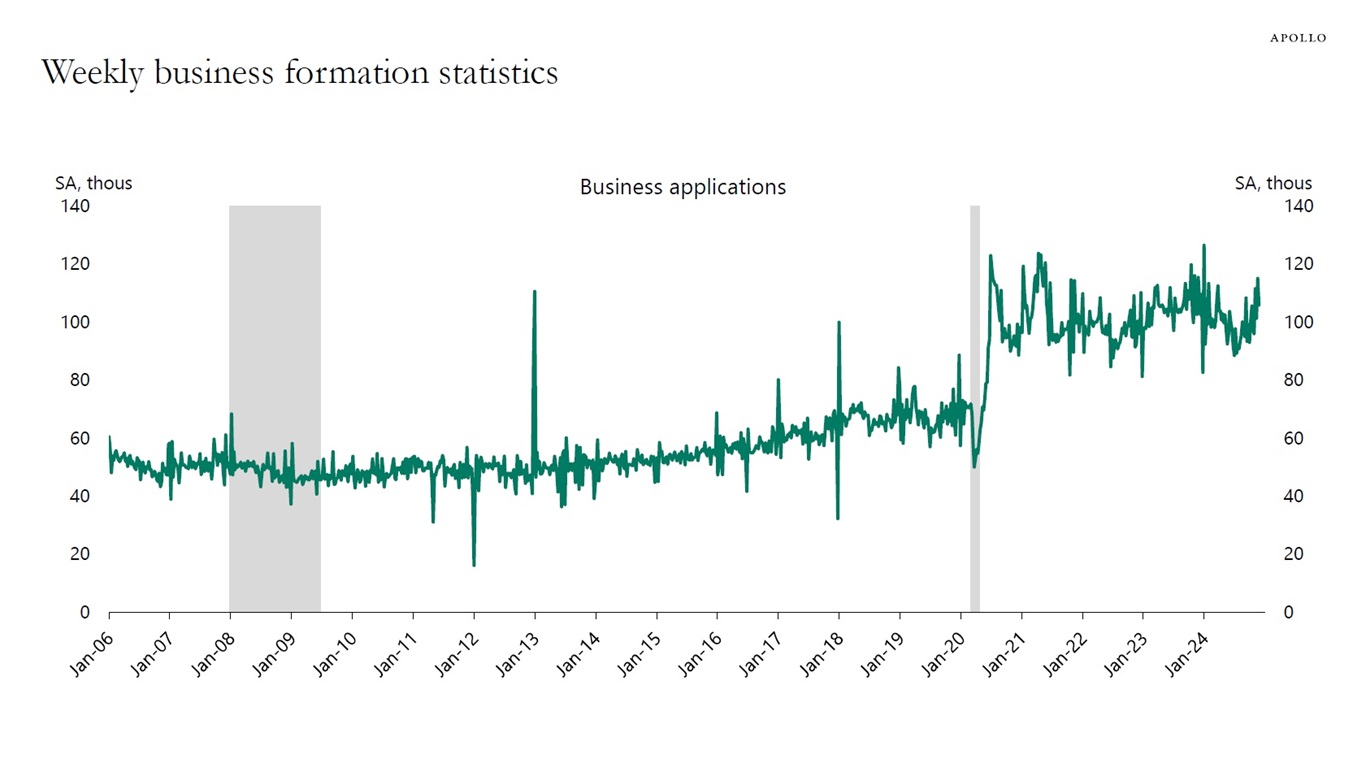
Source: Census, Haver Analytics, Apollo Chief Economist 
Note: The economic conditions indices are computed with mixed-frequency dynamic factor models with weekly, monthly, and quarterly variables that cover multiple dimensions of state economies. The indices are scaled to 4-quarter growth rates of U.S. real GDP and normalized such that a value of zero indicates national long-run growth. Source: Baumeister, Christiane, Danilo Leiva-Leon, and Eric Sims (2024), “Tracking Weekly State-Level Economic Conditions,” “Review of Economics and Statistics, 106(2), 483-504,” Apollo Chief Economist 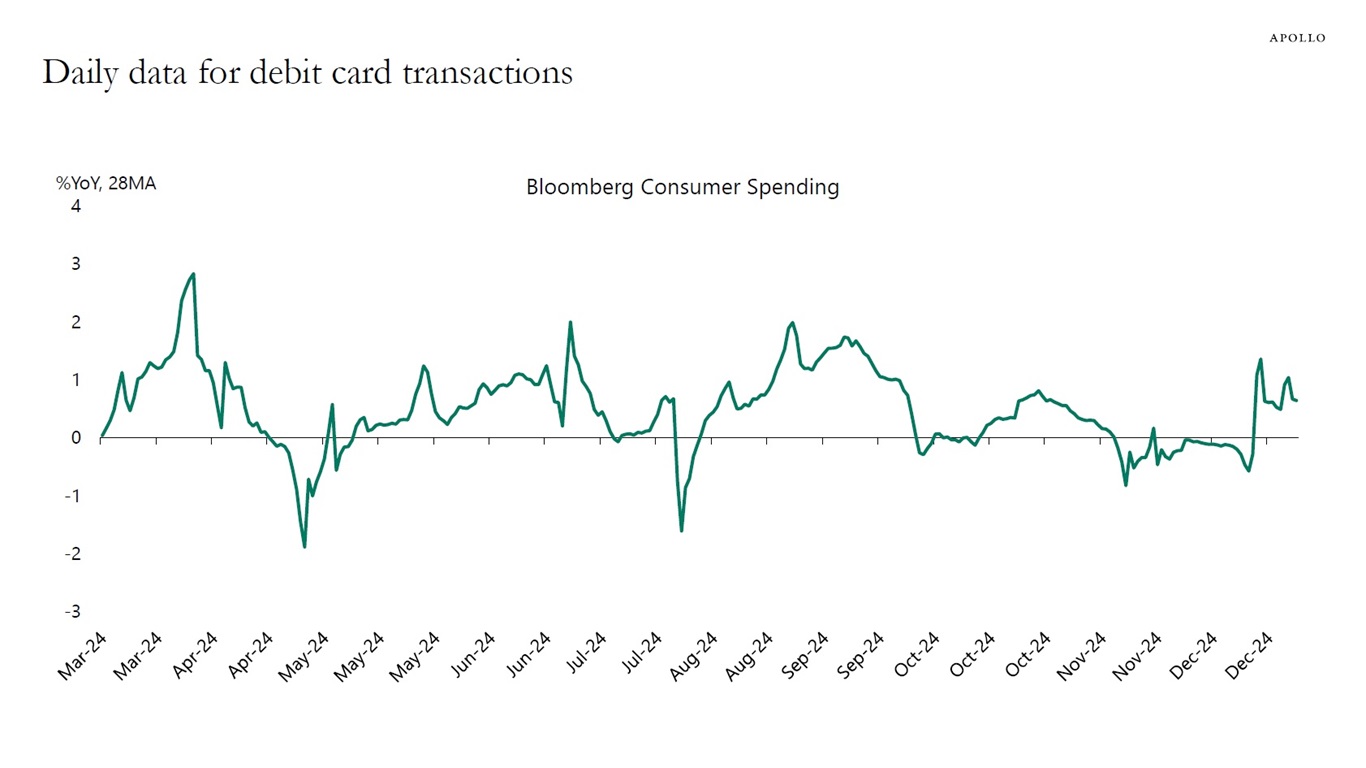
Note: Consists largely of debit card transactions. Source: Bloomberg, Apollo Chief Economist 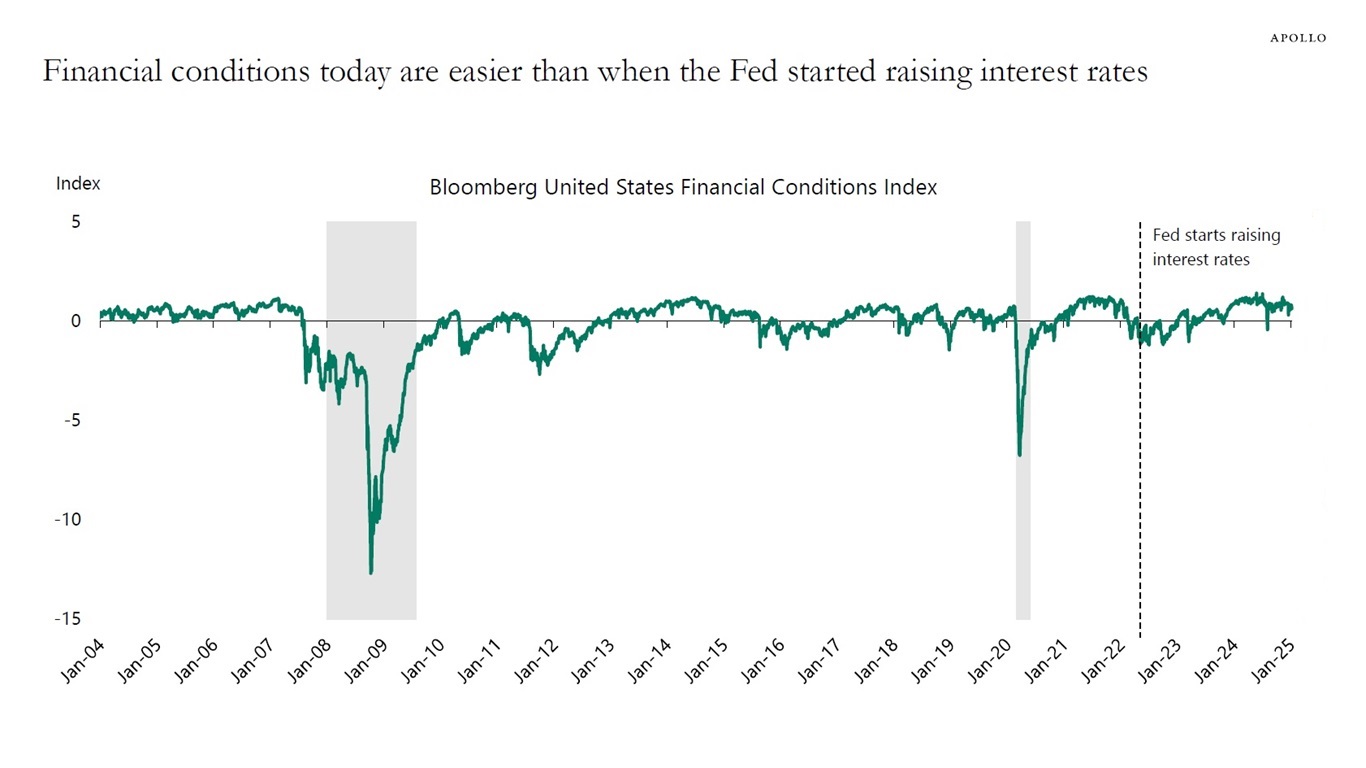
Source: Bloomberg, Apollo Chief Economist 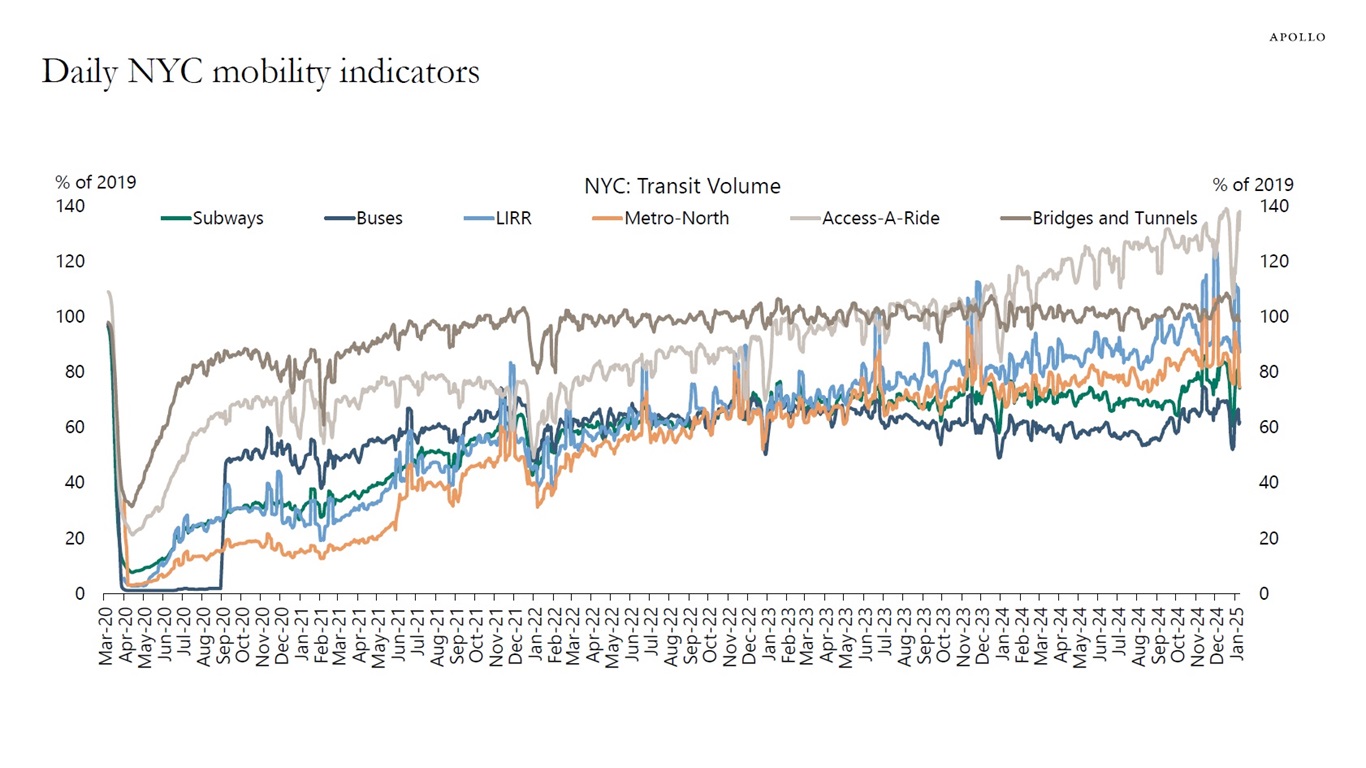
Source: MTA, Apollo Chief Economist See important disclaimers at the bottom of the page.
-
The RealClearMarkets/TIPP Economic Optimism Index measures Americans’ optimism about the US economy.
Specifically, the index is based on a nationwide survey of 1,300 adults and is made up of three subindexes, including one for the respondent’s economic outlook six months into the future, the respondent’s personal financial outlook, and how the respondent views current federal policies.
The latest data shows that US households have turned very optimistic about the US economic outlook in recent months, see chart below.
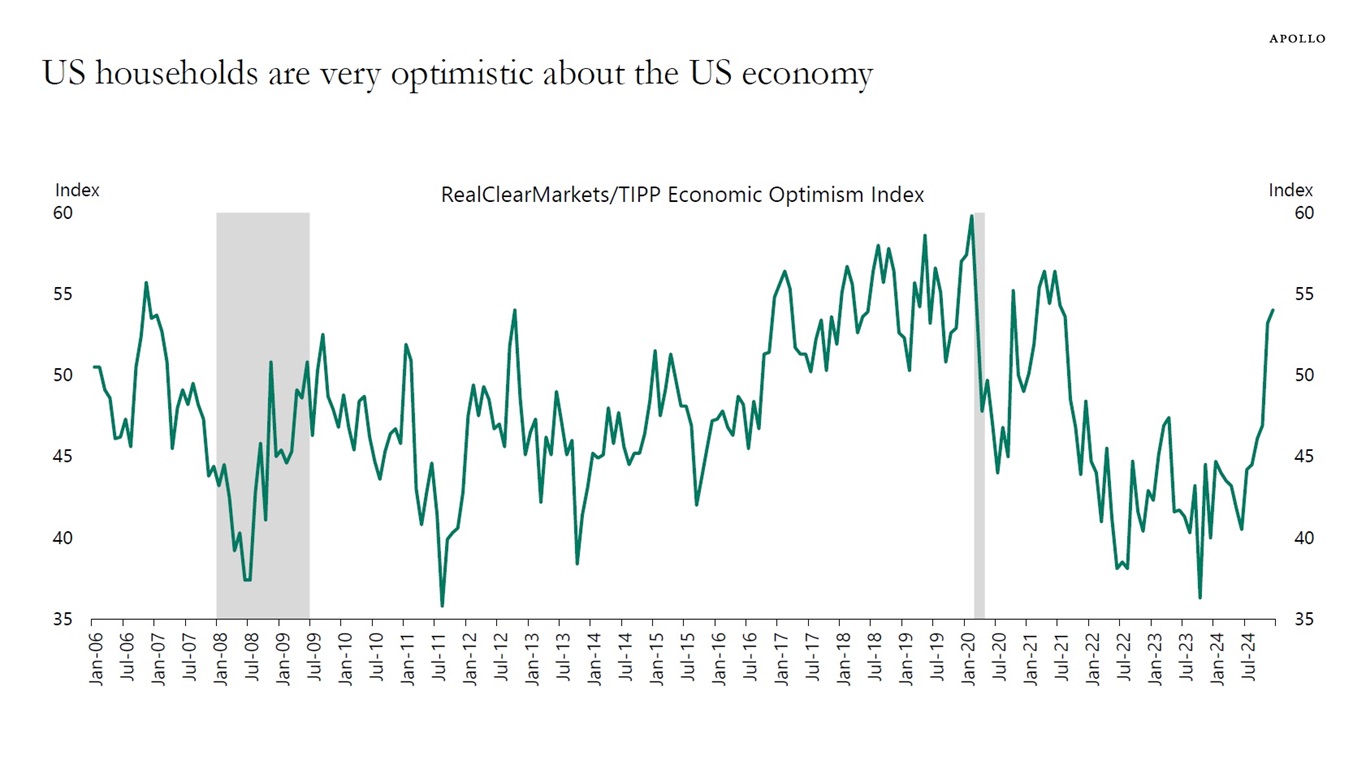
Source: Technometrica Market Intelligence/RealClearMarkets, Apollo Chief Economist See important disclaimers at the bottom of the page.
-
The recent jump in ISM Prices Paid points to a coming reacceleration in both headline and core inflation, see charts below.
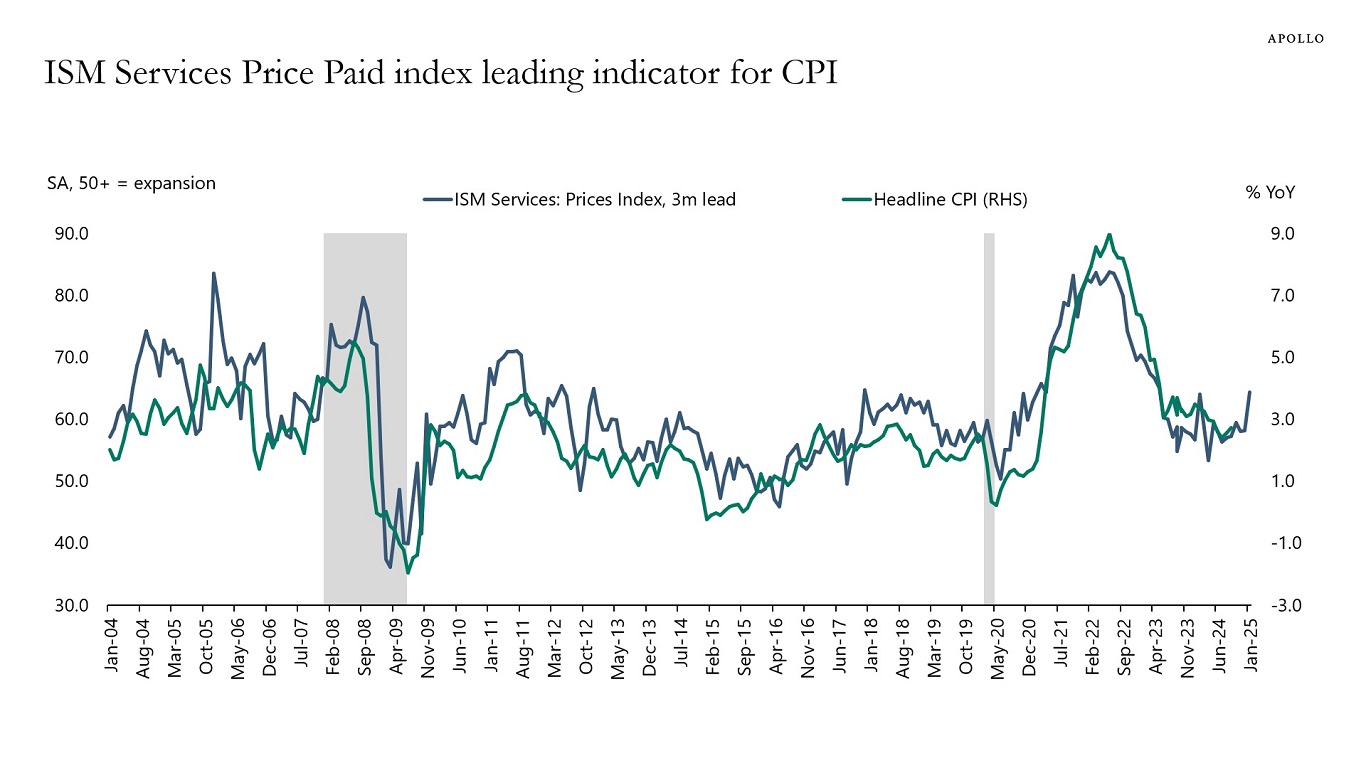
Source: BLS, ISM, Haver Analytics, Apollo Chief Economist 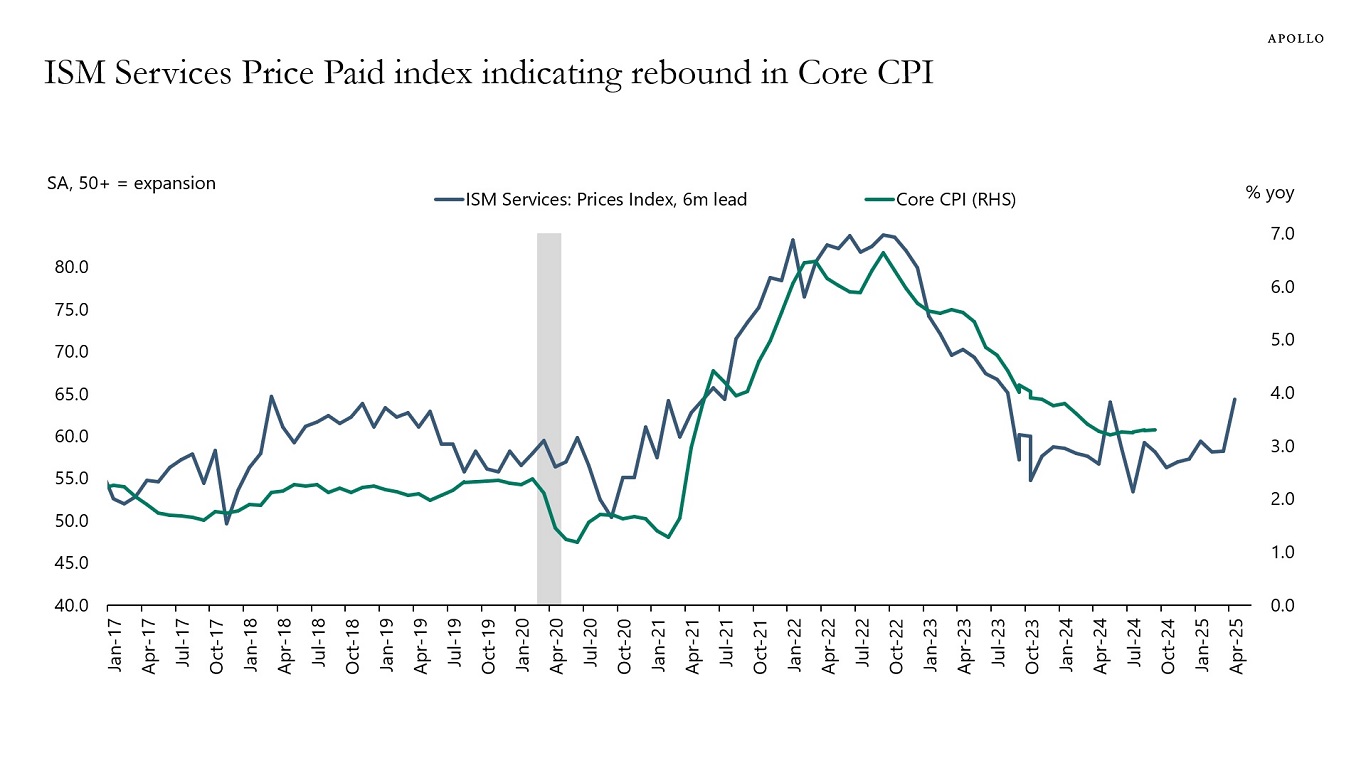
Source: BLS, ISM, Haver Analytics, Apollo Chief Economist 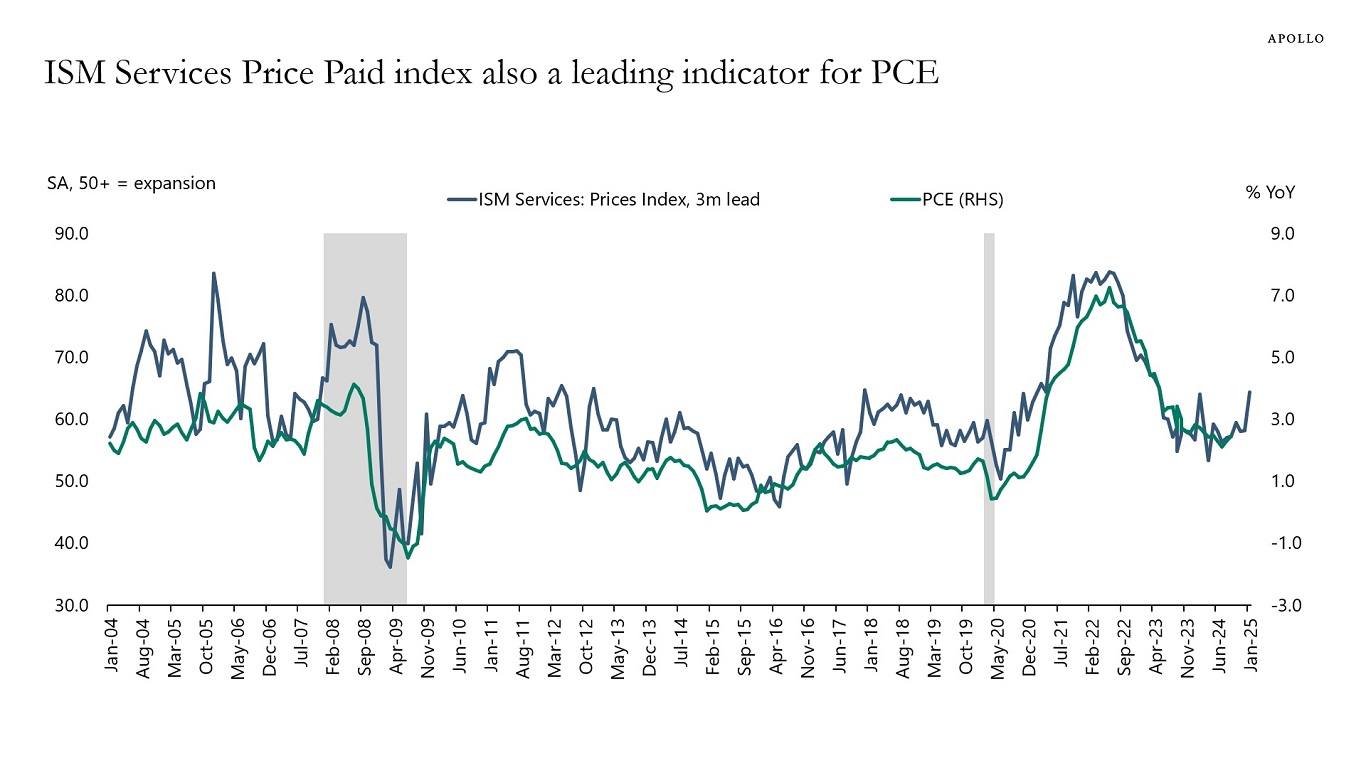
Source: BEA, ISM, Haver Analytics, Apollo Chief Economist 
Source: BEA, ISM, Haver Analytics, Apollo Chief Economist See important disclaimers at the bottom of the page.
-
Growth and inflation are rising in Japan and falling in China. As a result, 30-year government bond yields are now lower in China than in Japan, see chart below.
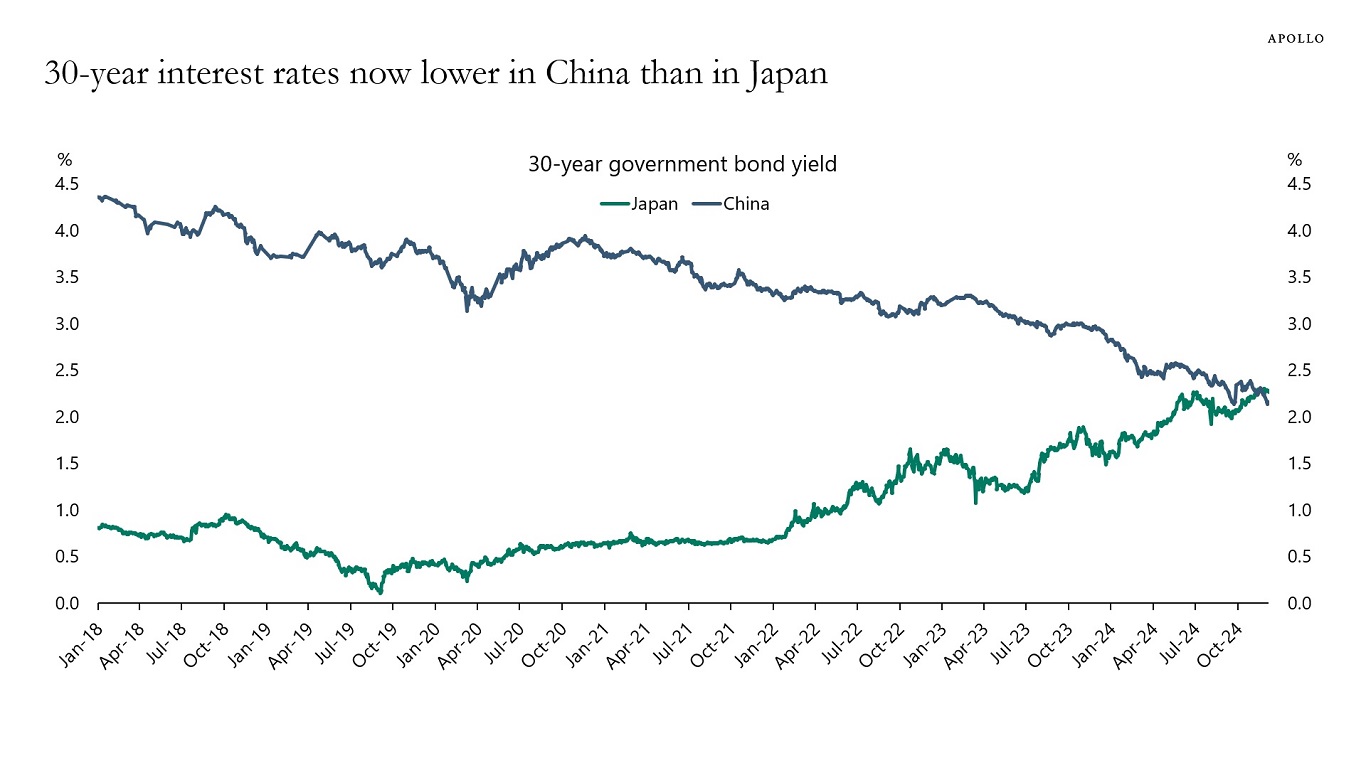
Source: Bloomberg, Apollo Chief Economist See important disclaimers at the bottom of the page.
-
The Fed has cut interest rates 100 basis points since September, and over the same period, 10-year interest rates are up 100 basis points. This is highly unusual, see charts below. Is it fiscal worries? Is it less demand from abroad? Or maybe Fed cuts were not justified? The market is telling us something, and it is very important for investors to have a view on why long rates are going up when the Fed is cutting.
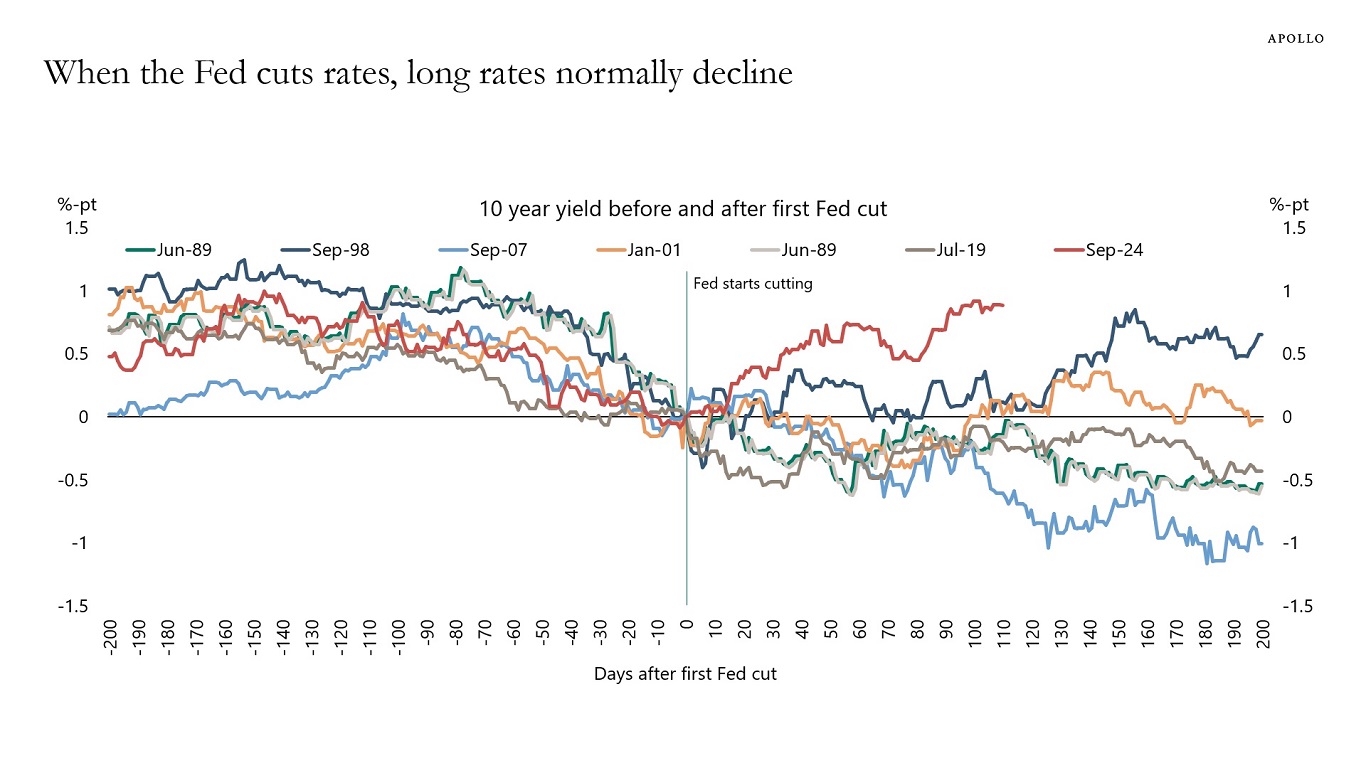
Source: Bloomberg, Apollo Chief Economist 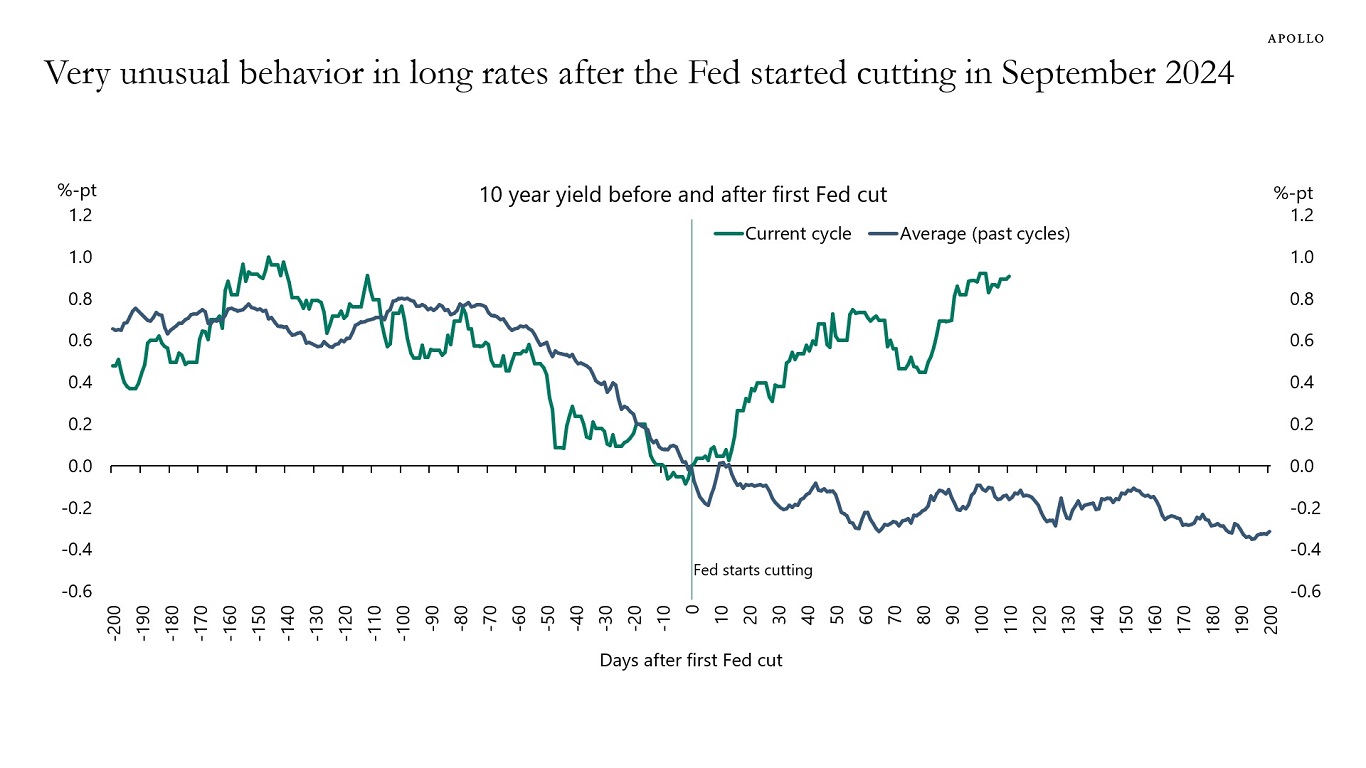
Source: Bloomberg, Apollo Chief Economist See important disclaimers at the bottom of the page.
-
The price-to-book ratio for the S&P 500 is at record-high levels, see chart below. This is another piece of evidence that stocks are expensive at the moment.
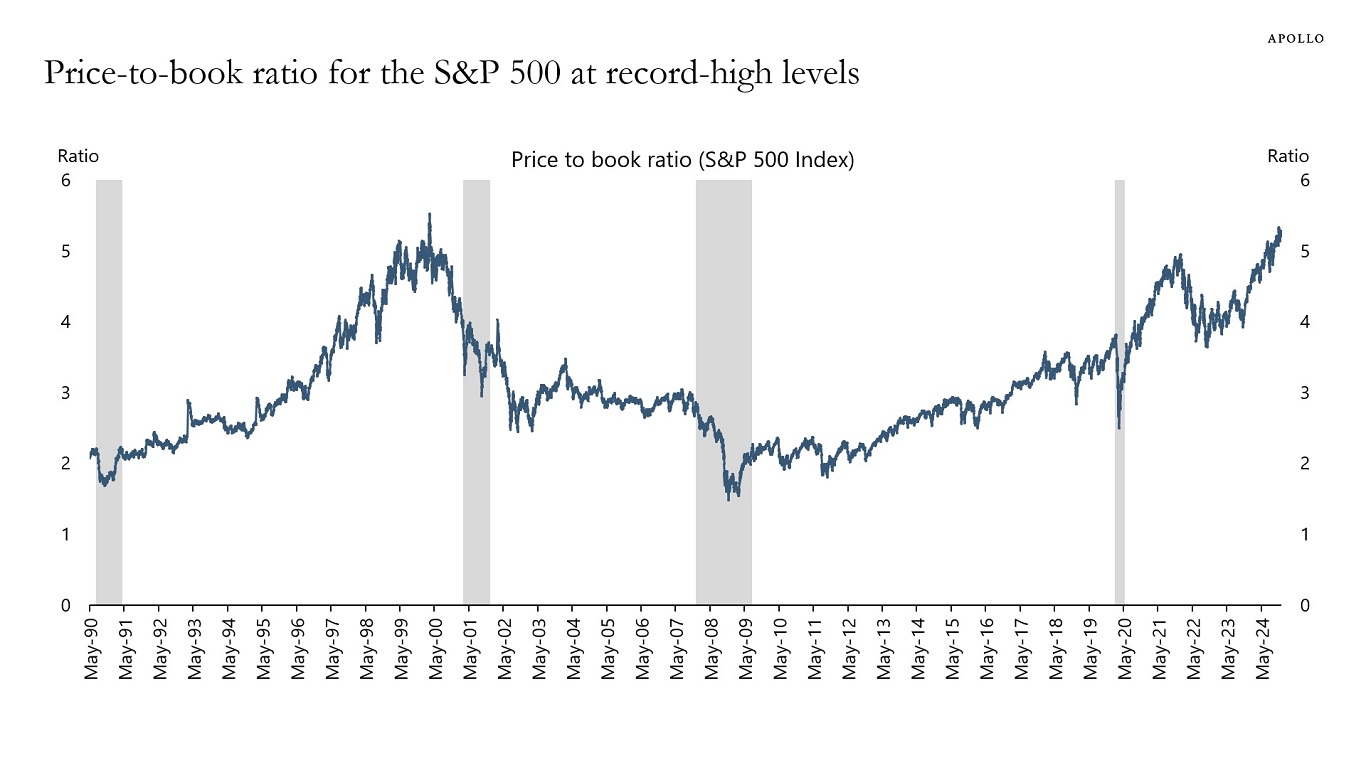
Source: Bloomberg, Apollo Chief Economist See important disclaimers at the bottom of the page.
-
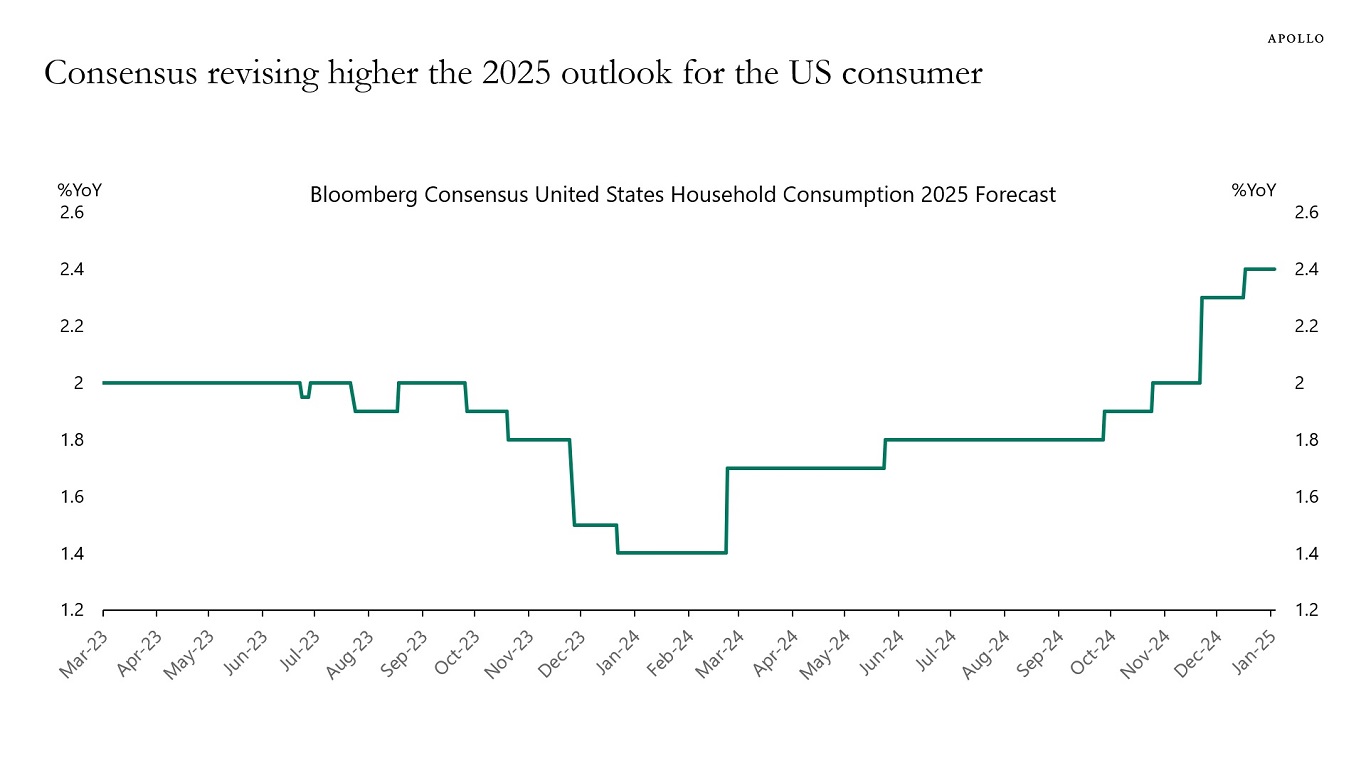
The US consumer is in incredible shape.
Specifically:
– The incoming weekly data shows continued strength in consumer spending, and outlook surveys show continued strength ahead (Charts 1 to 3).
– Credit card debt as a share of disposable income is below pre-pandemic levels (Chart 4).
– The effective interest rate on mortgage debt outstanding is only 4% (Chart 5).
– Households are reporting that it is easier to get access to credit, and banks are more willing to lend to consumers (Charts 6 and 7).
– HELOC balances are rising, and savings are rising for most households across the income distribution (Charts 8 and 9).
– Debt to disposable income is declining, and US households are in much better shape than households in Canada and Australia (Chart 10).
The bottom line is that incomes are high, stock prices are high, home prices are high, debt levels are low, interest rate sensitivity is low, and banks are more willing to lend to households.
There are significant upside risks to US growth, inflation, and interest rates as we enter 2025.
Source: Bloomberg, Apollo Chief Economist 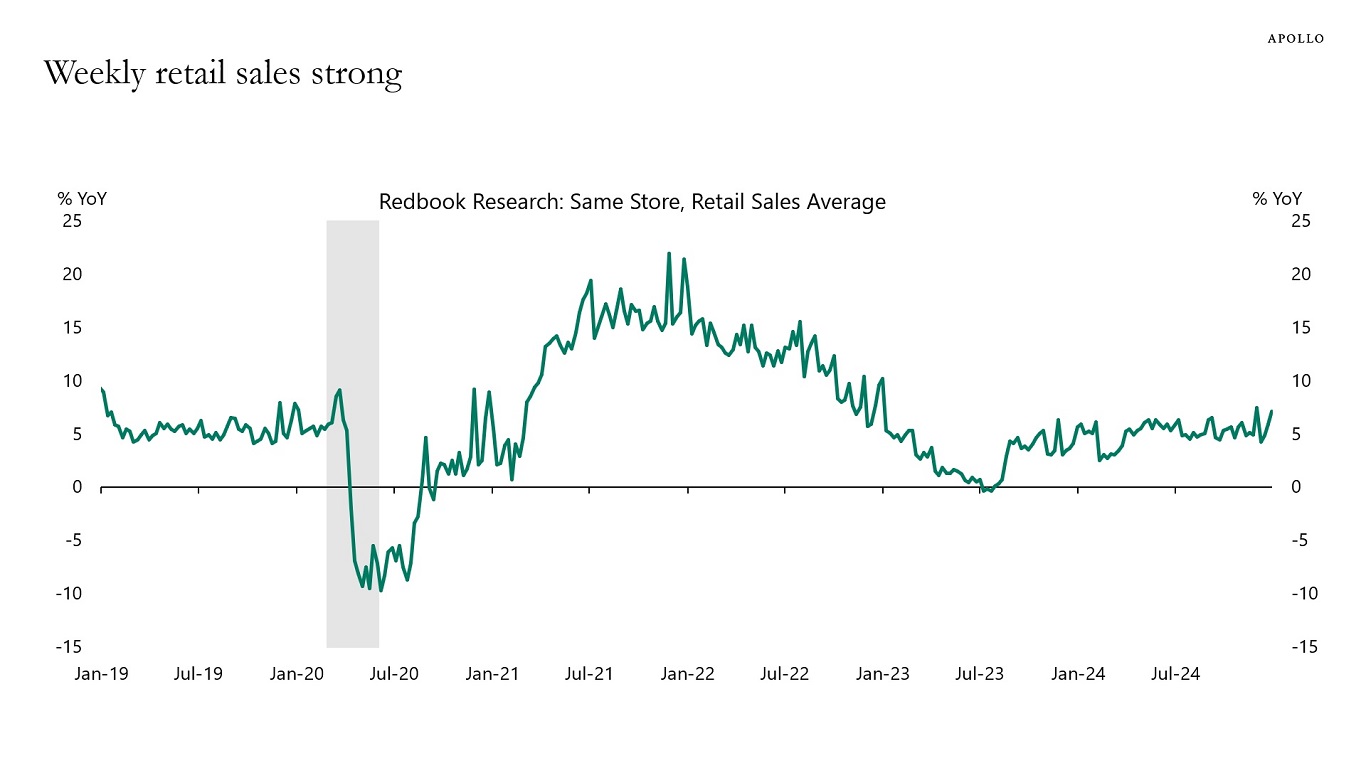
Source: Redbook, Haver Analytics, Apollo Chief Economist 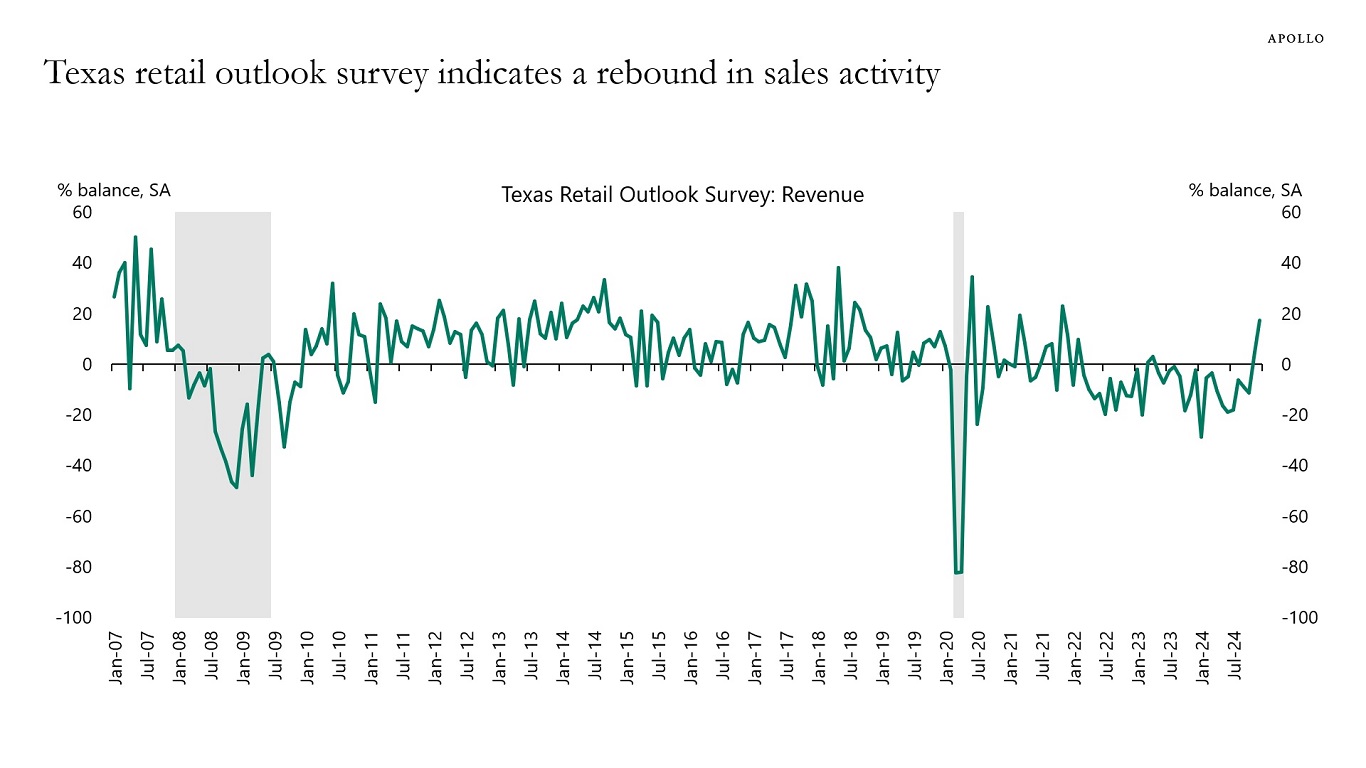
Note: Data was collected December 17–25, and 271 of the 379 Texas service sector business executives surveyed submitted responses. The Dallas Fed conducts the Texas Service Sector Outlook Survey monthly to obtain a timely assessment of the state’s service sector activity. Firms are asked whether revenue, employment, prices, general business activity and other indicators increased, decreased or remained unchanged over the previous month. Source: Federal Reserve Bank of Dallas, Haver Analytics, Apollo Chief Economist 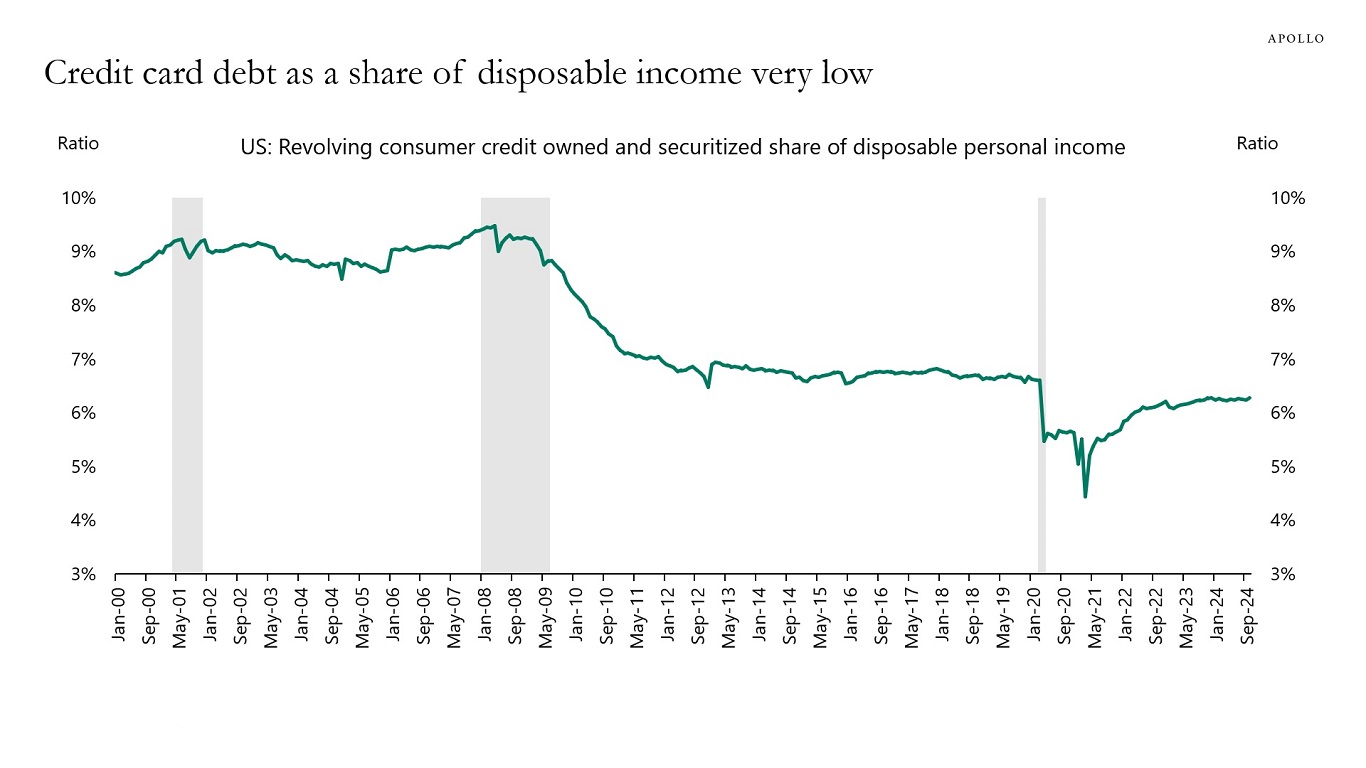
Source: FRB, BEA, Haver Analytics, Apollo Chief Economist 
Note: The effective interest rate (%) reflects the amortization of initial fees and charges over a 10-year period, which is the historical assumption of the average life of a mortgage loan. Source: Freddie Mac, BEA, Bloomberg, Apollo Chief Economist 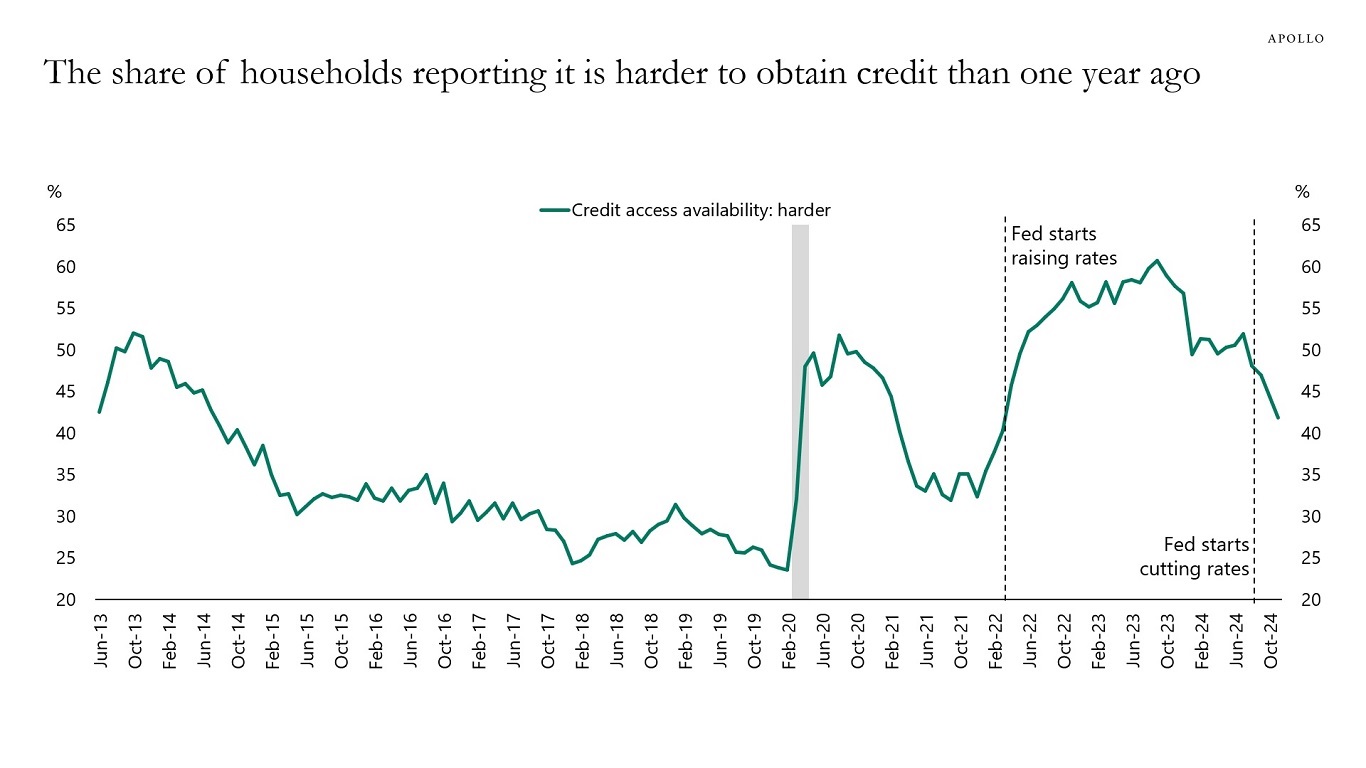
Note: Harder = much harder + somewhat harder. Source: FRBNY, Haver Analytics, Apollo Chief Economist 
Source: FRB, Bloomberg, Apollo Chief Economist 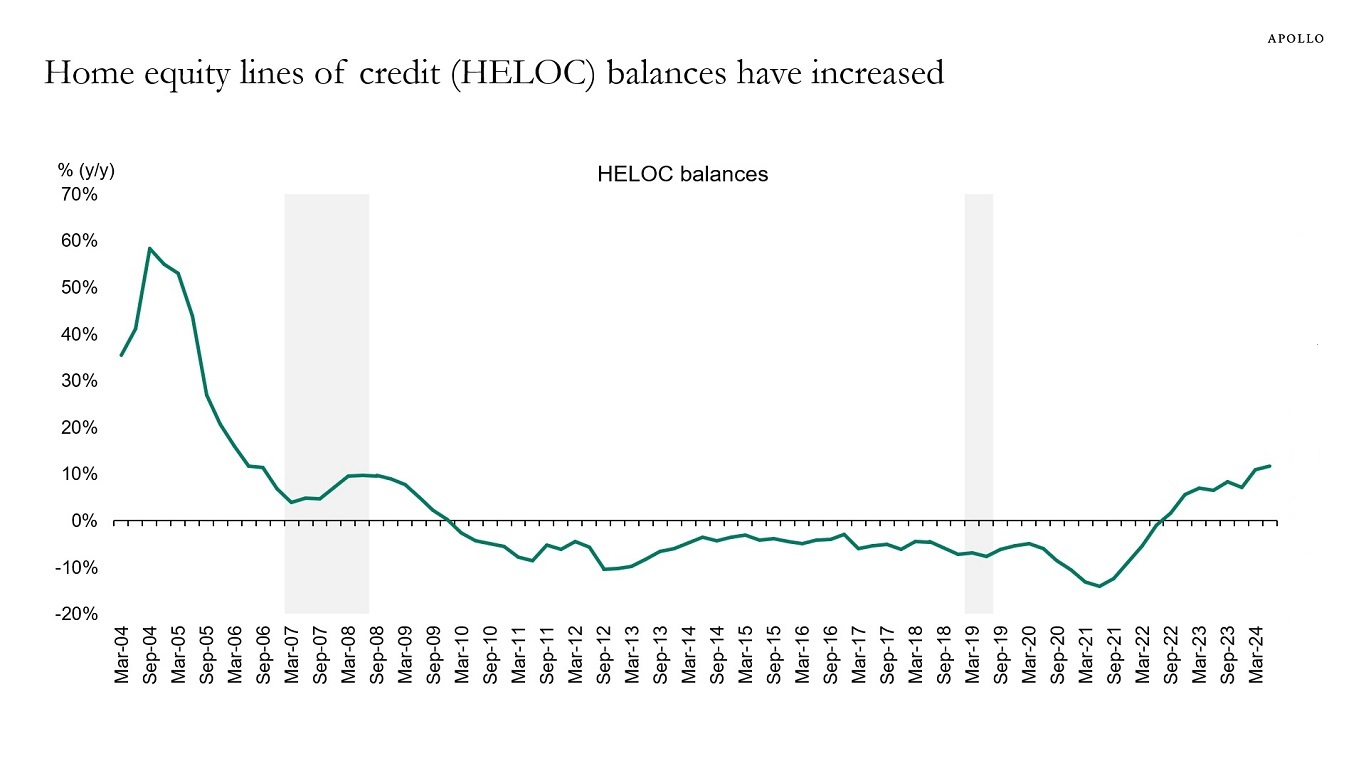
Source: New York Fed Consumer Credit Panel/ Equifax, Apollo Chief Economist 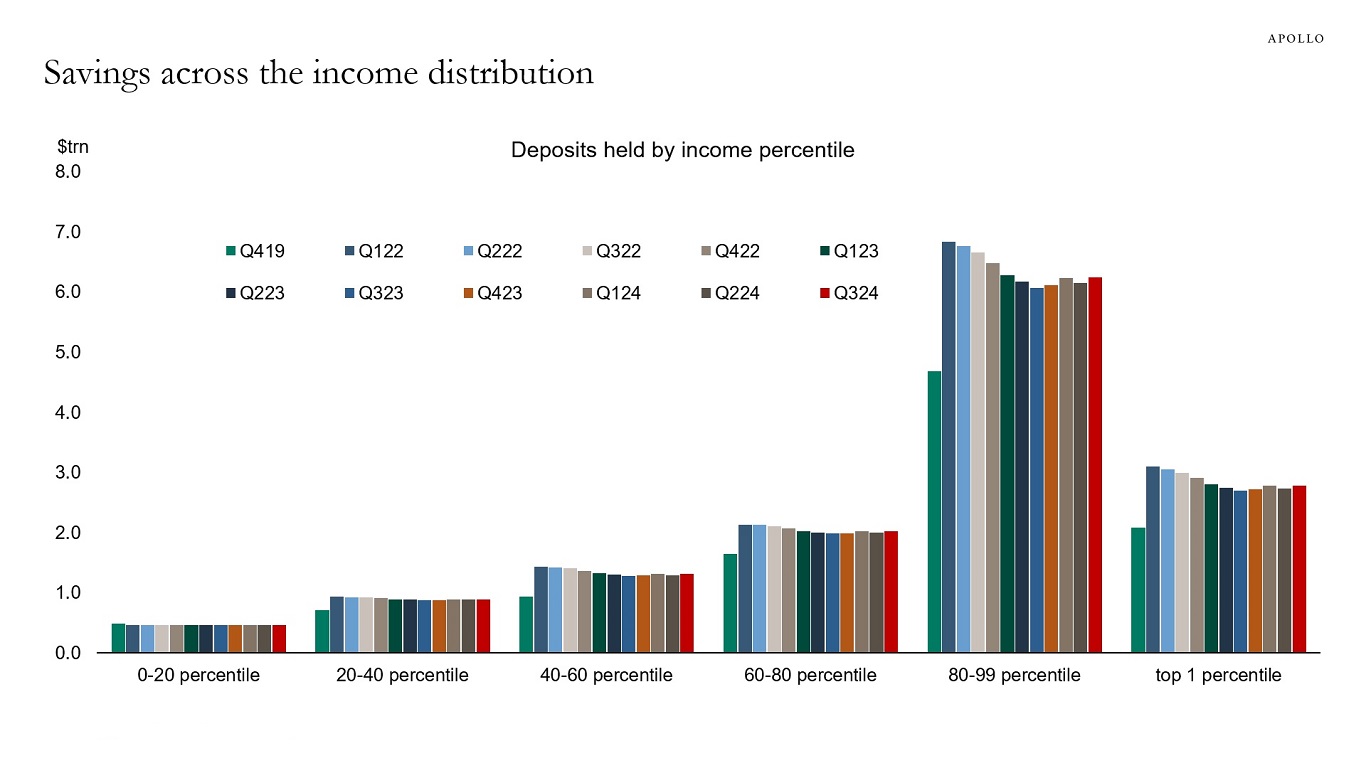
Source: FRB, Haver Analytics, Apollo Chief Economist 
Source: Statistics Canada, Reserve Bank of Australia, Bloomberg, Apollo Chief Economist See important disclaimers at the bottom of the page.
-
After the Fed started raising interest rates in March 2022, the banking sector started pulling back, and the decline in credit growth was magnified by the regional banking crisis in March 2023.
With the Fed signaling throughout 2024 that rate cuts are coming, banks are now showing more willingness to lend.
Our updated US banking sector outlook is available here. The charts below show that unrealized losses on investment securities are improving, the share of households reporting that it is harder to obtain credit than a year ago is declining, lending standards on consumer loans are improving, banks are more willing to lend, and loan growth is rising, driven by the large banks.
The bottom line is that tailwinds to the economic outlook in 2025 are driven not only by high stock prices, high home prices, low unemployment, and potential Trump economic policies, but also by banks easing credit conditions as a result of the Fed signaling lower rates ahead.
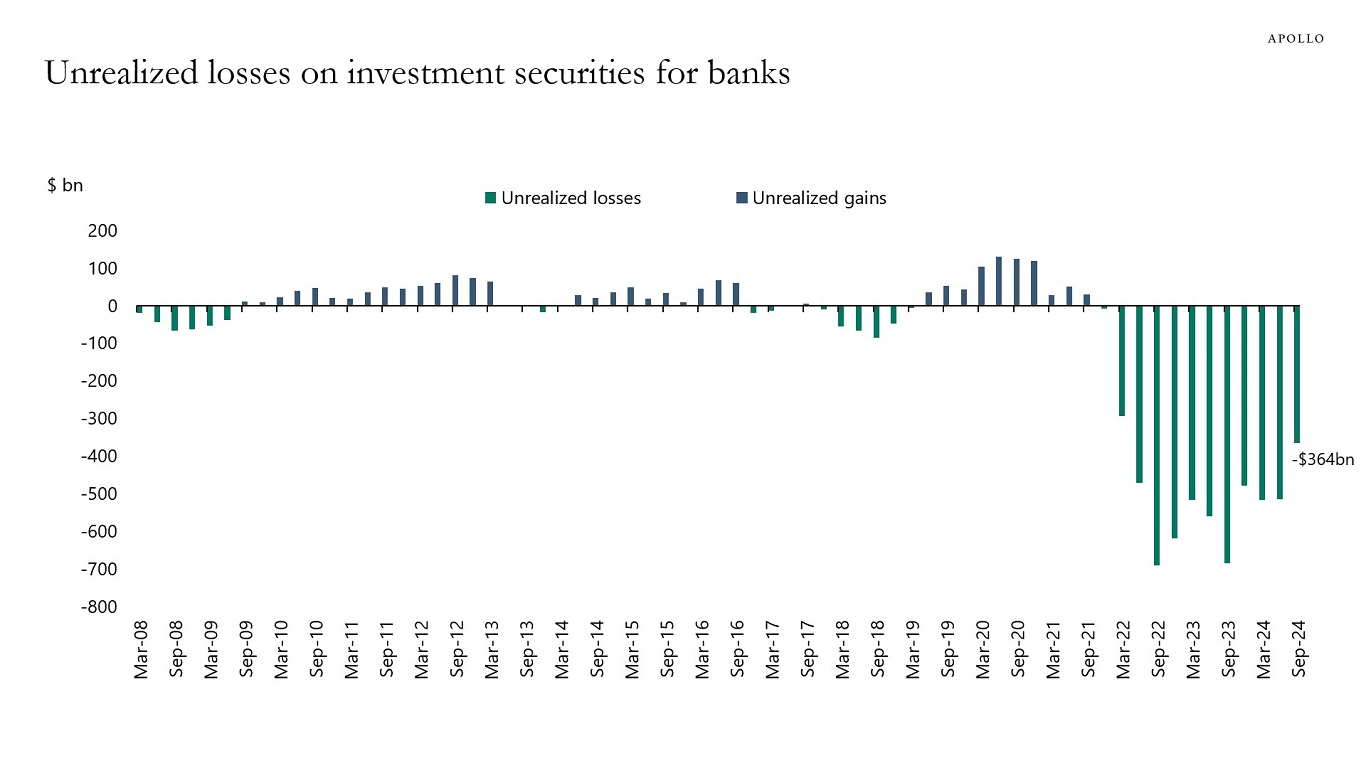
Source: FDIC, Apollo Chief Economist 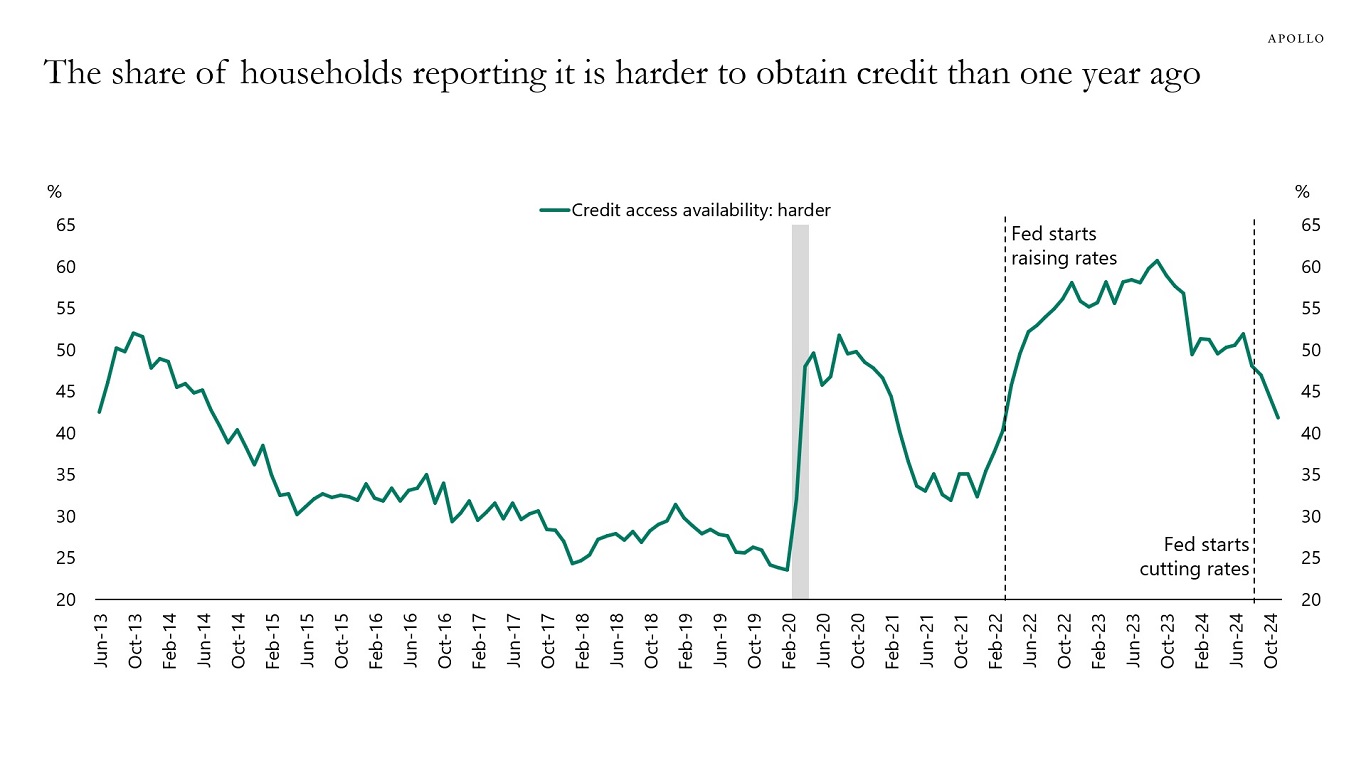
Note: Harder = much harder + somewhat harder. Source: FRBNY, Haver Analytics, Apollo Chief Economist 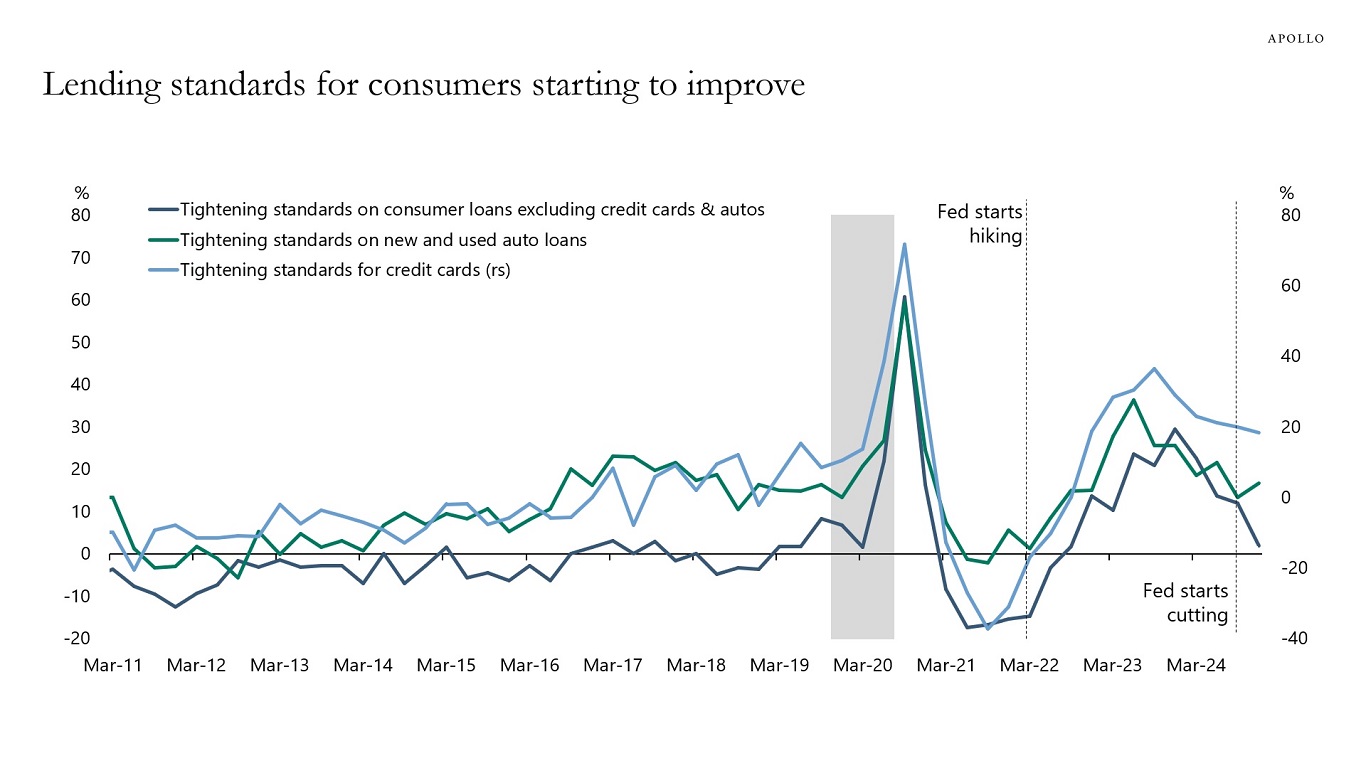
Source: FRB, Bloomberg, Apollo Chief Economist 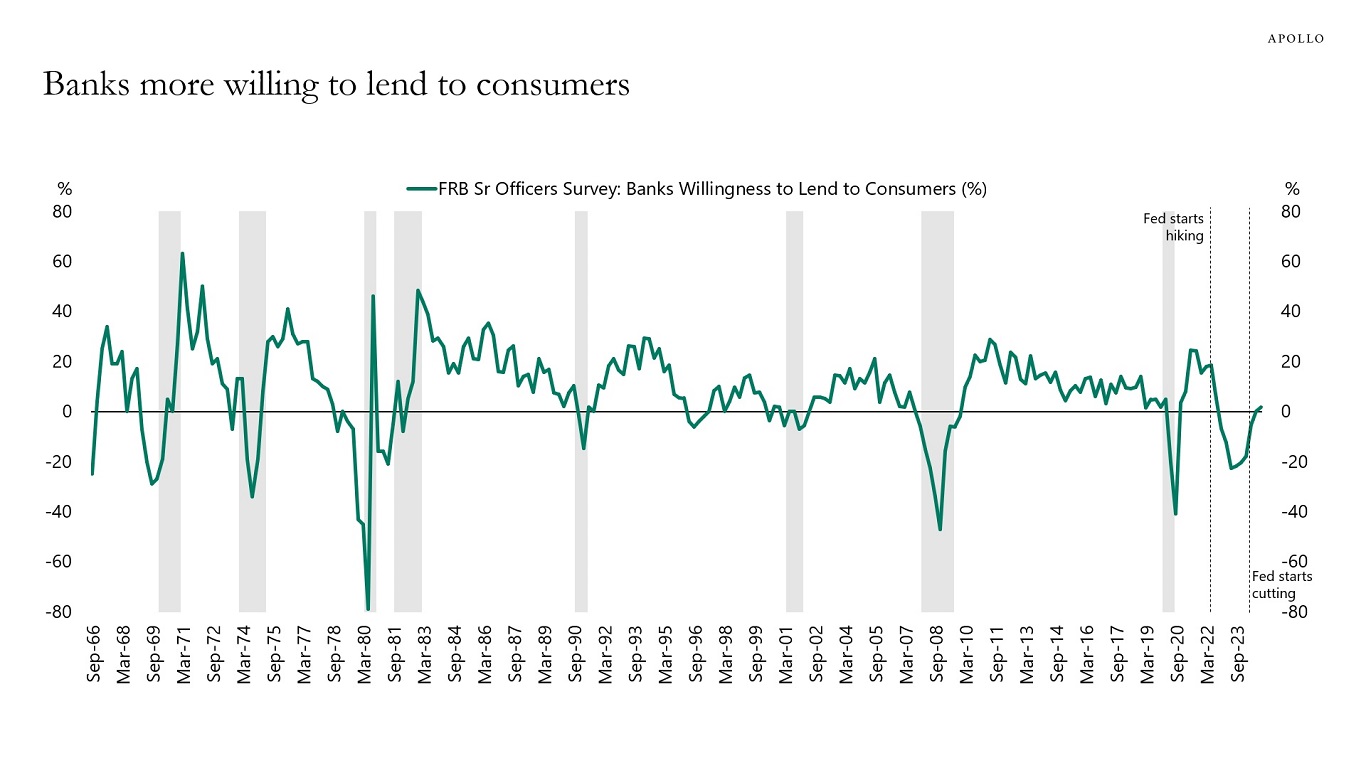
Source: FRB, Bloomberg, Apollo Chief Economist 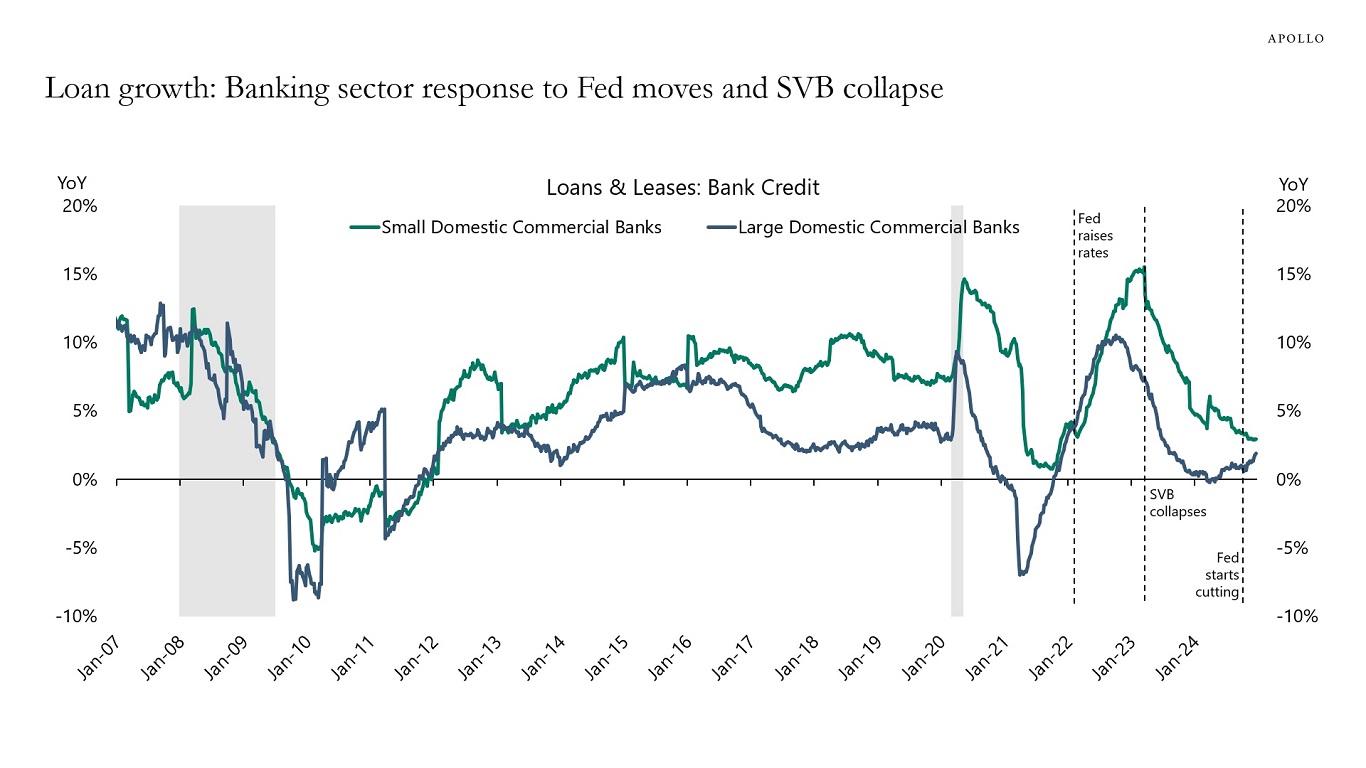
Source: Federal Reserve Board, Haver Analytics, Apollo Chief Economist See important disclaimers at the bottom of the page.

This presentation may not be distributed, transmitted or otherwise communicated to others in whole or in part without the express consent of Apollo Global Management, Inc. (together with its subsidiaries, “Apollo”).
Apollo makes no representation or warranty, expressed or implied, with respect to the accuracy, reasonableness, or completeness of any of the statements made during this presentation, including, but not limited to, statements obtained from third parties. Opinions, estimates and projections constitute the current judgment of the speaker as of the date indicated. They do not necessarily reflect the views and opinions of Apollo and are subject to change at any time without notice. Apollo does not have any responsibility to update this presentation to account for such changes. There can be no assurance that any trends discussed during this presentation will continue.
Statements made throughout this presentation are not intended to provide, and should not be relied upon for, accounting, legal or tax advice and do not constitute an investment recommendation or investment advice. Investors should make an independent investigation of the information discussed during this presentation, including consulting their tax, legal, accounting or other advisors about such information. Apollo does not act for you and is not responsible for providing you with the protections afforded to its clients. This presentation does not constitute an offer to sell, or the solicitation of an offer to buy, any security, product or service, including interest in any investment product or fund or account managed or advised by Apollo.
Certain statements made throughout this presentation may be “forward-looking” in nature. Due to various risks and uncertainties, actual events or results may differ materially from those reflected or contemplated in such forward-looking information. As such, undue reliance should not be placed on such statements. Forward-looking statements may be identified by the use of terminology including, but not limited to, “may”, “will”, “should”, “expect”, “anticipate”, “target”, “project”, “estimate”, “intend”, “continue” or “believe” or the negatives thereof or other variations thereon or comparable terminology.