


Want it delivered daily to your inbox?
-
The Bloomberg US IG Aggregate Bond Index includes Treasuries, corporate bonds, and MBS, and currently, 80% of the index is trading below par.
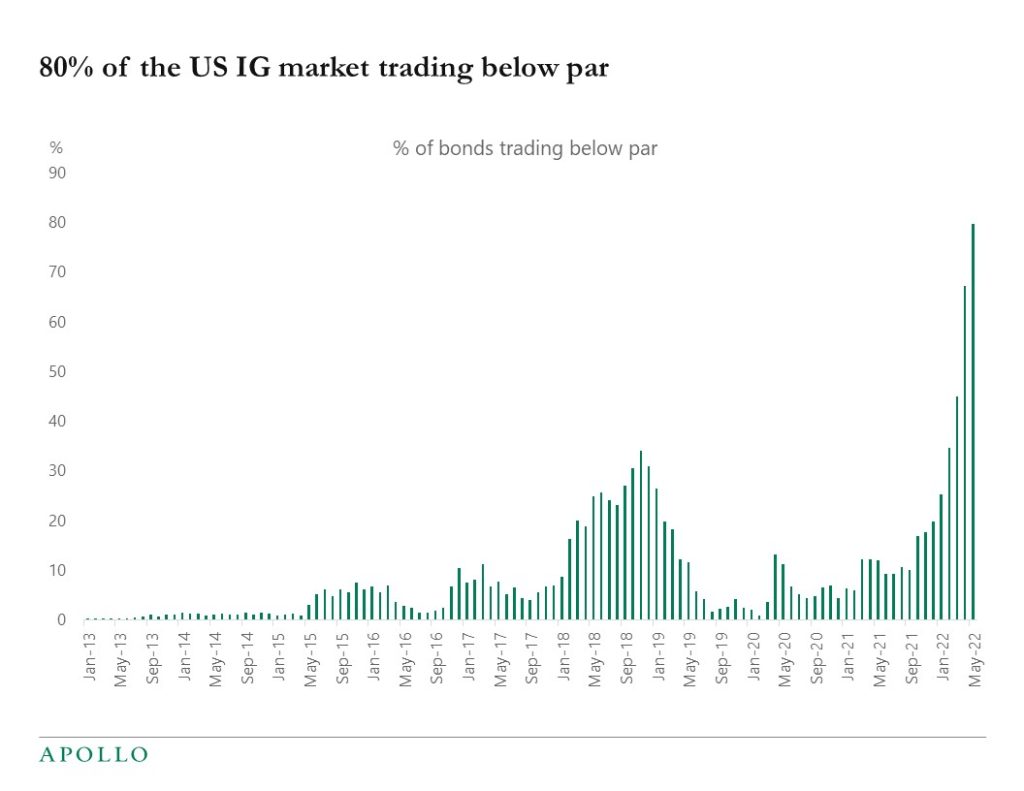
Source: Bloomberg, Apollo Chief Economist. Note: Data used for members in the LBUSTRUU Index as of 11th May 2022. See important disclaimers at the bottom of the page.
-
The venture capital index seen in the chart below measures the value of the US-based venture capital private company universe in which venture capital funds invest. It shows that venture capital valuations have so far fallen 56% from their peak. And there is likely more downside over the coming quarters given the consensus expectation that inflation at the end of 2022 will be 5%, which is still significantly above the Fed’s 2% inflation target. The bottom line for markets is that as long as inflation is meaningfully above the Fed’s target, we will continue to see turbulence in markets, particularly in long-duration assets such as tech and venture capital.
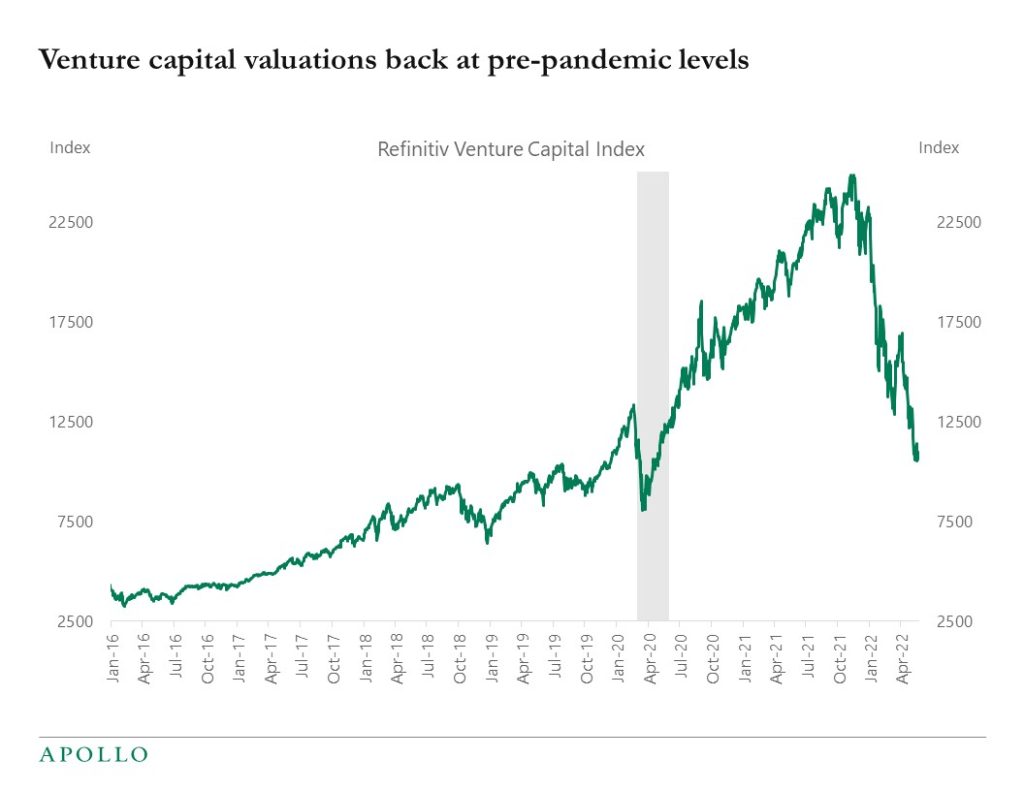
Source: Bloomberg, Apollo Chief economist. Note: The Refinitiv Venture Capital Index is designed to measure the value of the US-based venture capital private company universe in which venture capital funds invest. See important disclaimers at the bottom of the page.
-
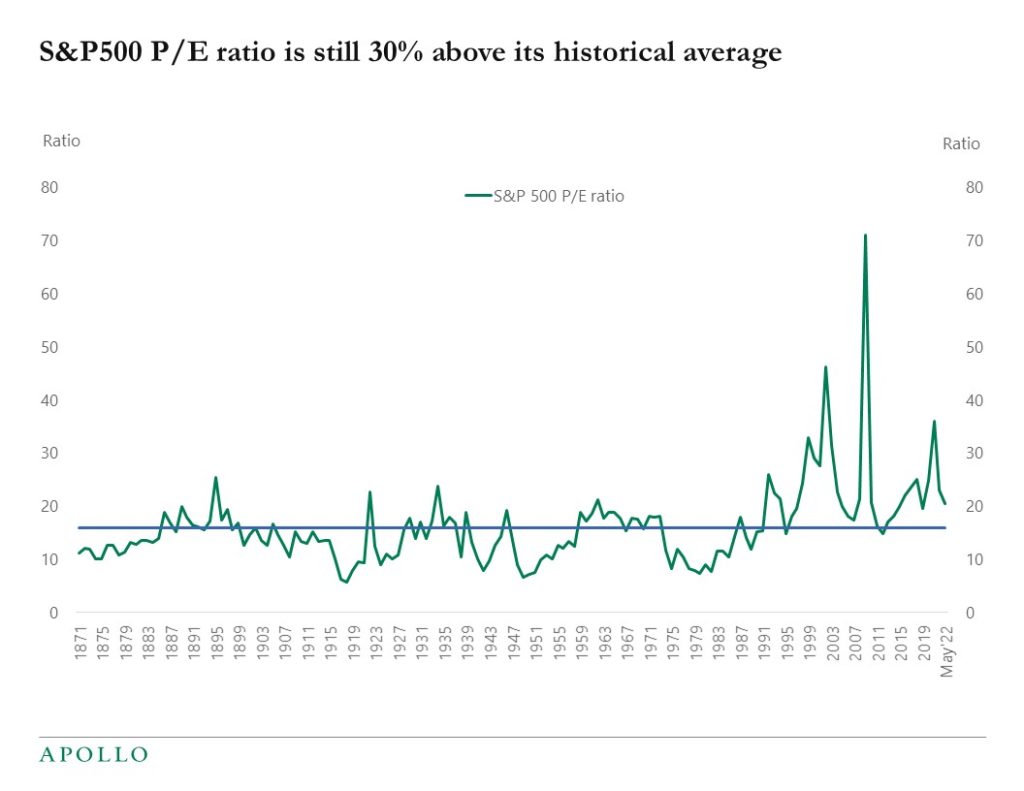
The P/E ratio for the S&P500 is today about 30% above its historical average, see the first chart. And the Shiller Cyclically-Adjusted P/E ratio, which adjusts earnings for inflation, is about 50% above its historical average, see the second chart.
The problem for the stock market is inflation. As long as inflation is significantly above the Fed’s 2% target, the FOMC will remain hawkish and try to tighten financial conditions to slow down growth, which is negative for the equity market.
The consensus currently expects CPI and PCE inflation at the end of this year to be between 4% and 6%, which suggests that we will have to get into 2023 before we know that we are not in a new regime with permanently higher inflation.
The key question for all markets is the following: How will the Fed respond later this year when the unemployment rate begins to move higher if inflation is still around 5%, as the consensus expects? And if the Fed turns dovish later this year in response to rising unemployment, how will long rates and breakevens then respond? It will ultimately be a test whether the Fed will put more weight on rising unemployment or on too high inflation.
Source: Robert Shiller, Apollo Chief Economist. Note: Price to earnings ratio, based on trailing twelve months “as reported” earnings. 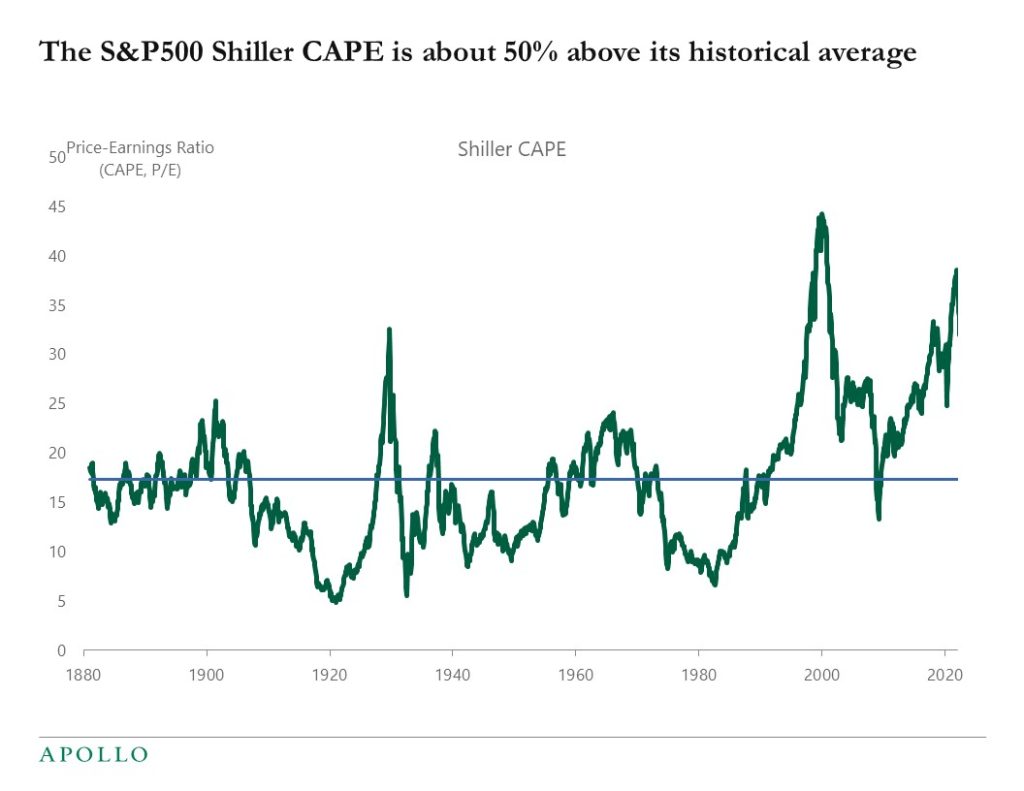
Robert Shiller, Apollo Chief Economist. Note: Price to earnings ratio, based on trailing twelve months “as reported” earnings. See important disclaimers at the bottom of the page.
-
During the pandemic, the US economy lost 22 million jobs, and two years later, we have now re-created 21 million of those jobs, see the first chart below. The second and third charts show the sector distribution of the rebound in jobs. The level of employment in sectors within leisure and hospitality is still below pre-pandemic levels. In contrast, employment in industries such as air transportation, warehouses, and construction is now above pre-pandemic levels. The bottom line is that during the pandemic, we have seen a change in the composition of employment with solid growth in jobs in the goods sector and, more recently, strong growth in employment in the service sector. View our full employment report.
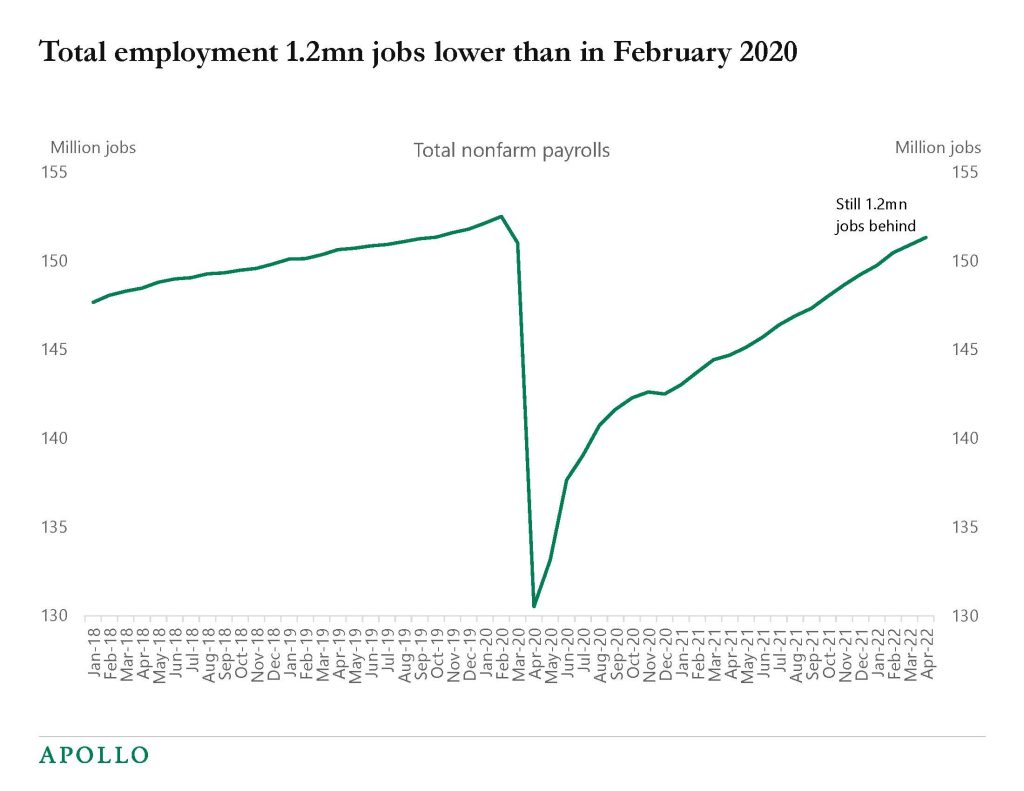
Source: BLS, Apollo Chief Economist 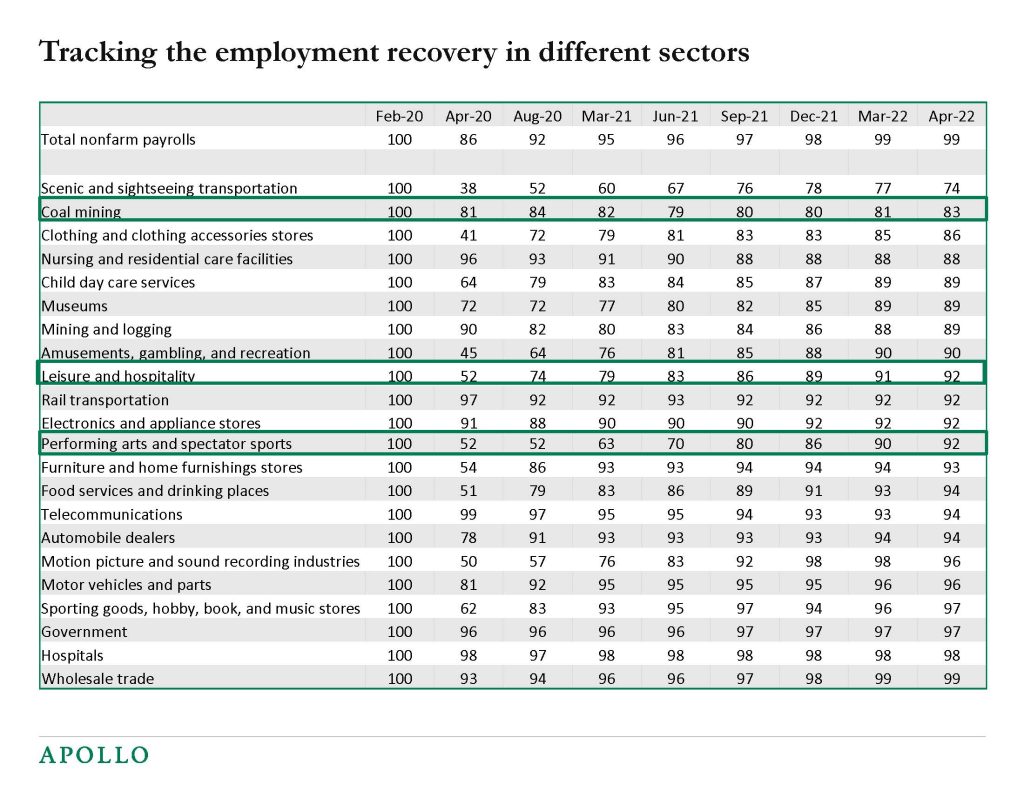
Source: BLS, Apollo Chief Economist 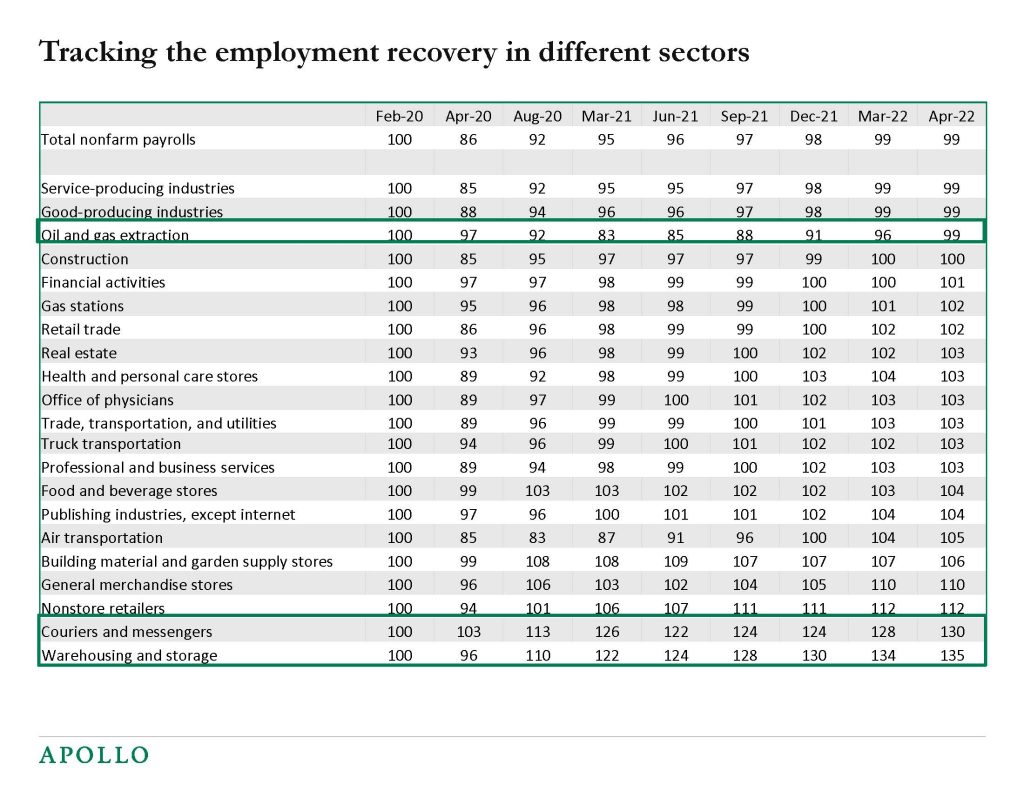
Source: BLS, Apollo Chief Economist See important disclaimers at the bottom of the page.
-
Our chartbook with daily and weekly indicators for the US economy is available here, and the bottom line is that there are basically no signs of the economy slowing down. The chart of the week is the weekly hotel data, and it shows that RevPAR and the occupancy rate continue to move higher, see chart below.
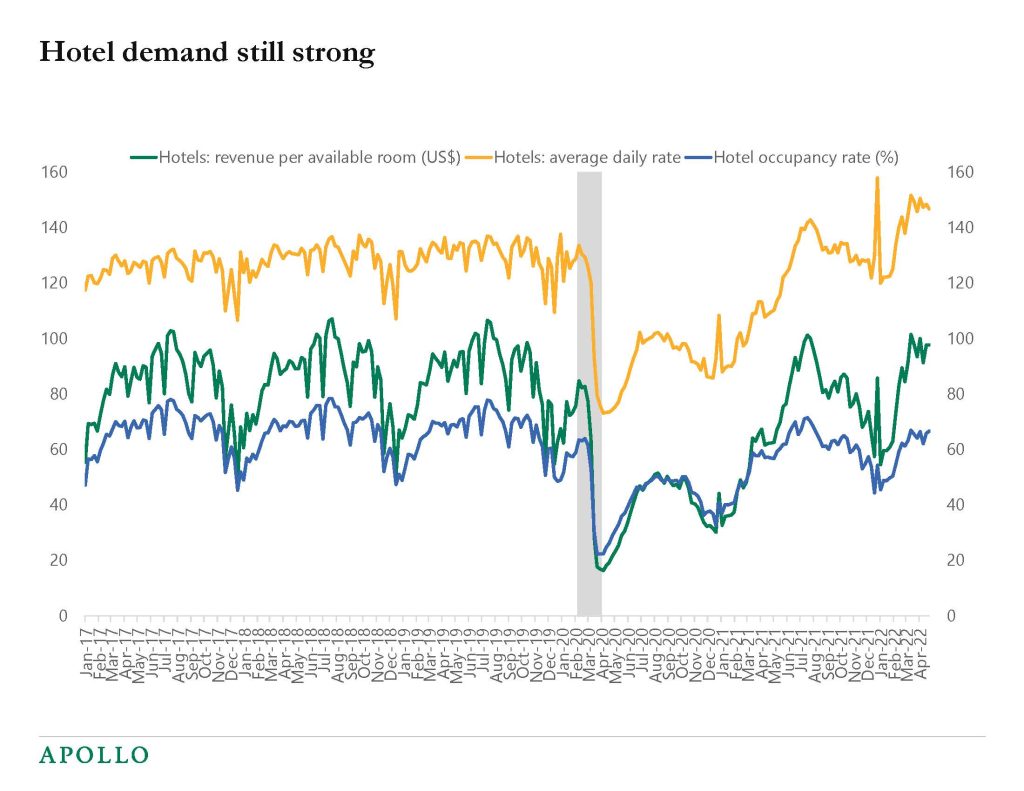
Source: STR, Haver Analytics, Apollo Chief Economist See important disclaimers at the bottom of the page.
-
The first chart below shows that there are currently 11.5 million job openings and 6 million unemployed. The second chart shows that in leisure and hospitality there are more than two job openings per unemployed. The last graph shows that most job openings are in small firms with less than 250 employees. This data points to an overheated labor market with significant upward wage pressure. With this backdrop, the Fed will continue to push up short rates and long rates (via QT) to cool down labor demand, and it could take several quarters before the labor market cools enough for the Fed to turn less hawkish.
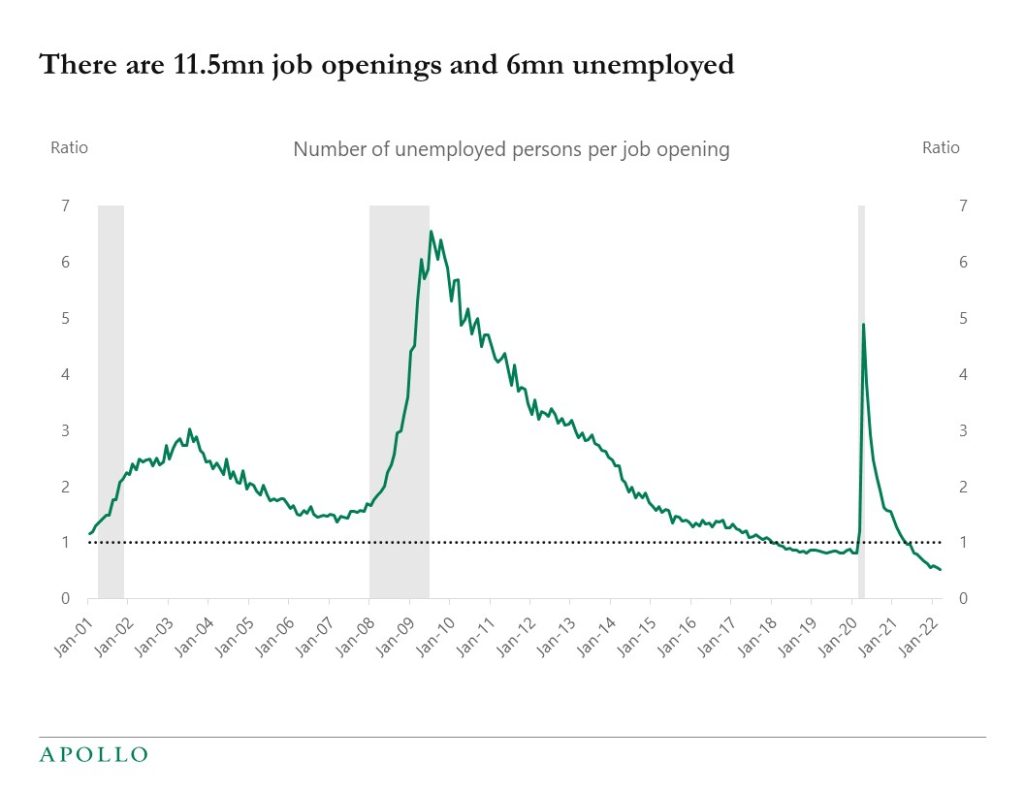
Source: BLS, Haver Analytics, Apollo Chief Economist 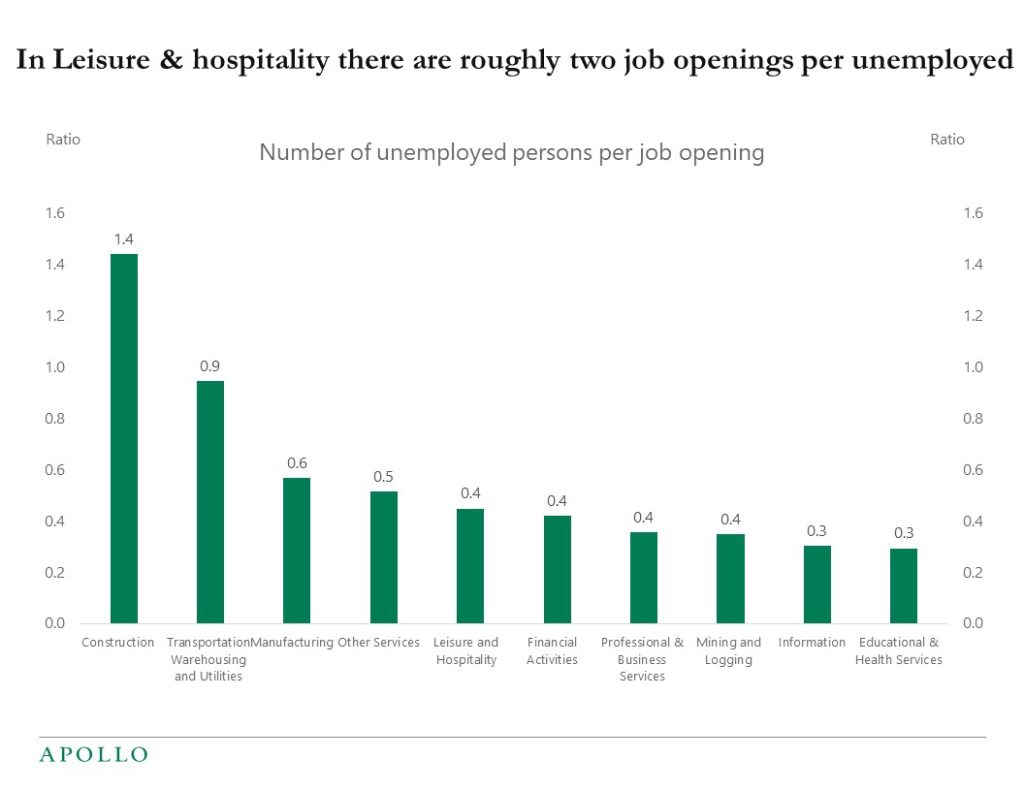
Source: BLS, Haver Analytics, Apollo Chief Economist 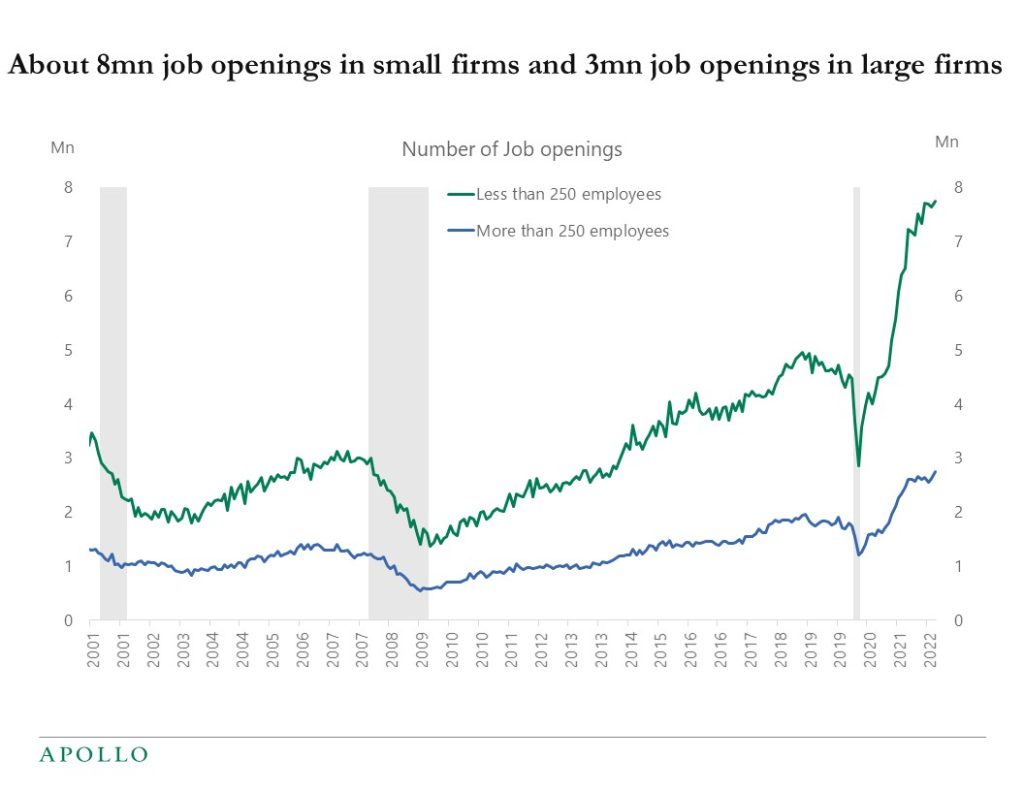
Source: BLS, Haver Analytics, Apollo Chief Economist See important disclaimers at the bottom of the page.
-
Fed Chair Powell said yesterday that the FOMC wants to tighten financial conditions. Investors must monitor to what degree this policy goal is achieved through wider credit spreads, lower equities, and/or higher interest rates.
This chart book looks at recent trends in credit markets, and the conclusion is that yield levels are rising, and IG spreads and HY spreads have widened. But with unemployment at 3.6% and inflation at 8.5%, there is still some way to go before the economy begins to cool down. The bottom line is that the Fed needs to continue to tighten financial conditions because of significantly elevated inflation levels, and some of this tightening will come in the form of wider credit spreads. As a result, the ongoing turbulence in markets is likely to continue until we begin to see inflation trend meaningfully lower.
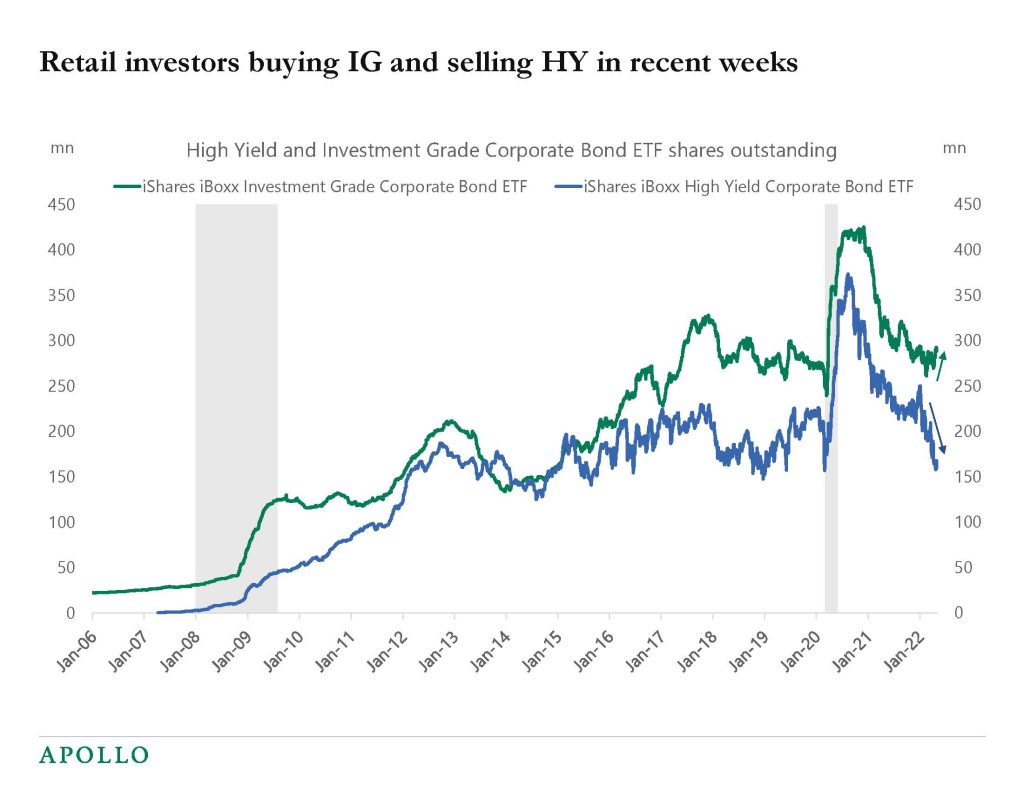
Source: Bloomberg, Apollo Chief Economist. Note: Tickers used are HYG US Equity and LQD US Equity. See important disclaimers at the bottom of the page.
-
This chart book looks at a broad range of supply chain indicators, and the conclusion is that things are getting better. So far, there are no signs that lockdowns in Beijing and Shanghai are having a major negative impact on global supply chains.
See important disclaimers at the bottom of the page.
-
The Fed wants to tighten financial conditions to cool down inflation, and investors passively holding the S&P500 and the Investment Grade credit index are so far down 13% and 16% from their peaks, see charts below. The next step is to monitor for any sign of a slowdown in the economic data. The consensus expects the April employment report on Friday to come in at 391K and the unemployment rate to decline to 3.5%, suggesting that the consensus does not yet see any signs of a slowdown in the economy. For more, see our chart book I sent around on Saturday with daily and weekly indicators for the US economy.
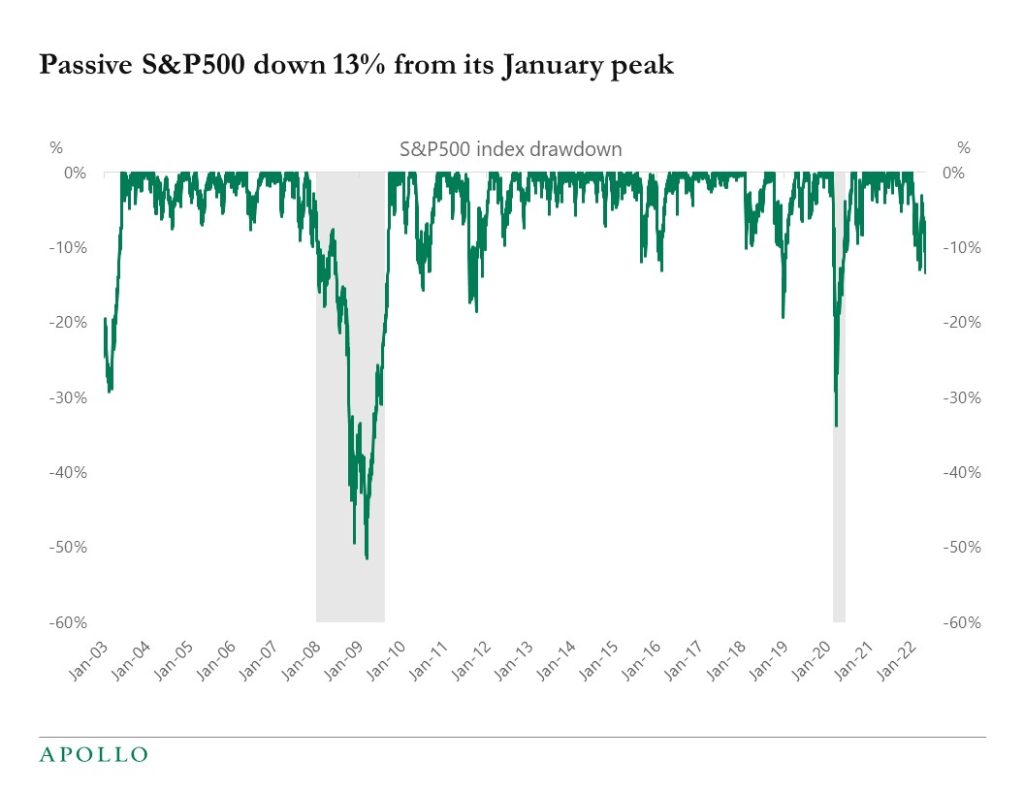
Source: Bloomberg, Apollo Chief Economist. Note: Bloomberg ticker used for S&P500: SPY. 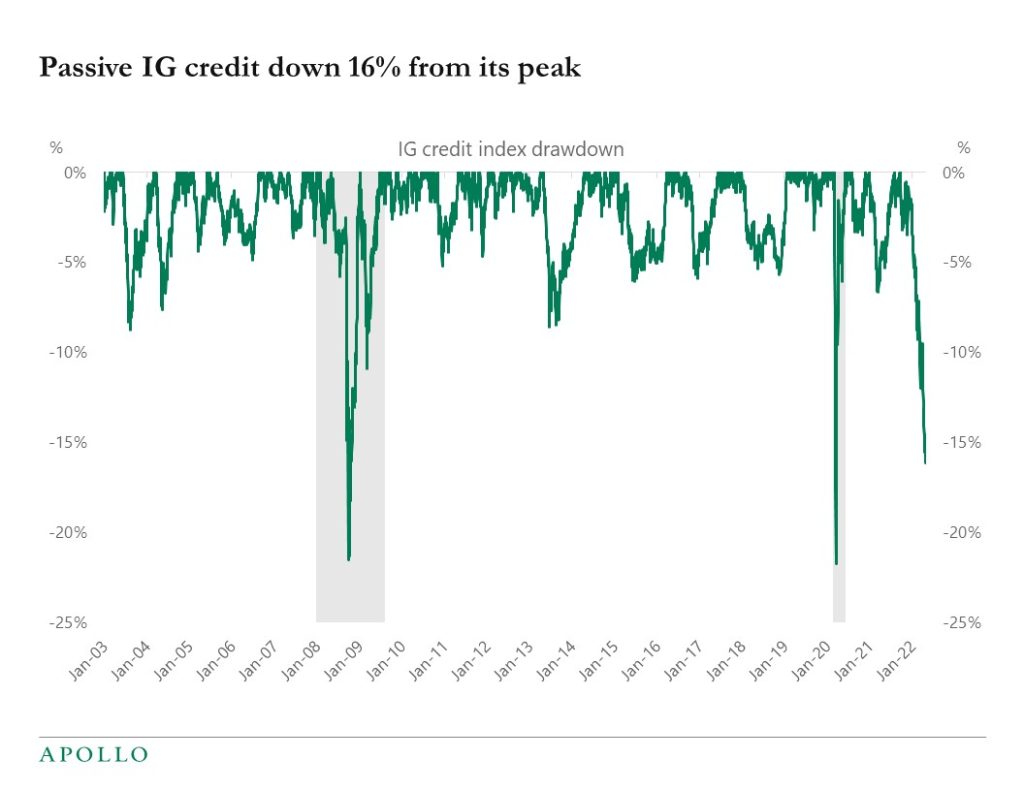
Source: Bloomberg, Apollo Chief Economist. Note: Bloomberg ticker used for the IG credit index LQD. See important disclaimers at the bottom of the page.
-
The average monthly payment on a new mortgage is now $1,361, driven by higher rates and higher home prices, see chart below.
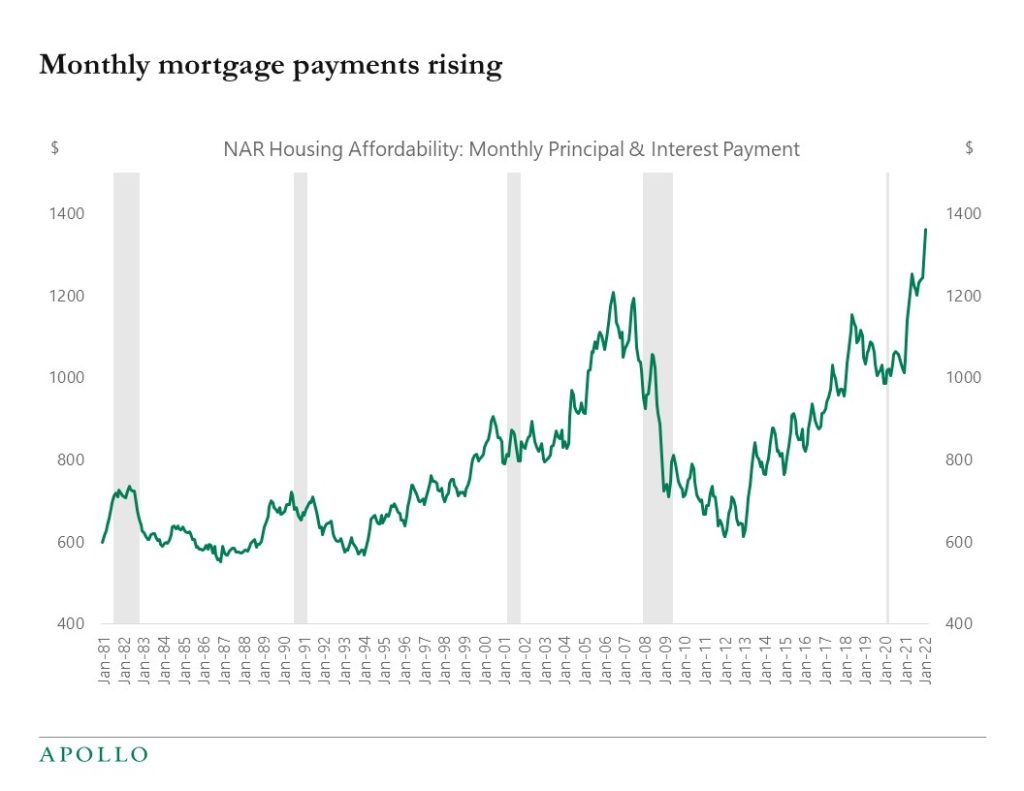
Source: NAR, Haver Analytics, Apollo Chief Economist. Note: NAR begins with the median price of existing single-family homes sold, and they assume an 80% mortgage loan-to-value ratio, that is, a 20% down-payment from the buyer. Using the average effective mortgage rate on loans closed, NAR calculates the median mortgage payment. See important disclaimers at the bottom of the page.

This presentation may not be distributed, transmitted or otherwise communicated to others in whole or in part without the express consent of Apollo Global Management, Inc. (together with its subsidiaries, “Apollo”).
Apollo makes no representation or warranty, expressed or implied, with respect to the accuracy, reasonableness, or completeness of any of the statements made during this presentation, including, but not limited to, statements obtained from third parties. Opinions, estimates and projections constitute the current judgment of the speaker as of the date indicated. They do not necessarily reflect the views and opinions of Apollo and are subject to change at any time without notice. Apollo does not have any responsibility to update this presentation to account for such changes. There can be no assurance that any trends discussed during this presentation will continue.
Statements made throughout this presentation are not intended to provide, and should not be relied upon for, accounting, legal or tax advice and do not constitute an investment recommendation or investment advice. Investors should make an independent investigation of the information discussed during this presentation, including consulting their tax, legal, accounting or other advisors about such information. Apollo does not act for you and is not responsible for providing you with the protections afforded to its clients. This presentation does not constitute an offer to sell, or the solicitation of an offer to buy, any security, product or service, including interest in any investment product or fund or account managed or advised by Apollo.
Certain statements made throughout this presentation may be “forward-looking” in nature. Due to various risks and uncertainties, actual events or results may differ materially from those reflected or contemplated in such forward-looking information. As such, undue reliance should not be placed on such statements. Forward-looking statements may be identified by the use of terminology including, but not limited to, “may”, “will”, “should”, “expect”, “anticipate”, “target”, “project”, “estimate”, “intend”, “continue” or “believe” or the negatives thereof or other variations thereon or comparable terminology.