


Want it delivered daily to your inbox?
-
There are some important differences in CRE, with some sectors such as office having negative performance and industrial and warehouses showing positive performance, see chart below.

Source: Bloomberg, Apollo Chief Economist See important disclaimers at the bottom of the page.
-
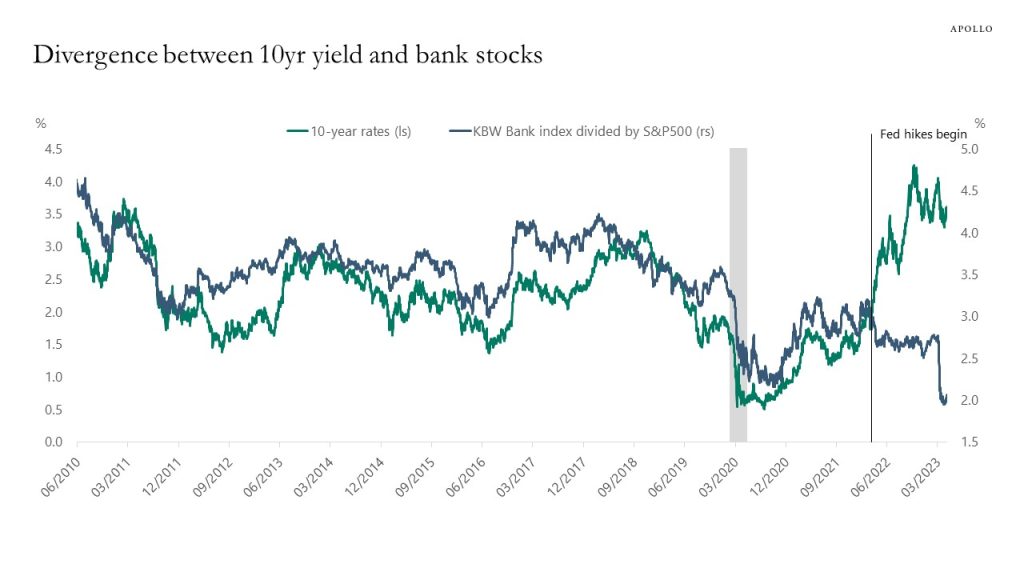
It used to be the case that higher long-term interest rates were positive for banks because higher long rates meant wider net interest margins.
But since the Fed started hiking rates last year, this correlation has broken down, see chart below.
Now higher rates are negative for banks because it has a negative impact on their assets, and higher rates and an inverted yield curve increase the risks of a recession and hence credit losses.
Source: Bloomberg, Apollo Chief Economist See important disclaimers at the bottom of the page.
-
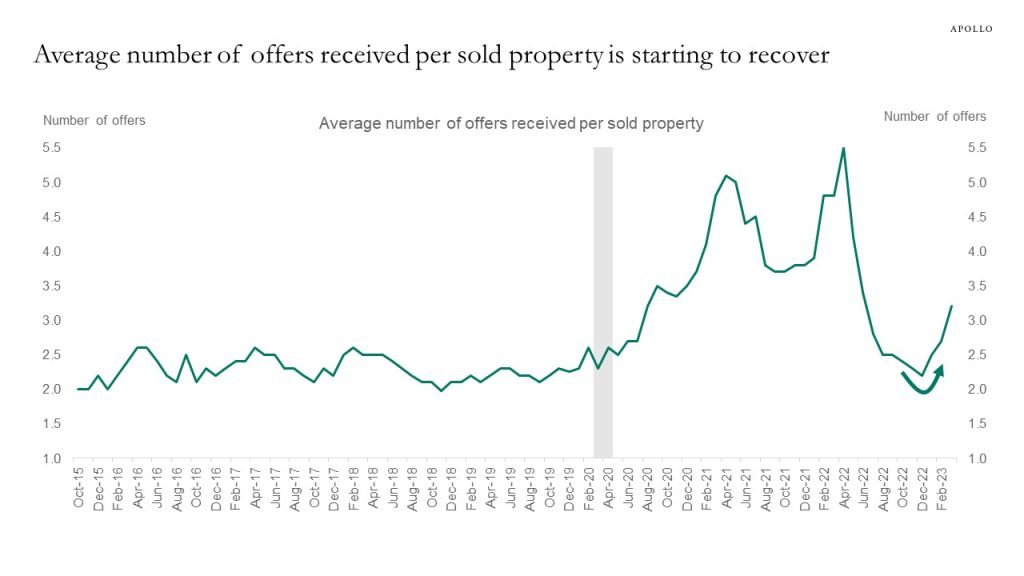
The housing market has started to recover, and this is a problem for the Fed because more demand for housing will boost home prices and rents, and with housing having a weight of 40% in the CPI, this will make it more difficult to get inflation down from currently 5% to the Fed’s 2% inflation target.
Source: NAR, Apollo Chief Economist See important disclaimers at the bottom of the page.
-
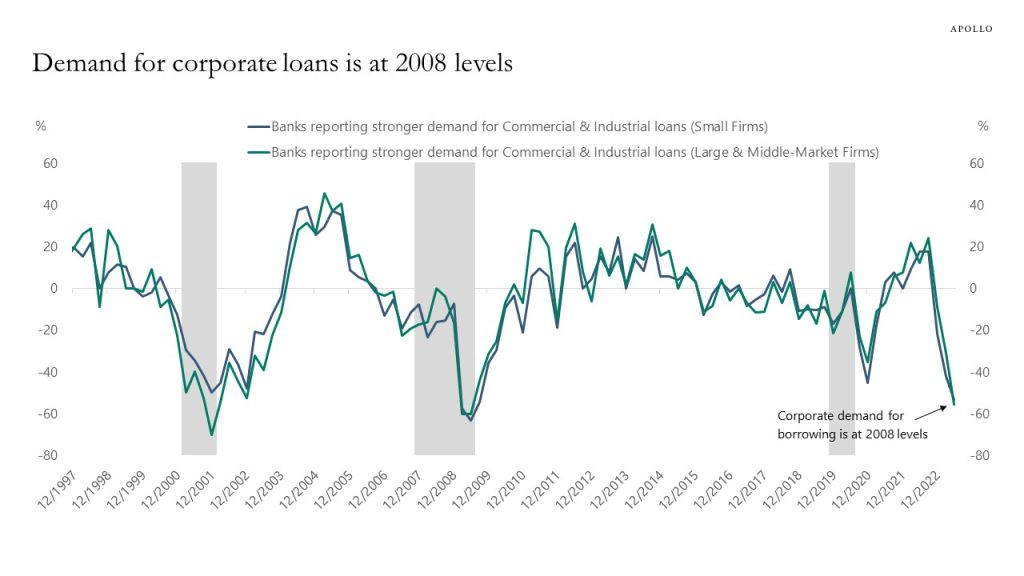
The Fed’s Senior Loan Officer Survey for Q2 was done in April after SVB but before First Republic Bank, and it shows an ongoing tightening in credit conditions across all types of lending.
Specifically, the survey asks banks if they have tightened lending standards for firms and households relative to last quarter, and across all indicators for demand for loans and supply of loans, we are now at or close to 2008 levels, see charts below.
In addition, the first sentence in the notes to the Fed’s Senior Loan Officer Survey shows that it only covers large banks out of the roughly 4,000 banks in the US, so credit conditions in small and medium-sized banks are likely tightening even more than seen in the charts below.
The bottom line for markets is that with inflation still at 5%, well above the FOMC’s 2% inflation target, and the Fed not cutting rates anytime soon, credit conditions will continue to tighten, and as a result, a recession is coming that could be deeper or longer than the consensus currently expects.
Source: FRB, Bloomberg, Apollo Chief Economist 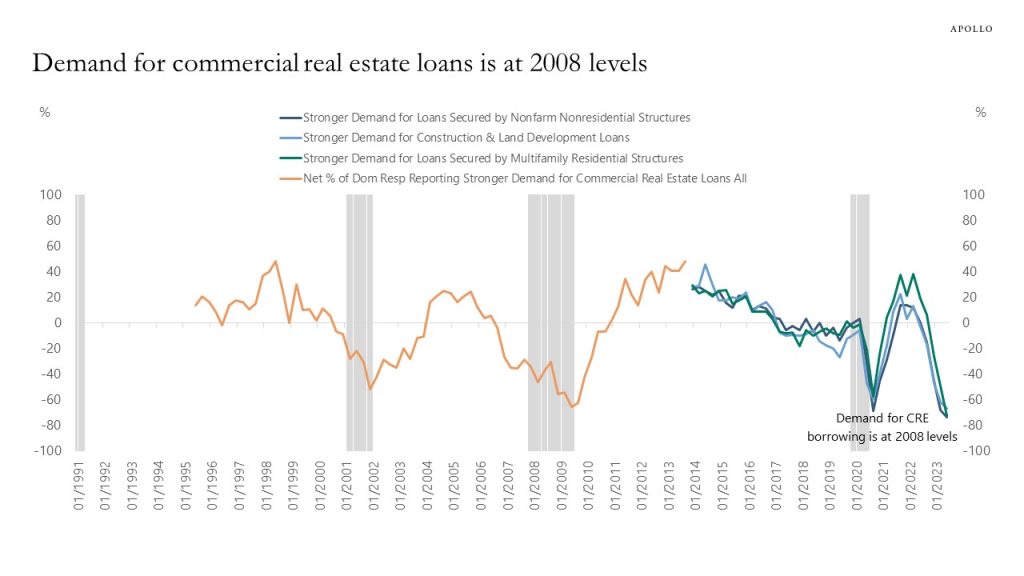
Source: FRB, Bloomberg, Apollo Chief Economist 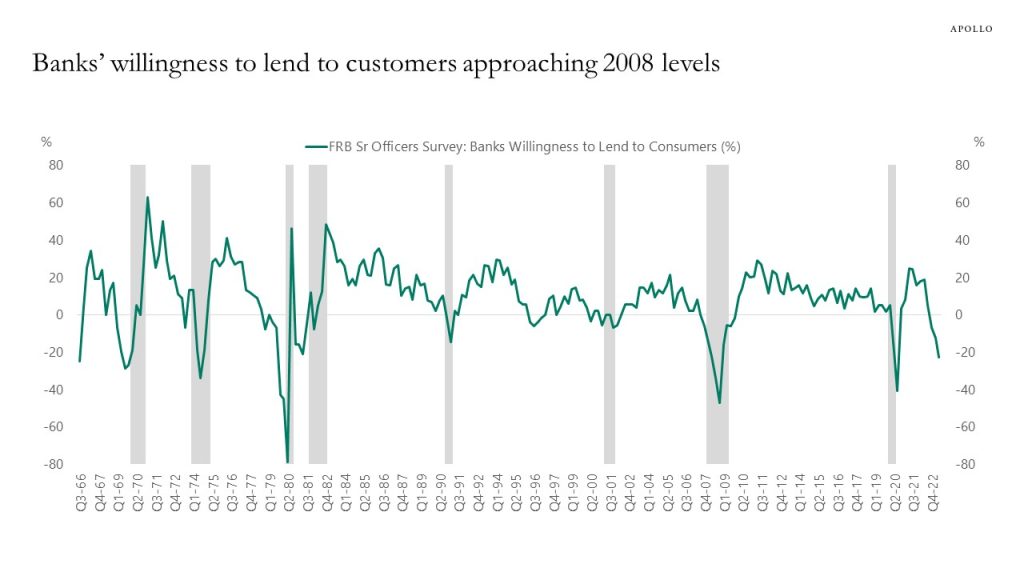
Source: FRB, Bloomberg, Apollo Chief Economist 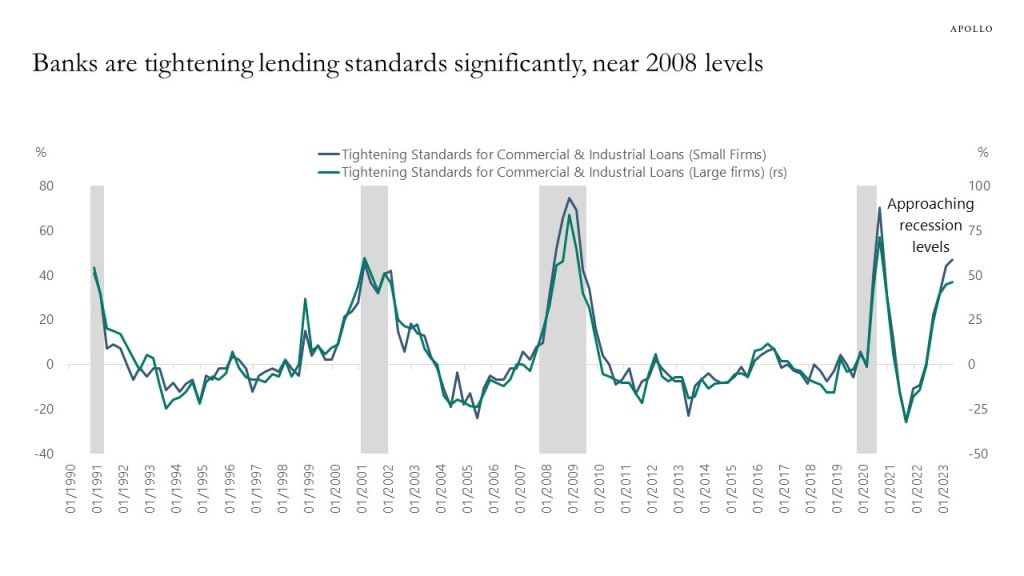
Source: FRB, Bloomberg, Apollo Chief Economist 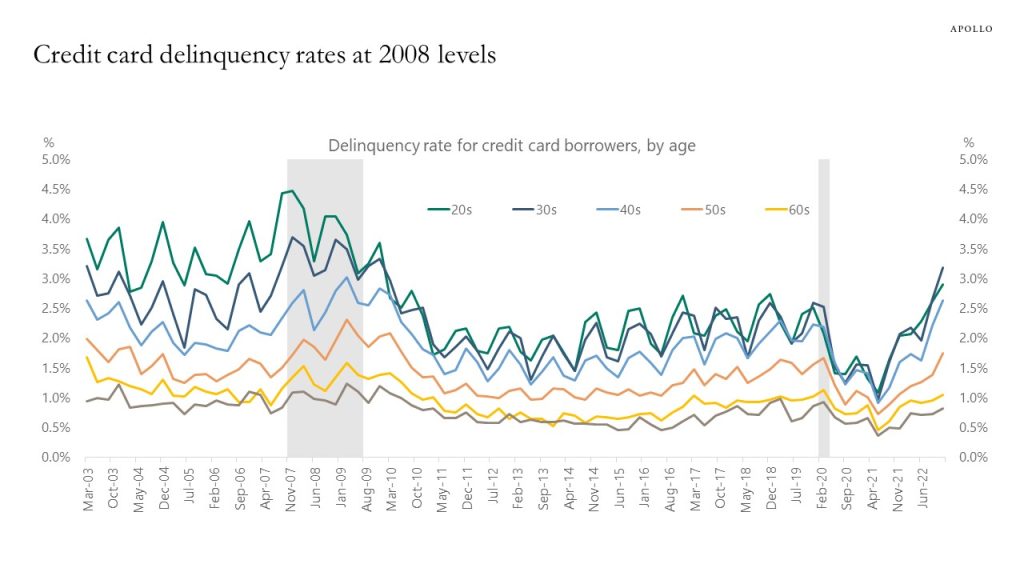
Source: New York Fed Consumer Credit Panel / Equifax, Apollo Chief Economist 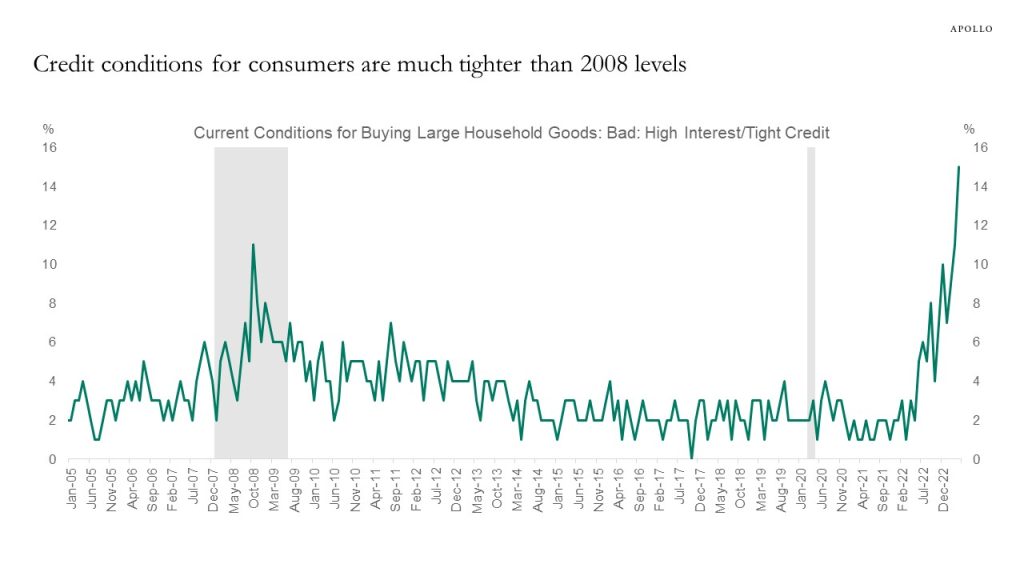
Source: University of Michigan, Haver Analytics, Apollo Chief Economist See important disclaimers at the bottom of the page.
-
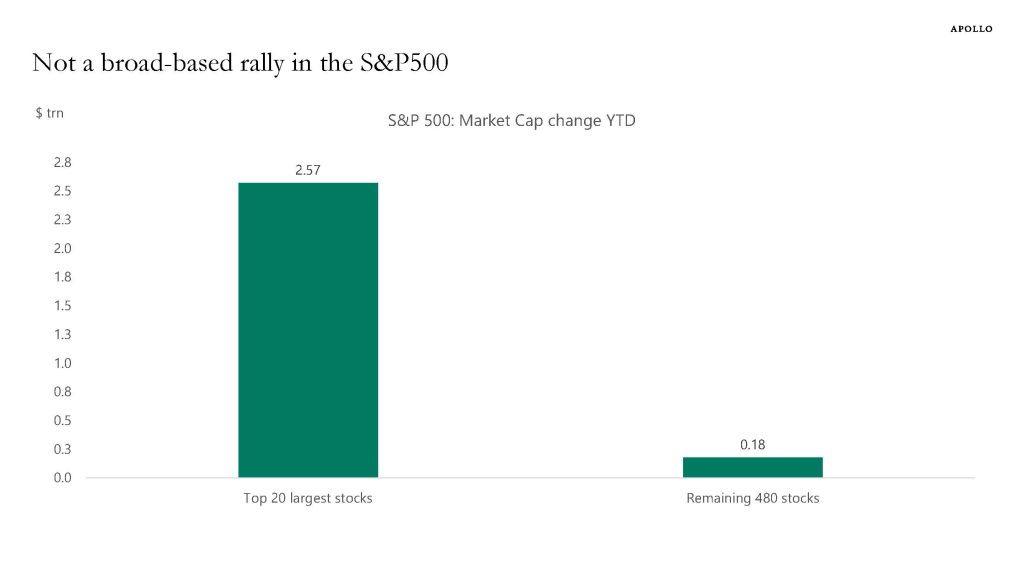
There is an ongoing banking crisis, the consensus expects a recession, and a default cycle has started. But markets are pricing that this will only have a mild negative impact on lower-rated credits and small and medium-sized companies. Our monthly credit market outlook is available here.
Source: Bloomberg, Apollo Chief Economist 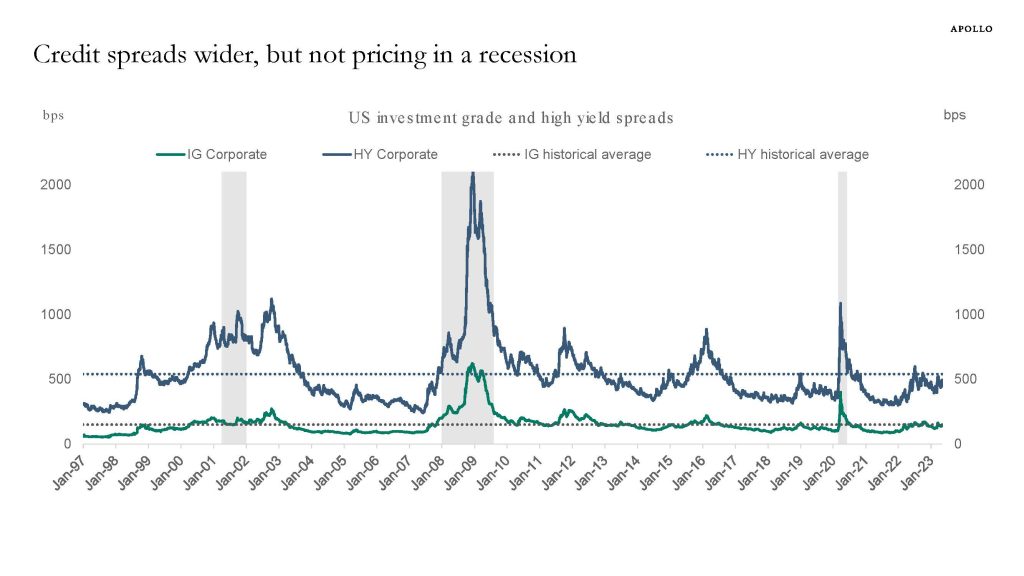
Source: ICE BofA, Bloomberg, Apollo Chief Economist 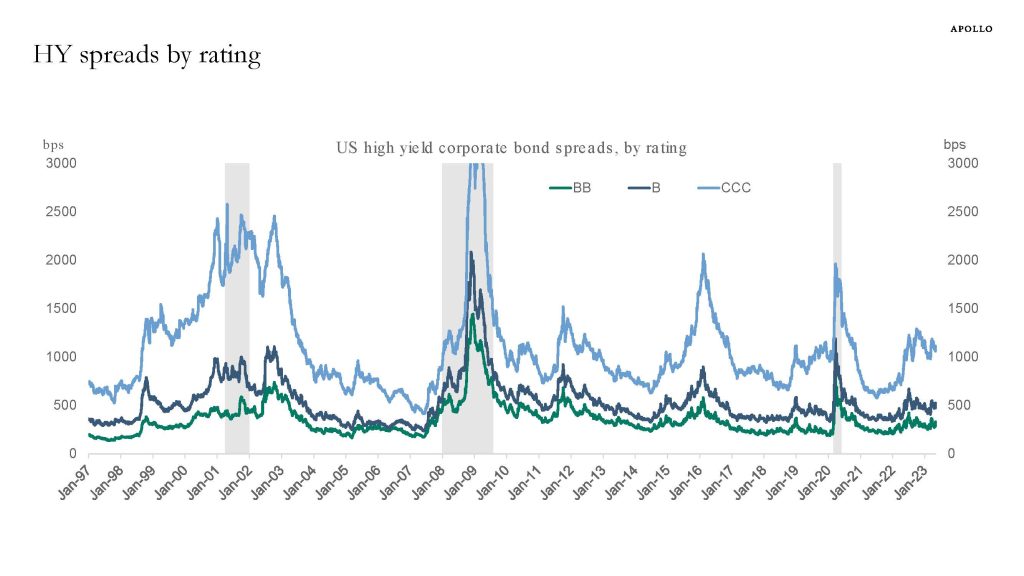
Source: ICE BofA, Bloomberg, Apollo Chief Economist 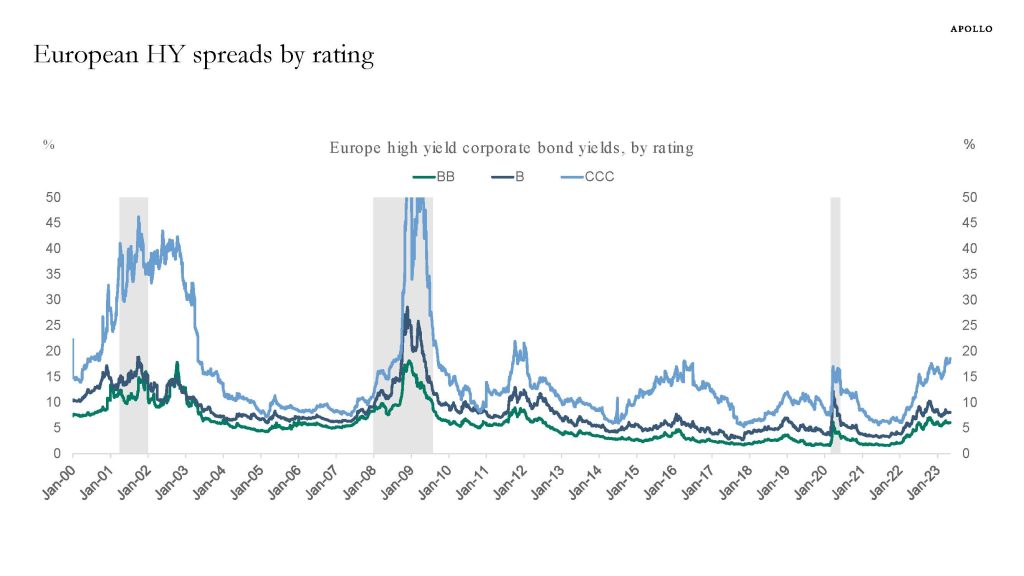
Source: ICE BofA, Bloomberg, Apollo Chief Economist 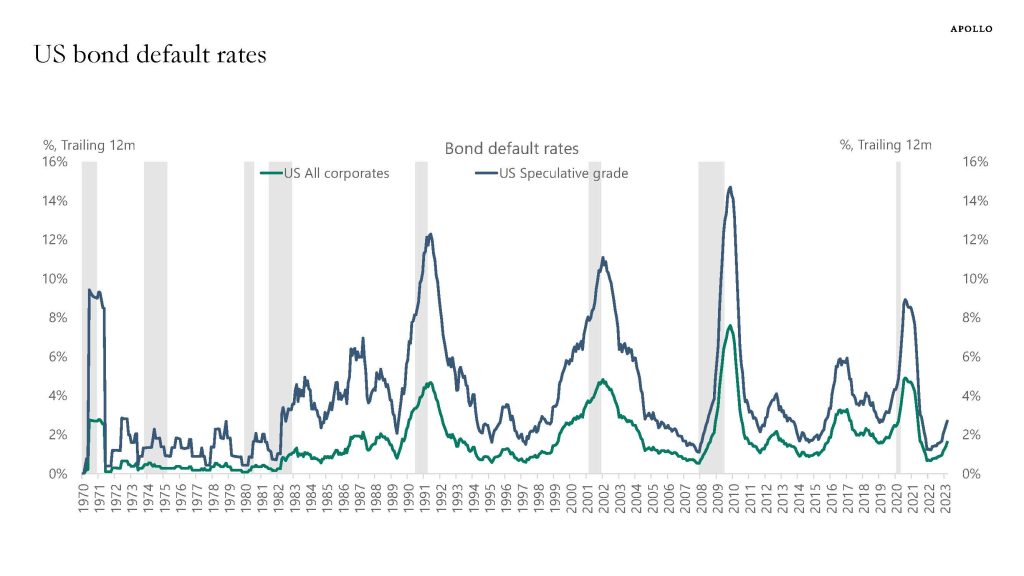
Source: Moody’s Analytics, Apollo Chief Economist 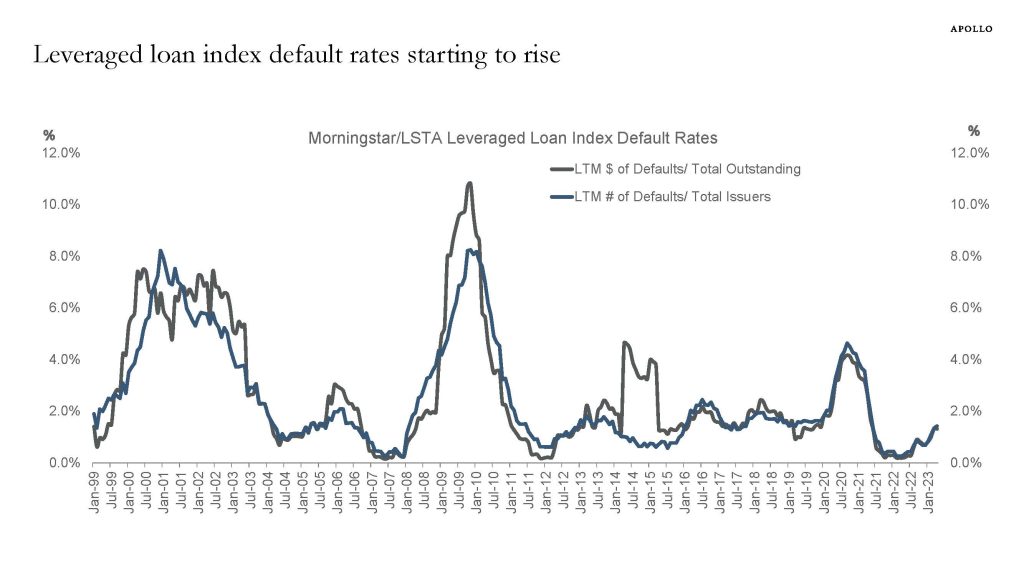
Source: Pitchbook LCD, Apollo Chief Economist 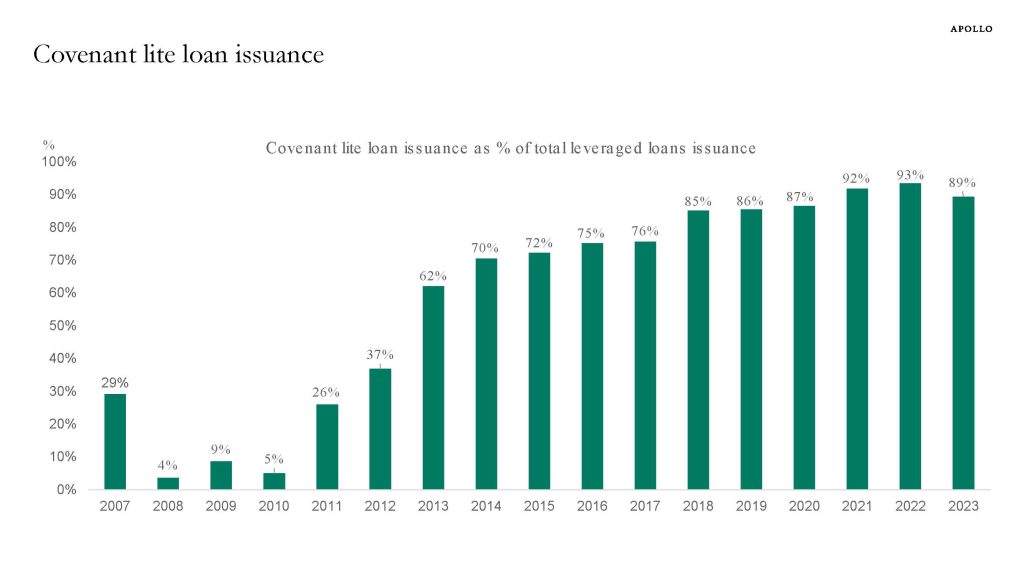
Source: Pitchbook LCD, Apollo Chief Economist. Note: A covenant-lite loan is a type of financing with fewer restrictions on the borrower and fewer protections for the lender, often used in leveraged buyouts. Data as of 31st March 2023. 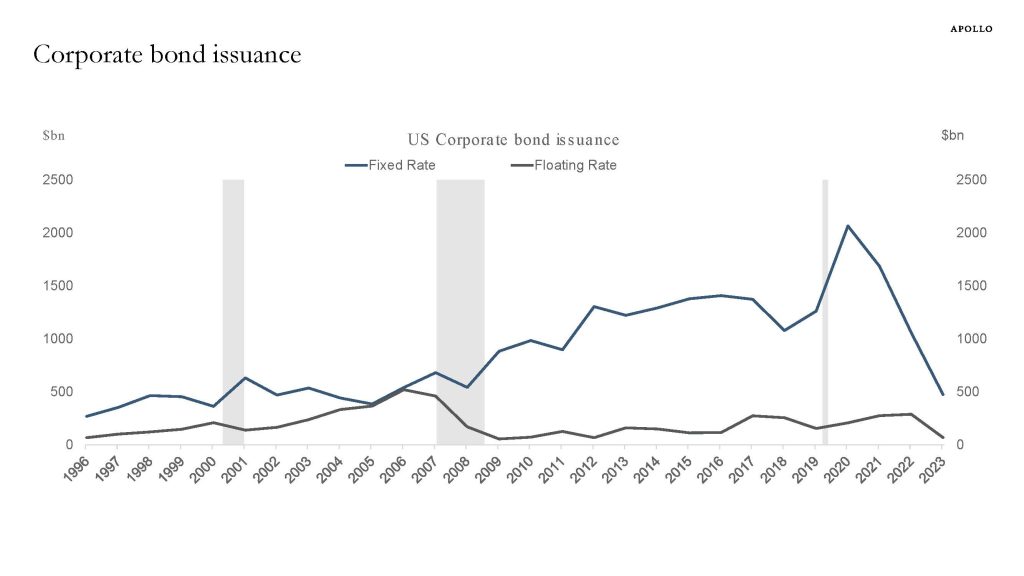
Source: SIFMA, Apollo Chief Economist 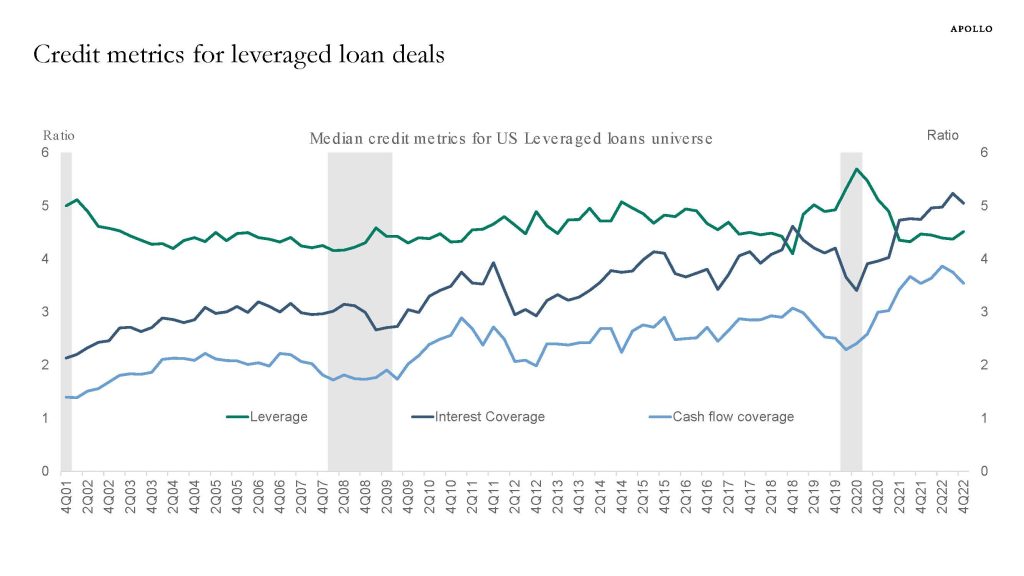
Source: Pitchbook LCD, Apollo Chief Economist 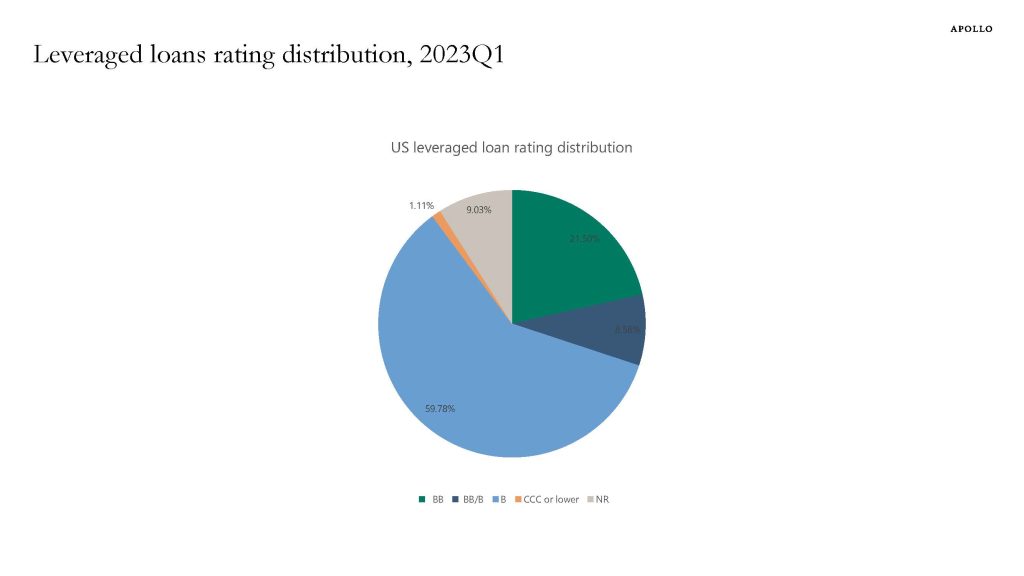
Source: Pitchbook LCD, Apollo Chief Economist 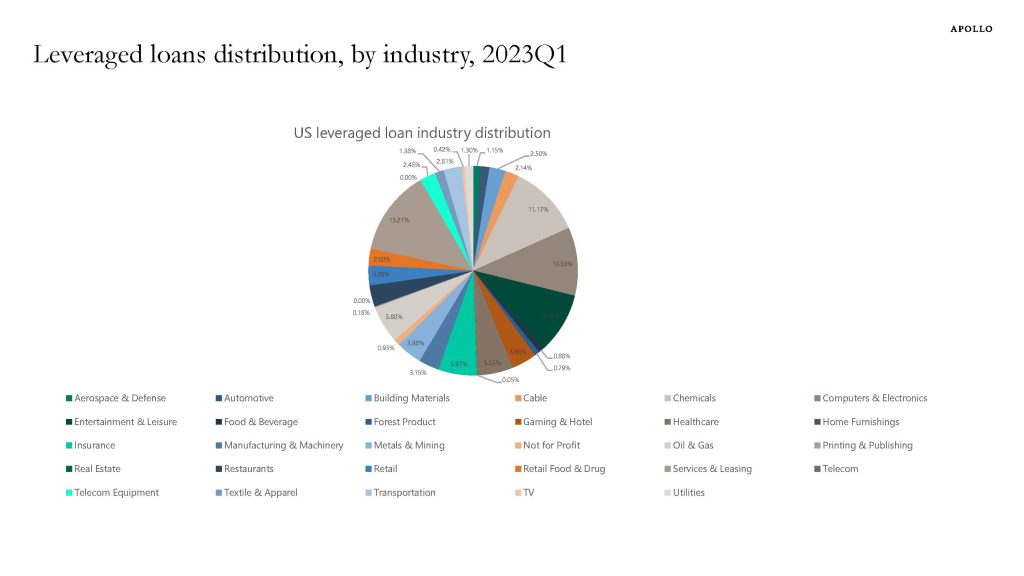
Source: Pitchbook LCD, Apollo Chief Economist See important disclaimers at the bottom of the page.
-
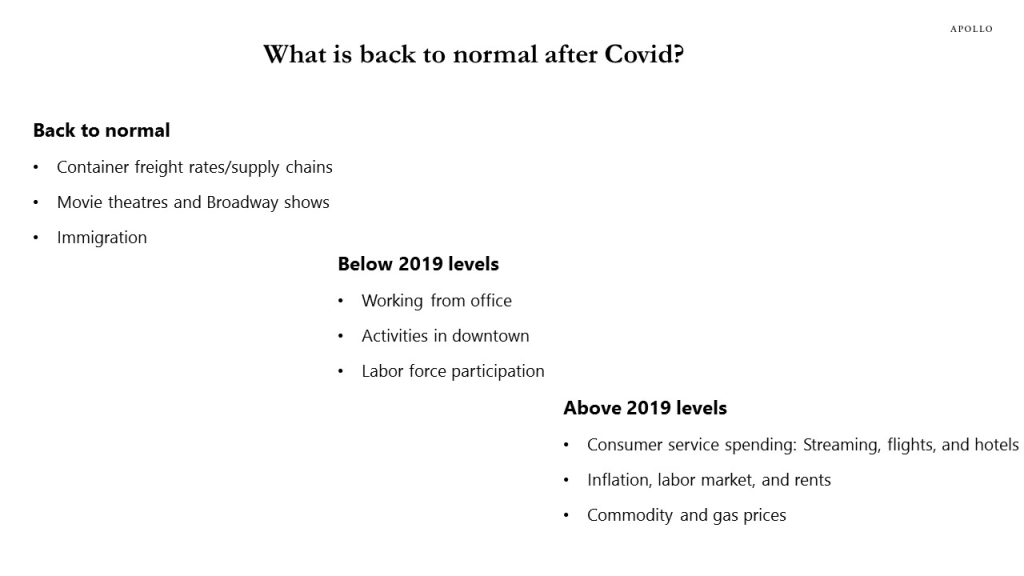
The labor market continues to soften, but the speed of the cooling is slower than expected, driven by increased labor force participation and higher immigration, see chart below and our chart book available here.
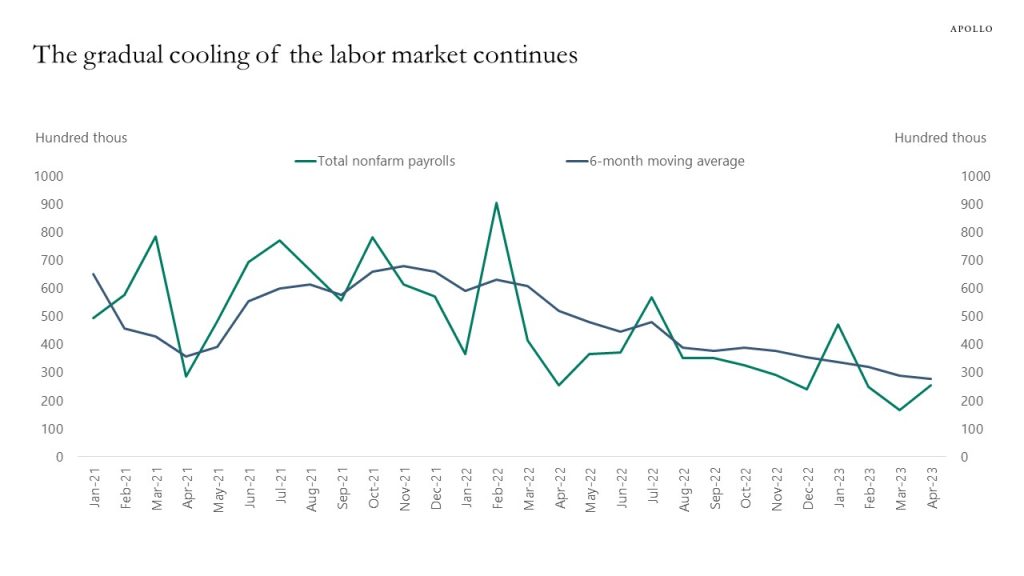
Source: BLS, Haver Analytics, Apollo Chief Economist See important disclaimers at the bottom of the page.
-
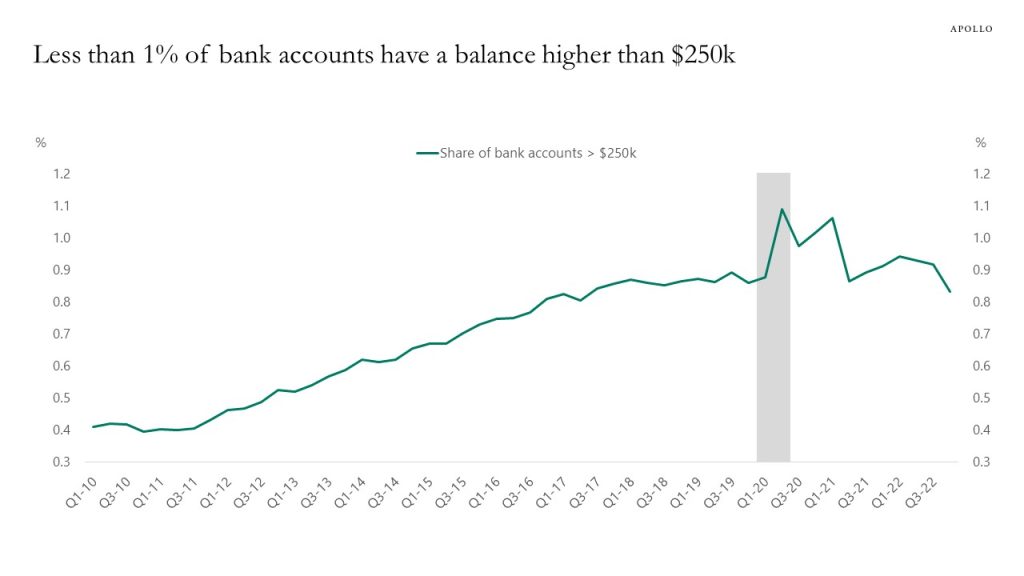
Bank credit conditions are tightening, and the negative impact on the economy from the ongoing banking crisis is going to be significant because small banks account for 30% of assets in the banking sector and 40% of lending, and small banks are facing three headwinds from 1) higher funding costs, 2) lower asset prices because of higher interest rates, and 3) more regulatory scrutiny. Our banking sector outlook is available here, key charts inserted below.
Source: FDIC, Haver Analytics, Apollo Chief Economist 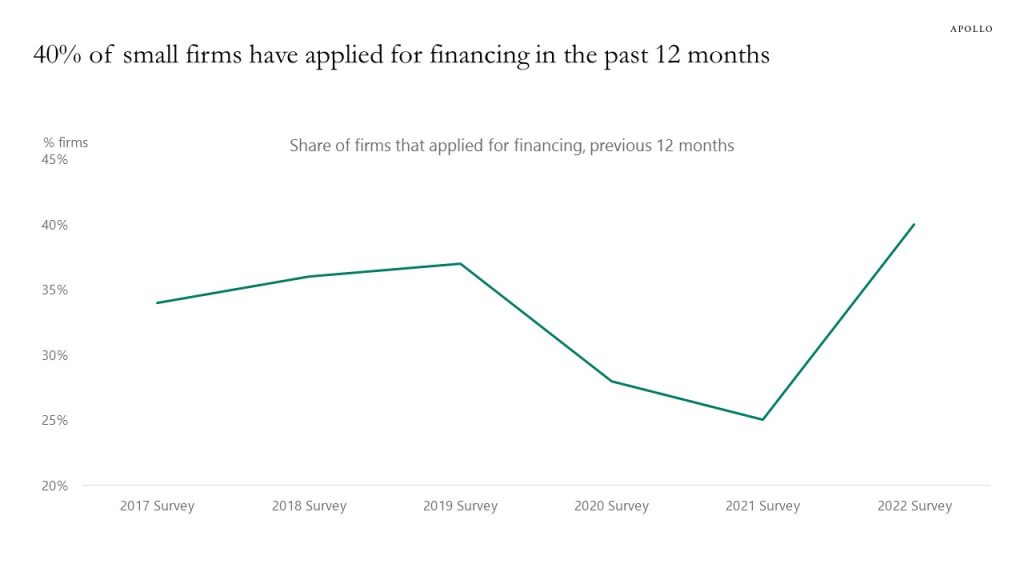
Source: Small Business Credit Survey, Federal Reserve, Apollo Chief Economist. Note: 2022 survey, prior to 12 months of survey year 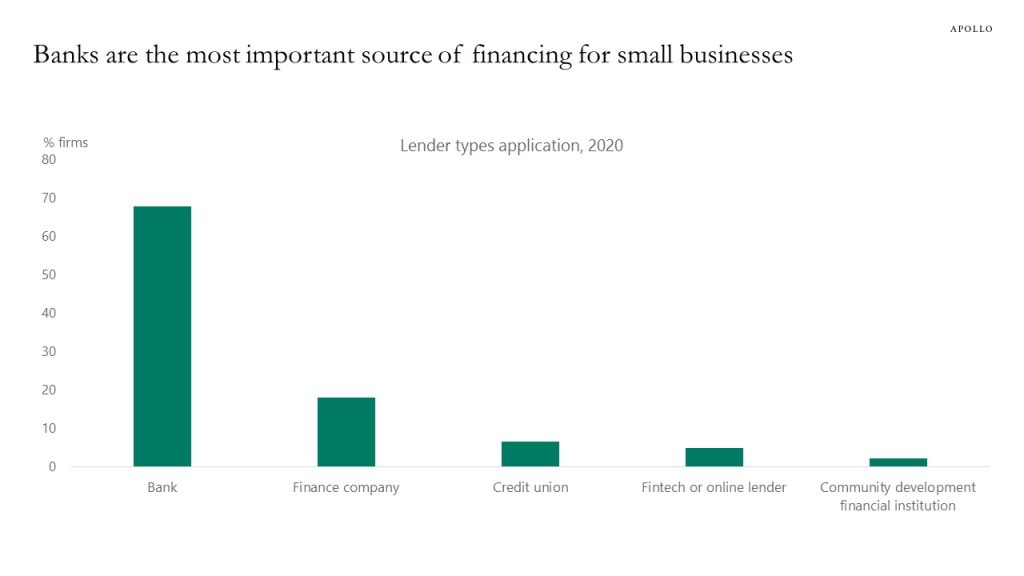
Source: 2021 Annual Business Survey, U.S. Census Bureau, Apollo Chief Economist 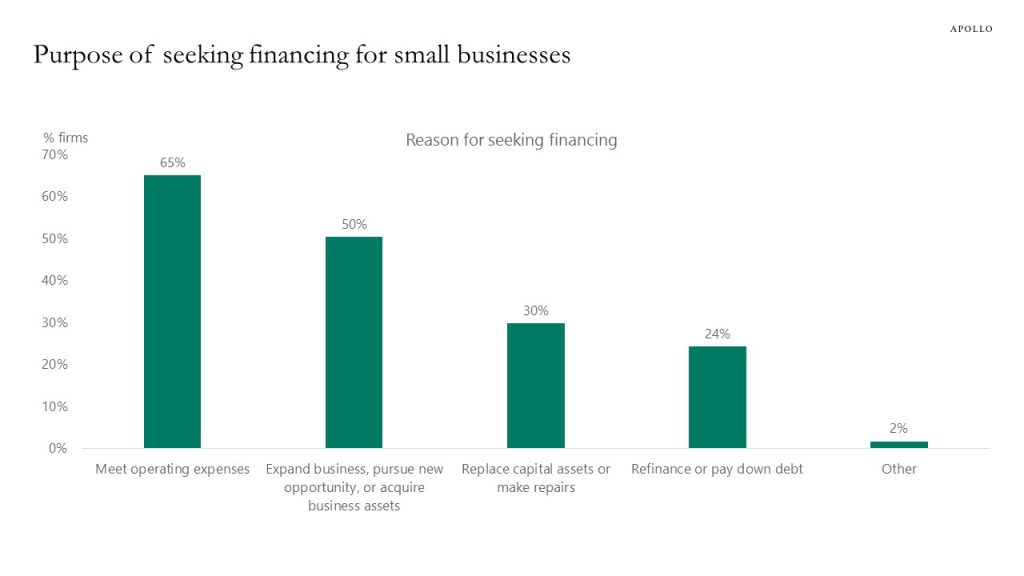
Source: Small Business Credit Survey, Federal Reserve, Apollo Chief Economist. Note: 2022 survey, prior to 12 months of survey year 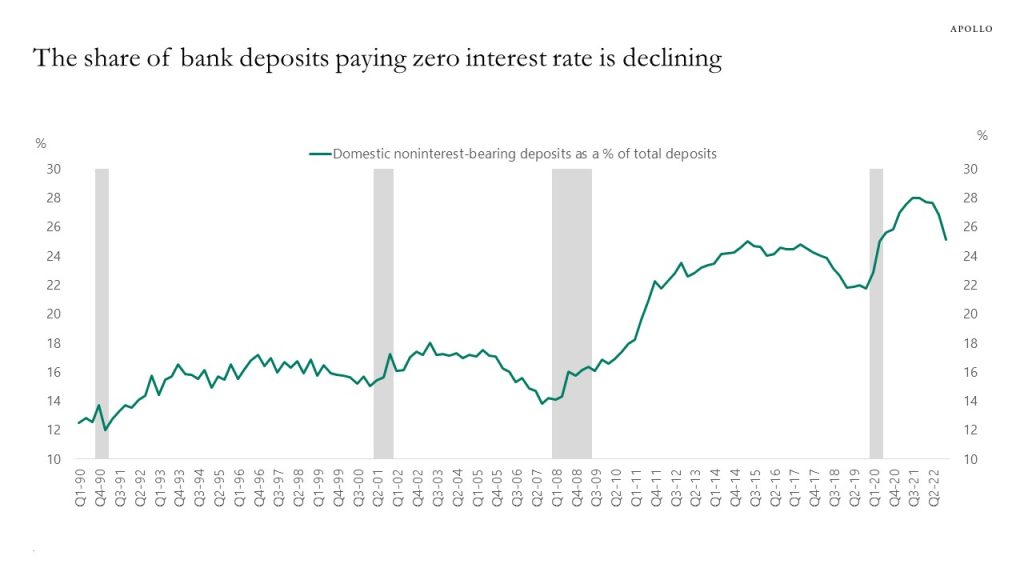
Source: FDIC, Apollo Chief Economist 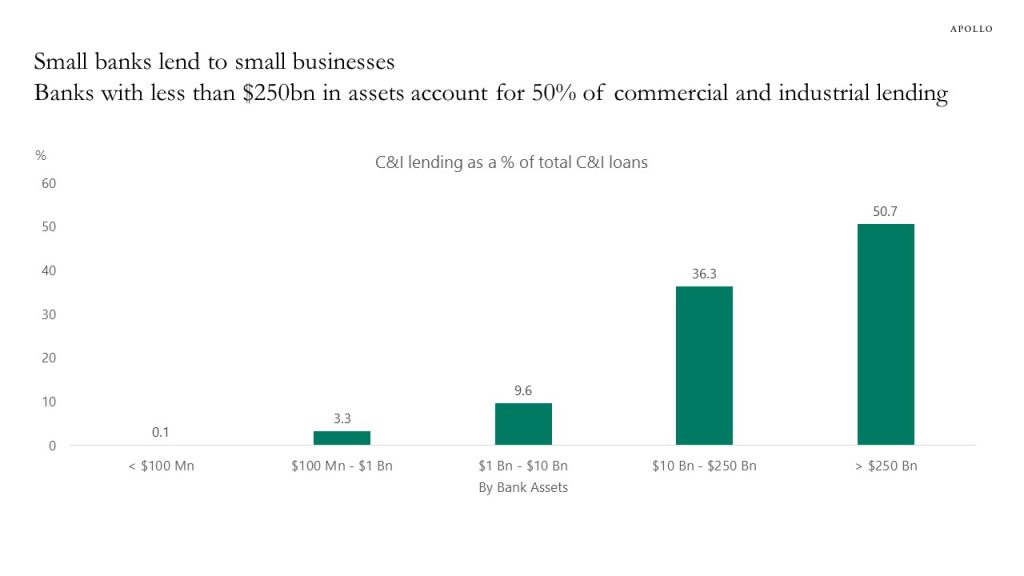
Source: FDIC, Apollo Chief Economist. Data as of Q3 2022 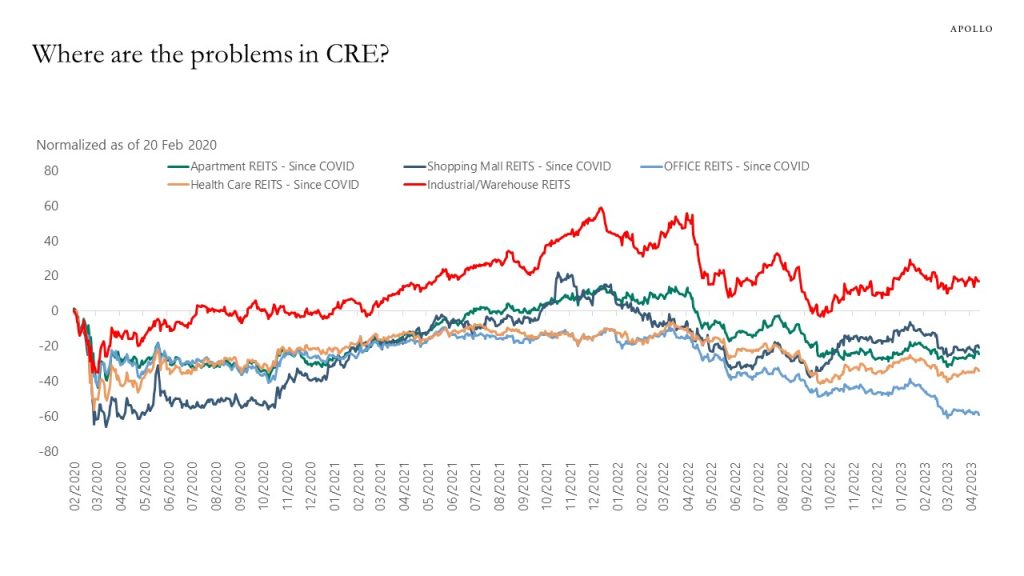
Source: Bloomberg, Apollo Chief Economist 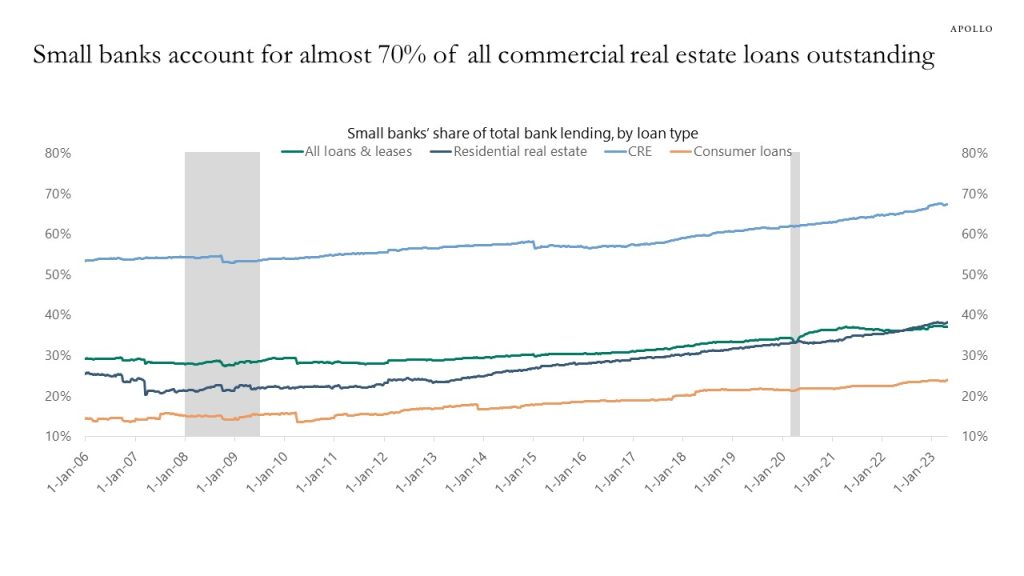
Source: Federal Reserve Board, Haver Analytics, Apollo Chief Economist 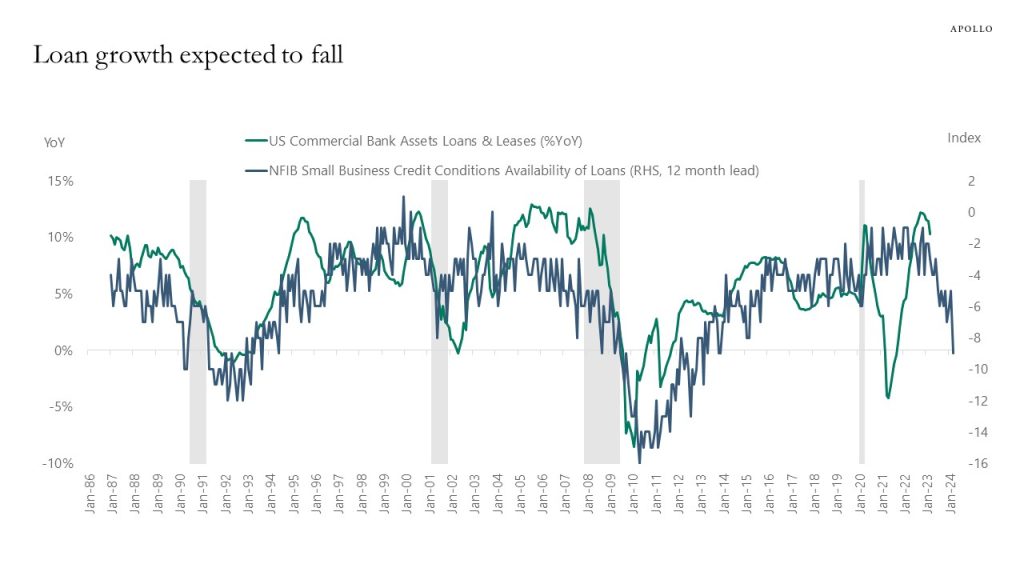
Source: NFIB, FRB, Bloomberg, Apollo Chief Economist See important disclaimers at the bottom of the page.
-
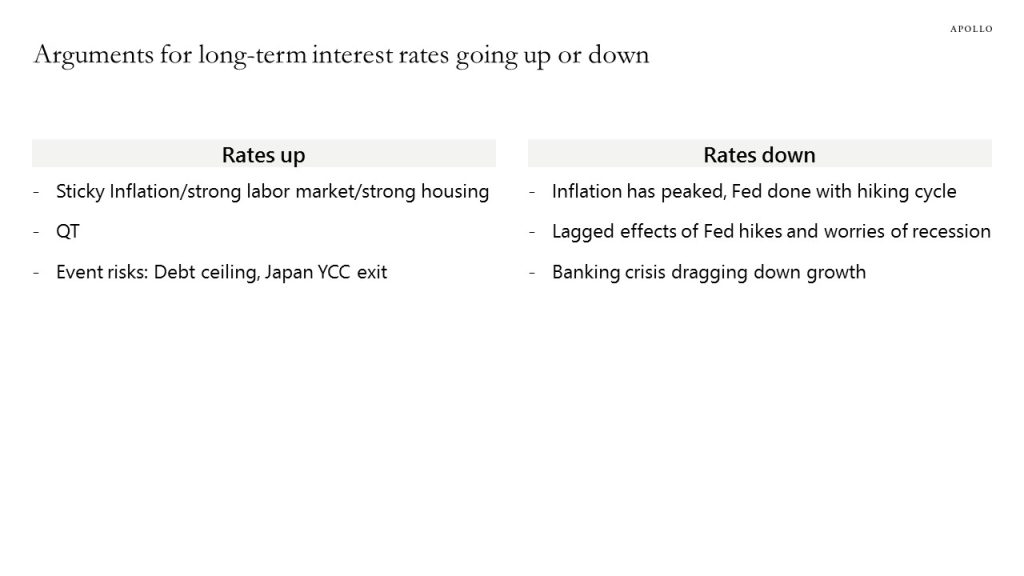
The arguments for long rates moving higher are sticky inflation, QT, debt ceiling, and Japan exiting yield curve control.
The arguments for long rates moving lower are lagged effects of Fed hikes, the ongoing banking crisis dragging down growth, and that the Fed is done raising rates.
Incoming information on any of these fronts will continue to keep fixed income volatility elevated.
Source: Apollo Chief Economist See important disclaimers at the bottom of the page.
-
See important disclaimers at the bottom of the page.
-
Small and medium-sized businesses have been underperforming in the stock market since the SVB collapse, suggesting investors are worried about the negative impact of the ongoing credit crunch on middle market companies, see chart below.
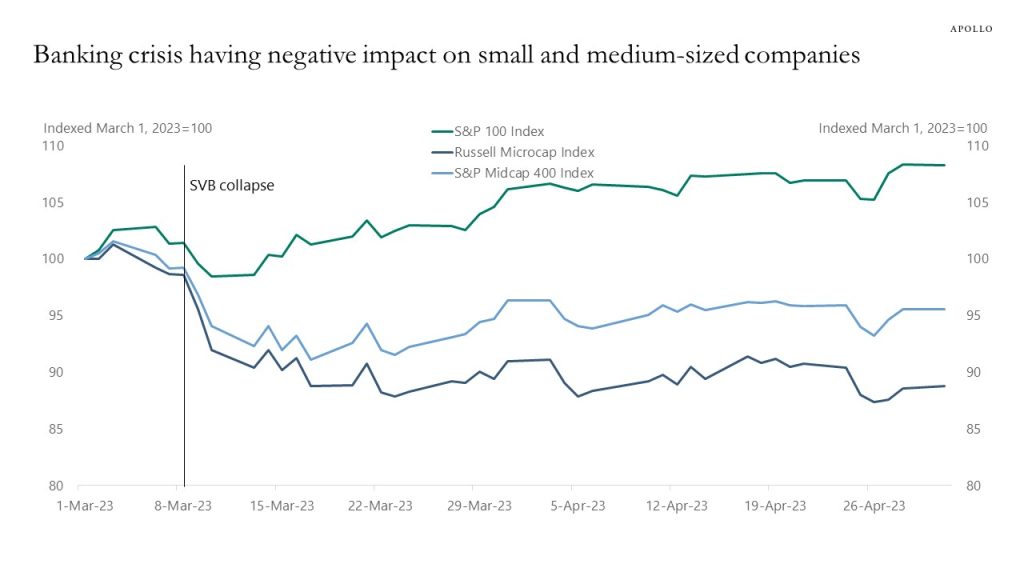
Source: Bloomberg, Apollo Chief Economist See important disclaimers at the bottom of the page.

This presentation may not be distributed, transmitted or otherwise communicated to others in whole or in part without the express consent of Apollo Global Management, Inc. (together with its subsidiaries, “Apollo”).
Apollo makes no representation or warranty, expressed or implied, with respect to the accuracy, reasonableness, or completeness of any of the statements made during this presentation, including, but not limited to, statements obtained from third parties. Opinions, estimates and projections constitute the current judgment of the speaker as of the date indicated. They do not necessarily reflect the views and opinions of Apollo and are subject to change at any time without notice. Apollo does not have any responsibility to update this presentation to account for such changes. There can be no assurance that any trends discussed during this presentation will continue.
Statements made throughout this presentation are not intended to provide, and should not be relied upon for, accounting, legal or tax advice and do not constitute an investment recommendation or investment advice. Investors should make an independent investigation of the information discussed during this presentation, including consulting their tax, legal, accounting or other advisors about such information. Apollo does not act for you and is not responsible for providing you with the protections afforded to its clients. This presentation does not constitute an offer to sell, or the solicitation of an offer to buy, any security, product or service, including interest in any investment product or fund or account managed or advised by Apollo.
Certain statements made throughout this presentation may be “forward-looking” in nature. Due to various risks and uncertainties, actual events or results may differ materially from those reflected or contemplated in such forward-looking information. As such, undue reliance should not be placed on such statements. Forward-looking statements may be identified by the use of terminology including, but not limited to, “may”, “will”, “should”, “expect”, “anticipate”, “target”, “project”, “estimate”, “intend”, “continue” or “believe” or the negatives thereof or other variations thereon or comparable terminology.