


Want it delivered daily to your inbox?
-
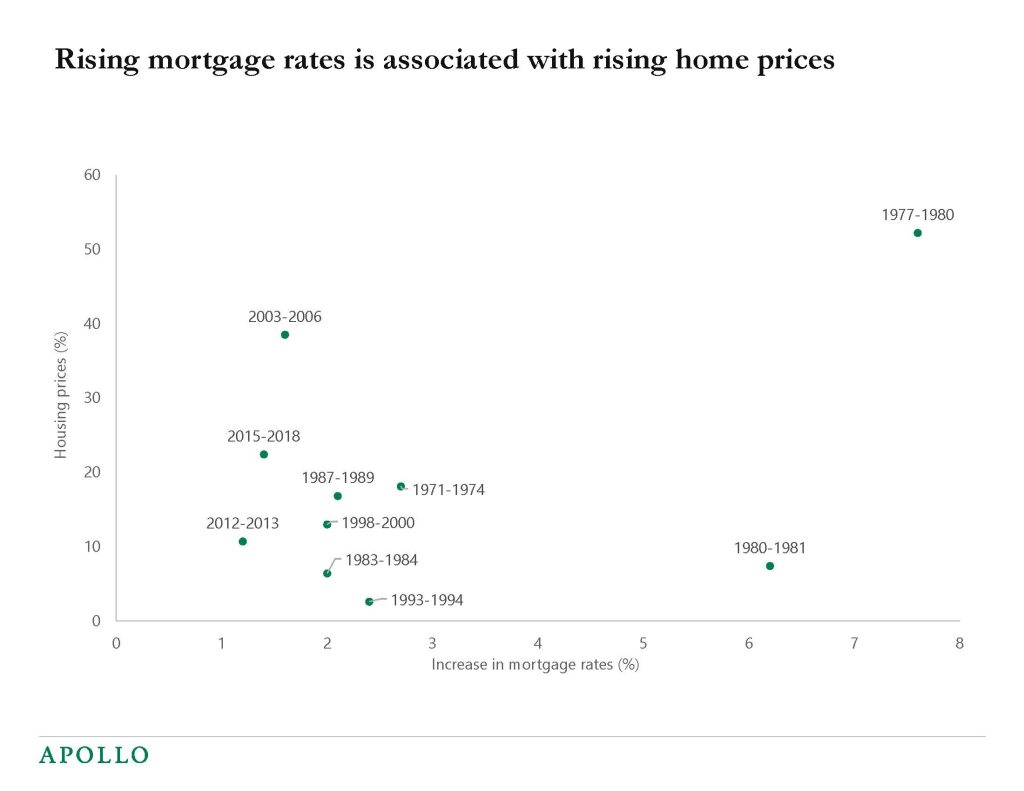
When mortgage rates go up, home prices rise. This may sound counter-intuitive, but the logic is simply that when growth is strong and incomes go up, the housing market also tends to be strong, leading to a more hawkish Fed and higher rates.
The chart below shows that episodes with a positive correlation between rising rates and rising home prices typically last several years. For more see also our US housing outlook.
Source: FRED, Apollo Chief Economist See important disclaimers at the bottom of the page.
-
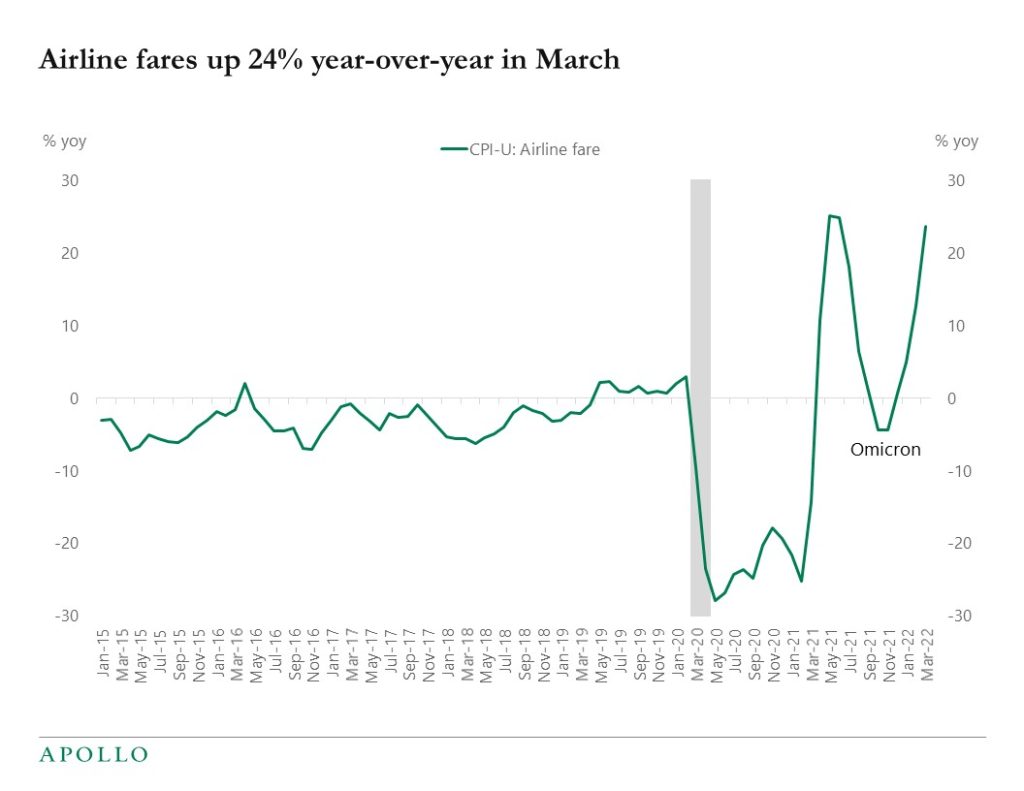
Airfares increased 10% month over month in March bringing the annual increase in ticket prices to 24%, see chart below.
Source: BLS, Apollo Chief Economist See important disclaimers at the bottom of the page.
-
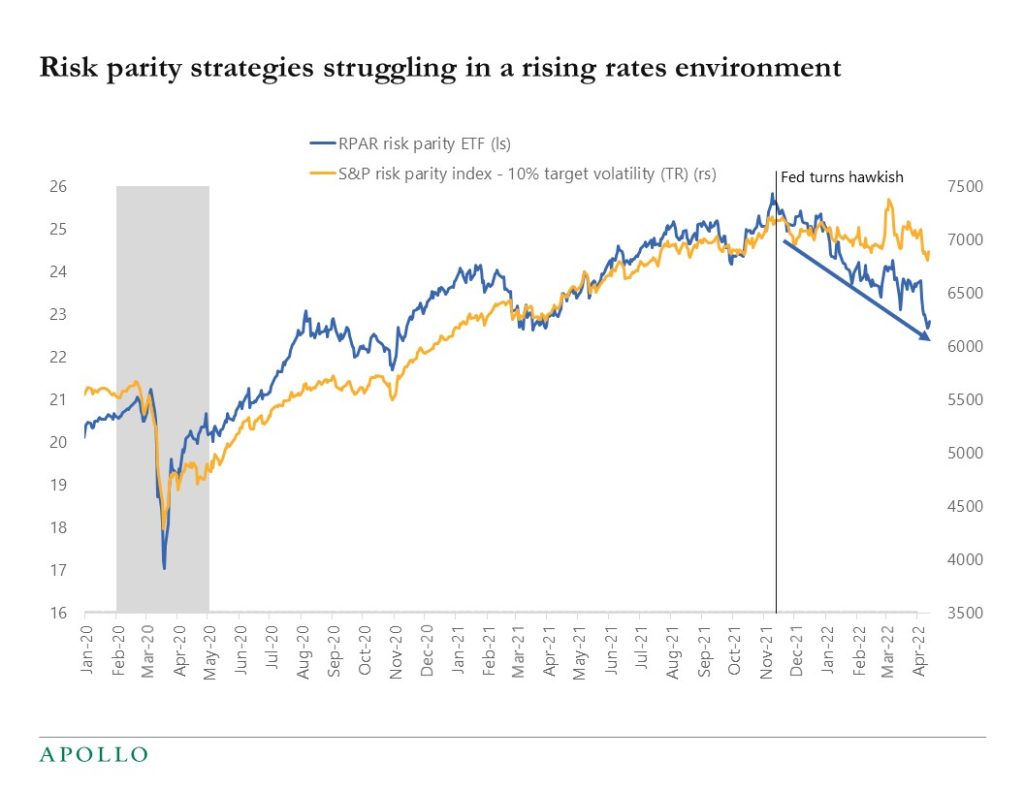
Risk parity has not worked well since the Fed turned hawkish in November, see chart below. Also, quant strategies assuming stable historical relationships are not working very well at the moment simply because they have not seen these levels of inflation before.
Source: Bloomberg, Apollo Chief Economist (BBG ticker: RPAR US Equity, SPRP10T Index ) See important disclaimers at the bottom of the page.
-
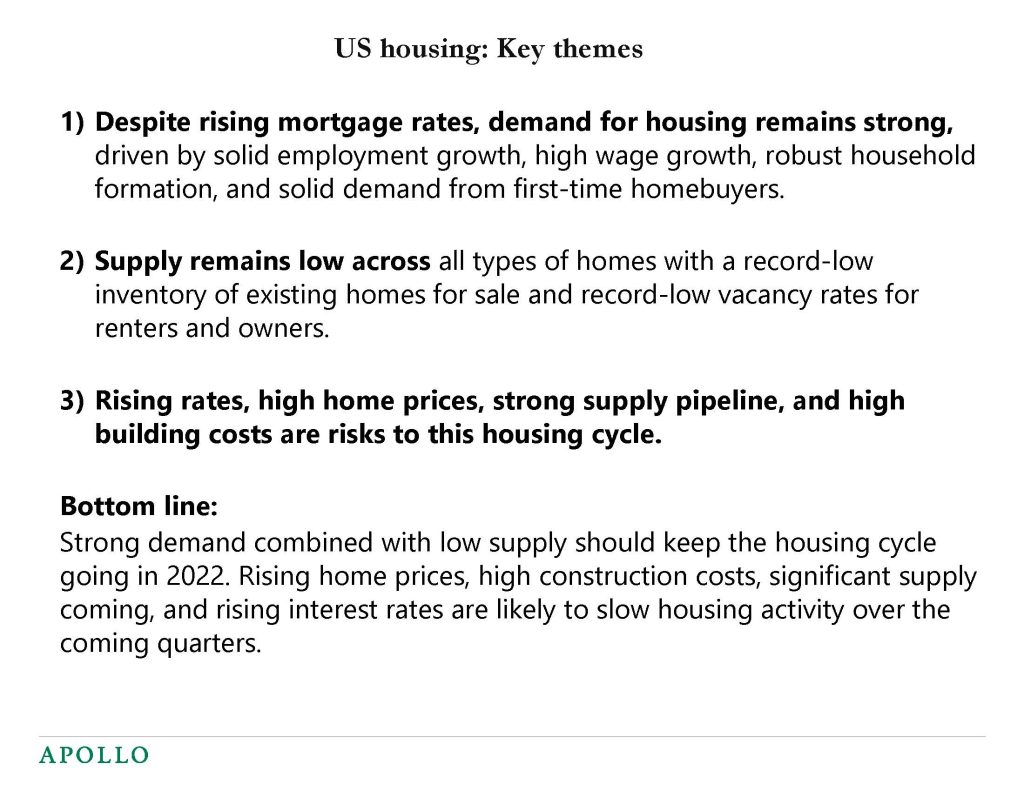
Our latest US housing outlook is available here, and the bottom line is that despite rising mortgage rates, demand for housing remains strong. Combined with record-low supply the housing market is expected to continue to do well over the coming quarters. A soft landing remains the most likely scenario.
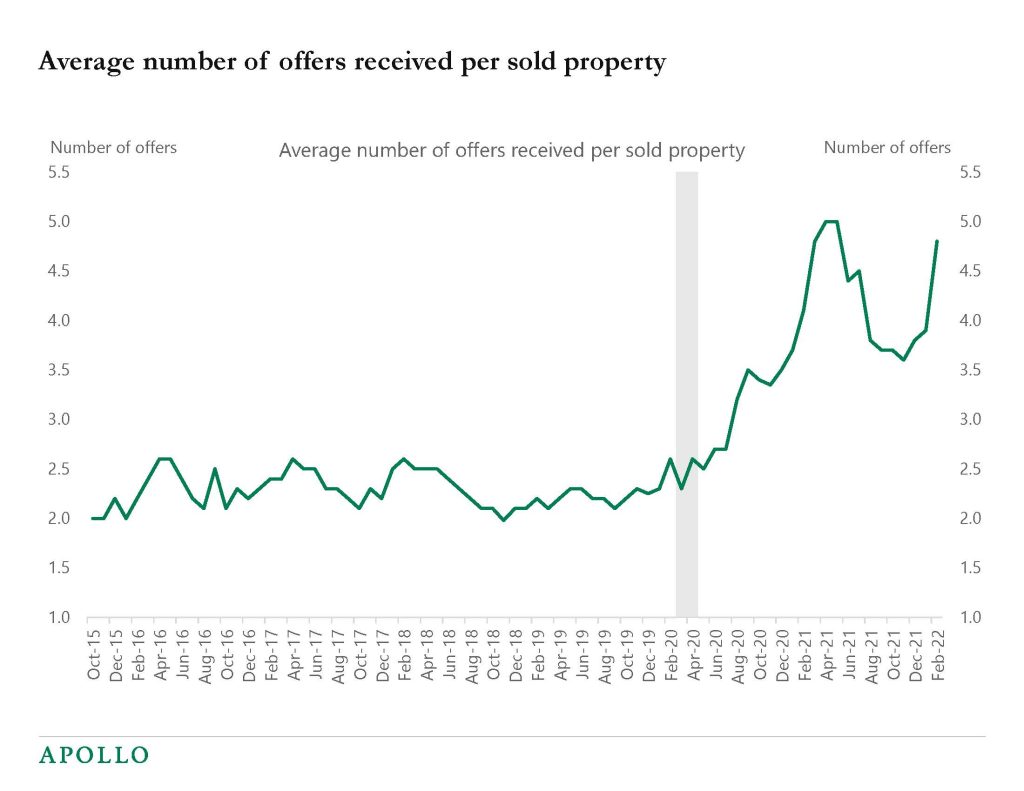
Source: NAR, Apollo Chief Economist 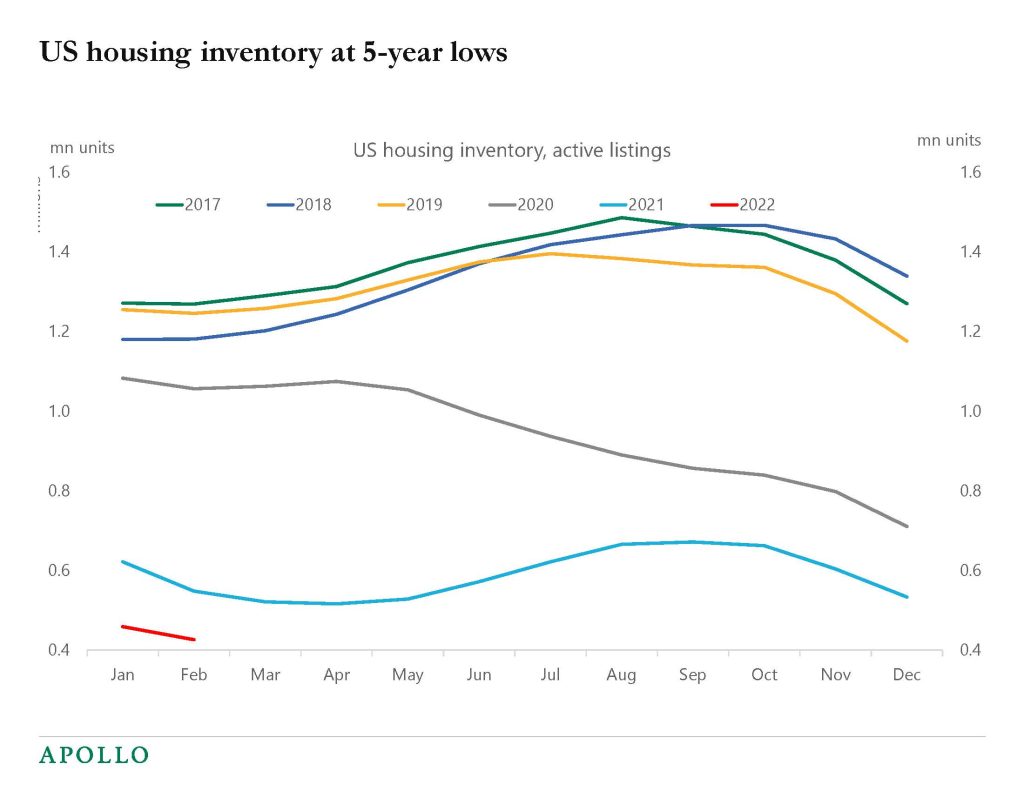
Source: Realtor.com, Apollo Chief Economist 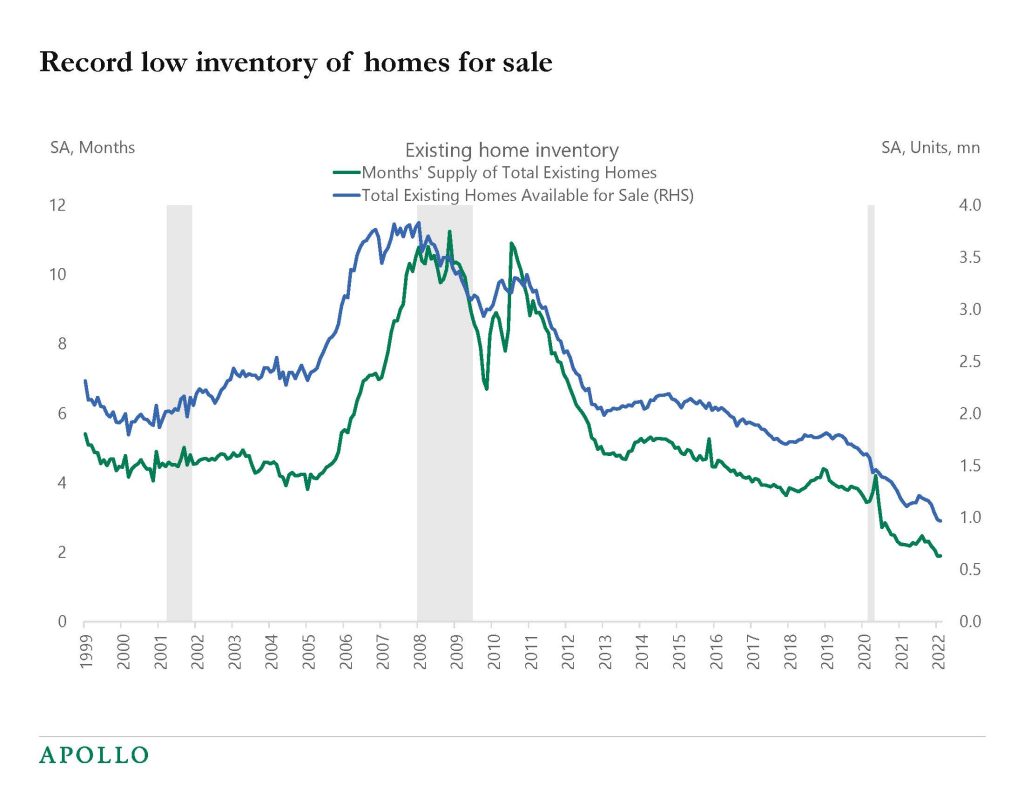
Source: NAR, Apollo Chief Economist 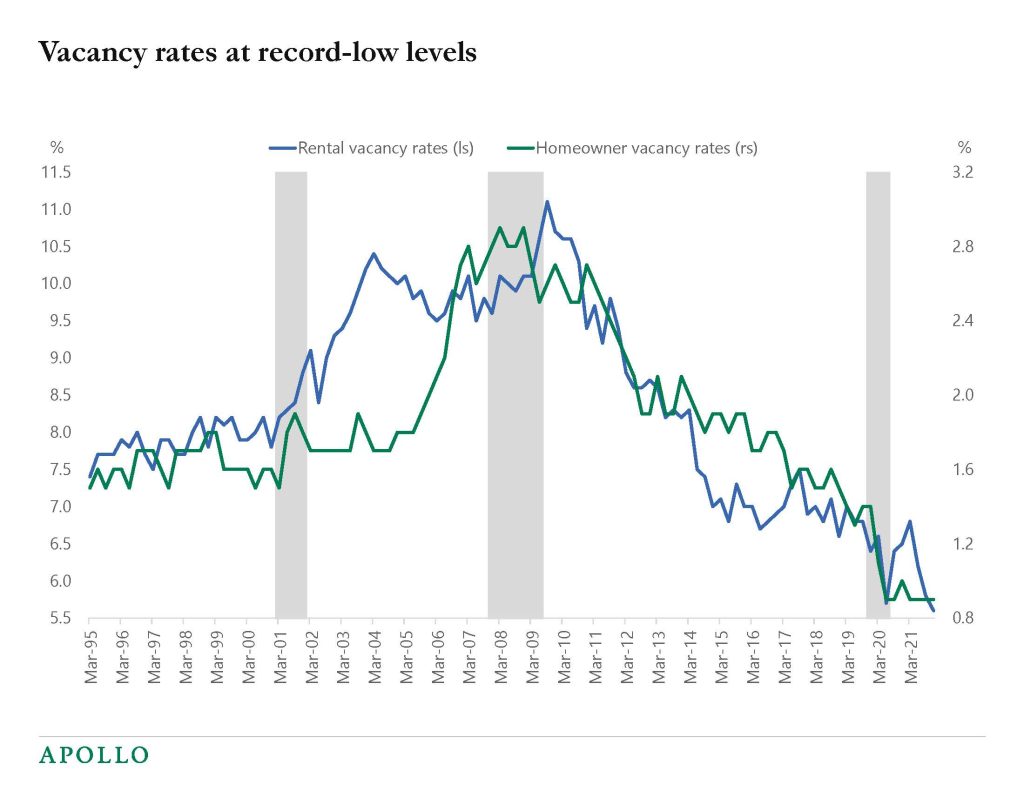
Source: Bloomberg, Apollo Chief Economist See important disclaimers at the bottom of the page.
-
The Fed is raising rates to cool down inflation, but daily indicators for consumer spending, airline travel, hotel reservations, and restaurant bookings show no signs of the economy slowing down, see charts below.
Combined with the strong March employment report, the conclusion is that despite higher rates and heightened geopolitical uncertainty, the incoming data is still strong and the Fed will continue to be hawkish until the economy starts to show signs of slowing down.
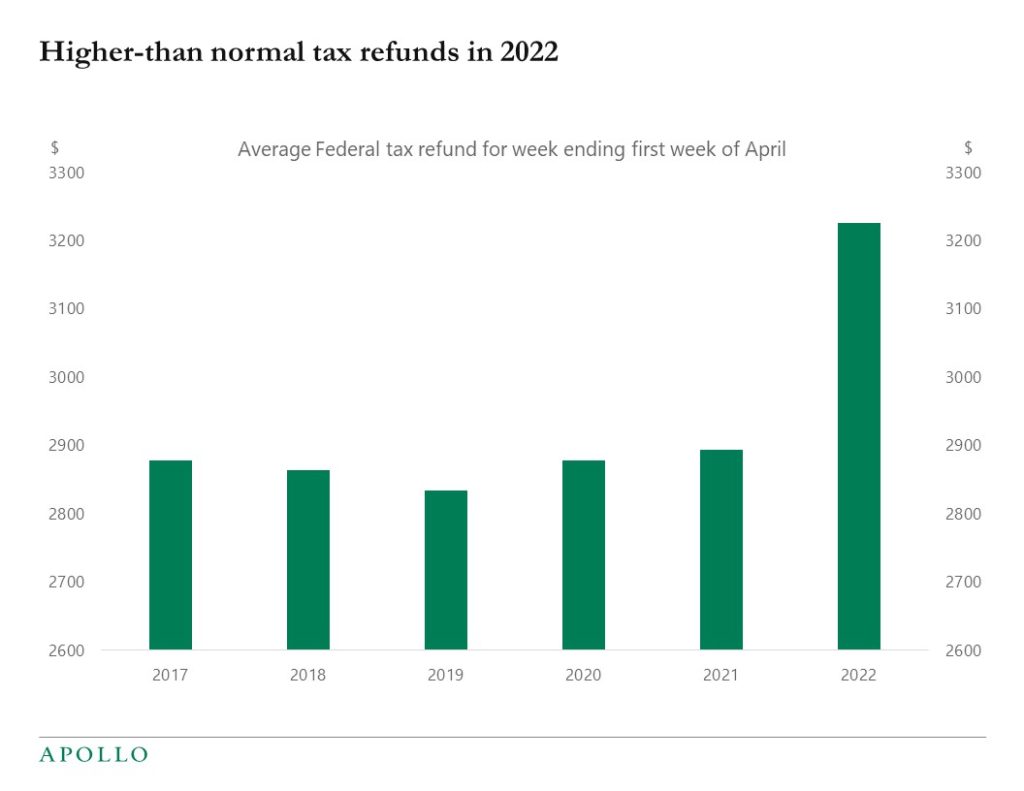
Source: IRS, Apollo Chief Economist 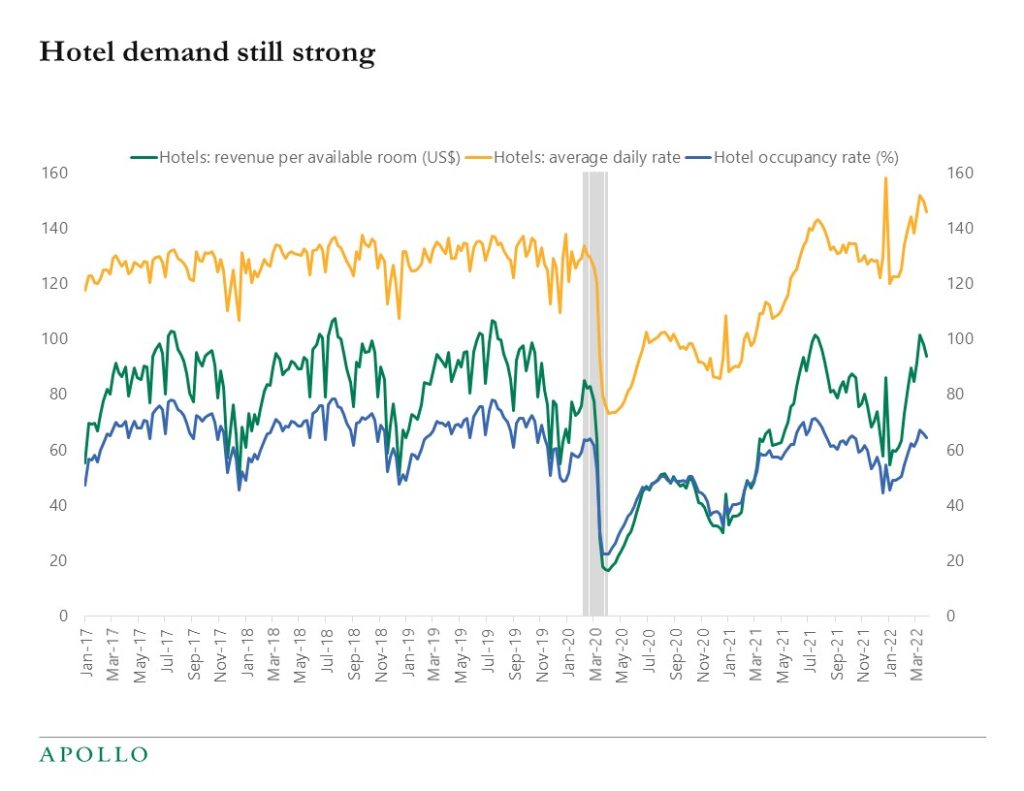
Source: STR, Haver Analytics, Apollo Chief Economist 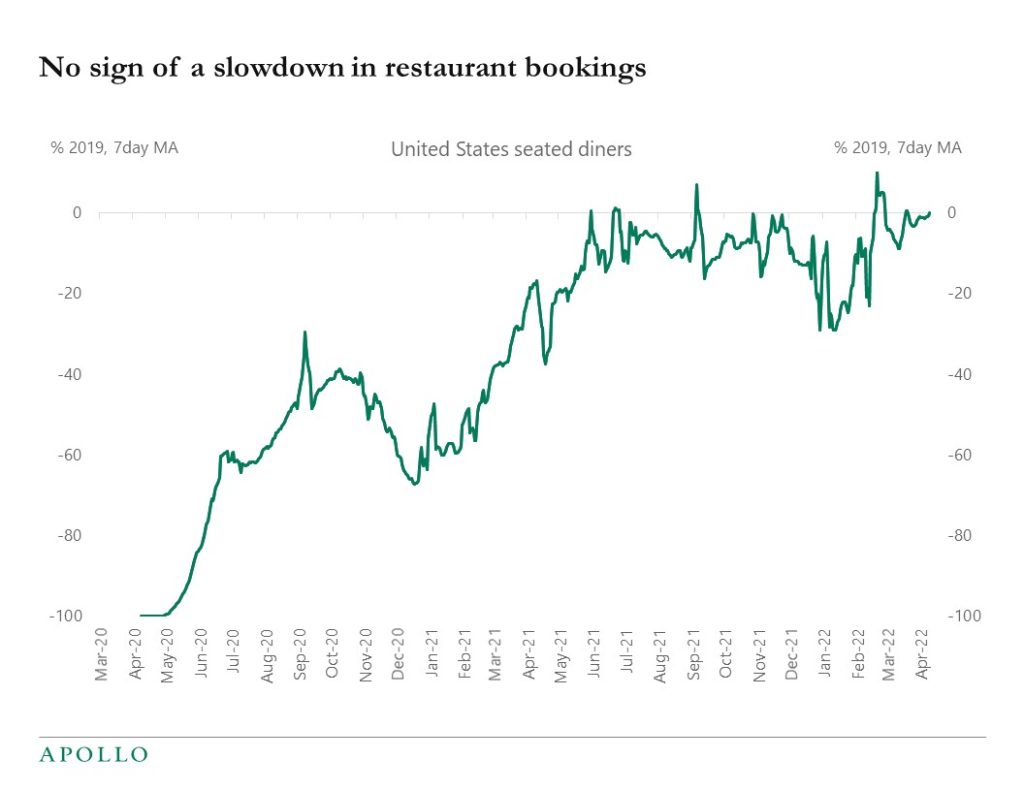
Source: OpenTable, Bloomberg, Apollo Chief Economist 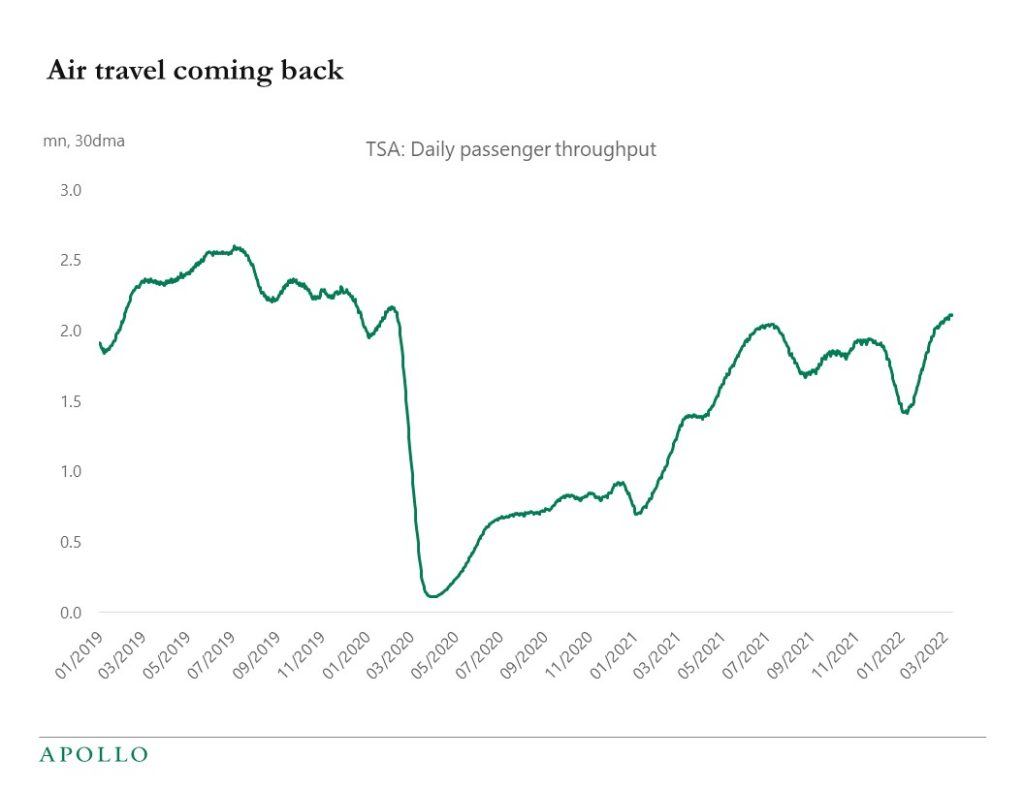
Source: TSA, Bloomberg, Apollo Chief Economist 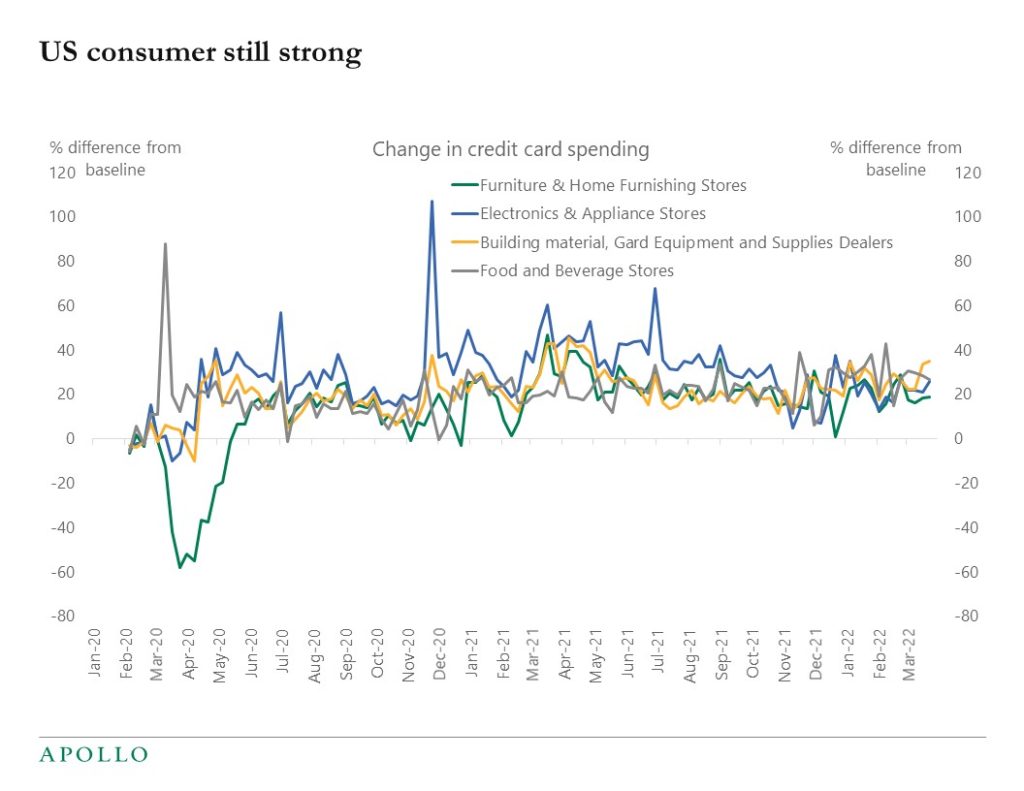
Source: BEA, Haver analytics, Apollo Chief Economist. Note: The weekly values represent the predicted percentage difference from the typical level of spending (prior to the pandemic declared by the World Health Organization on March 11, 2020) after adjusting for day-of-week, month, and year effects, based on daily data. The typical level corresponds to a value of zero. 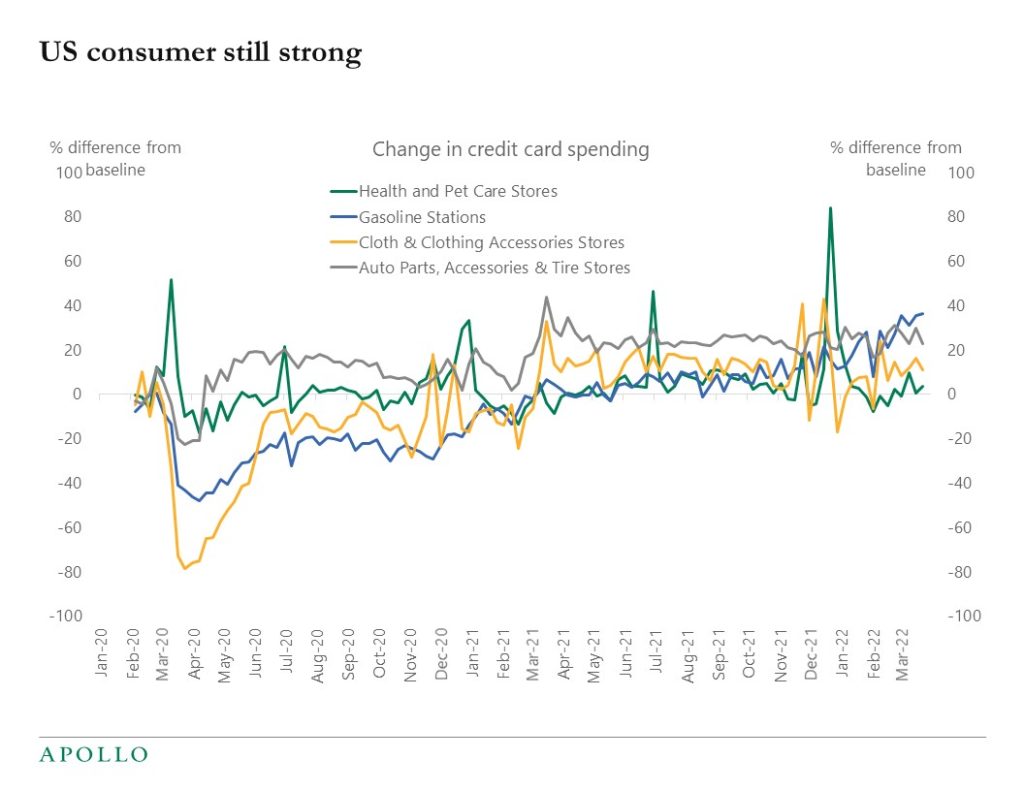
Source: BEA, Haver analytics, Apollo Chief Economist. Note: The weekly values represent the predicted percentage difference from the typical level of spending (prior to the pandemic declared by the World Health Organization on March 11, 2020) after adjusting for day-of-week, month, and year effects, based on daily data. The typical level corresponds to a value of zero. 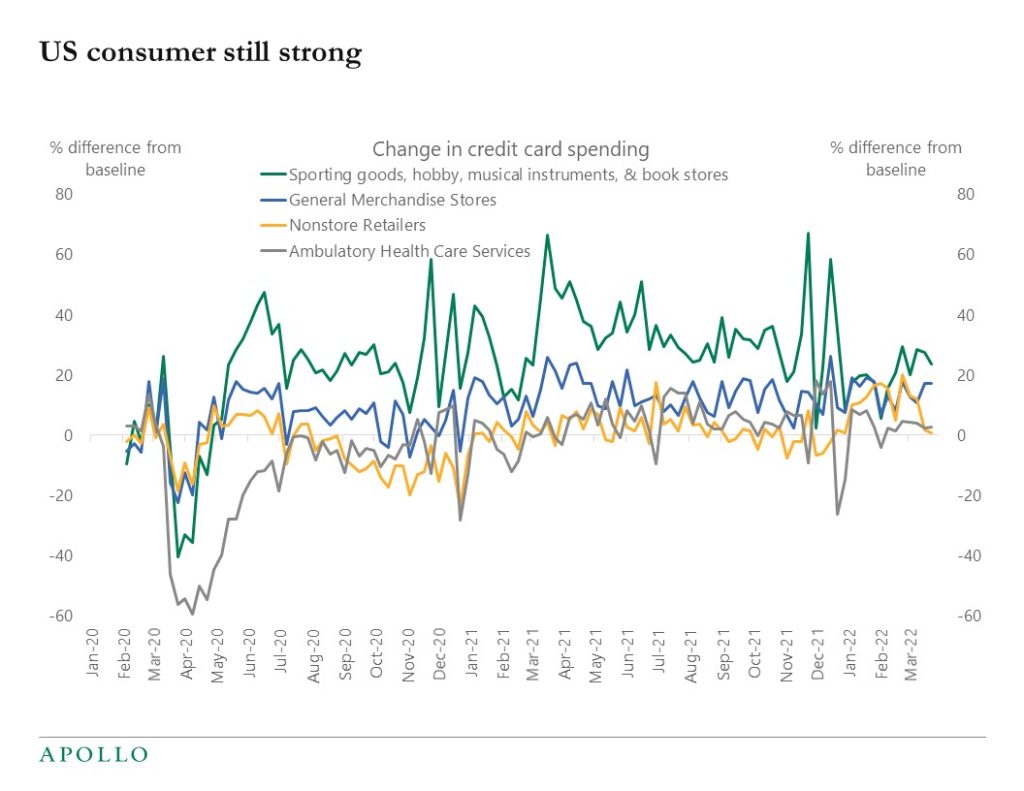
Source: BEA, Haver analytics, Apollo Chief Economist. Note: The weekly values represent the predicted percentage difference from the typical level of spending (prior to the pandemic declared by the World Health Organization on March 11, 2020) after adjusting for day-of-week, month, and year effects, based on daily data. The typical level corresponds to a value of zero. See important disclaimers at the bottom of the page.
-
Our latest credit market outlook is available here. Turbulence is likely to continue driven by inflation uncertainty, rising rates, and emerging fears of a hard landing.
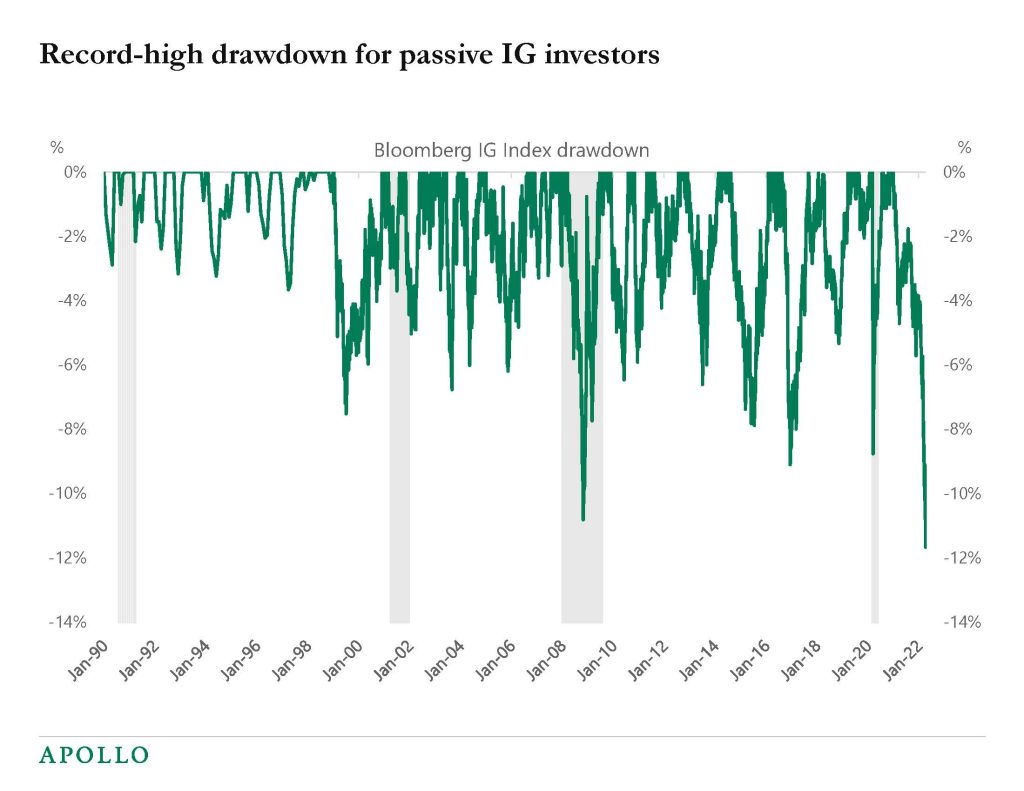
Source: Bloomberg, Apollo Chief Economist. Note: Index used LEGATRUU Index. 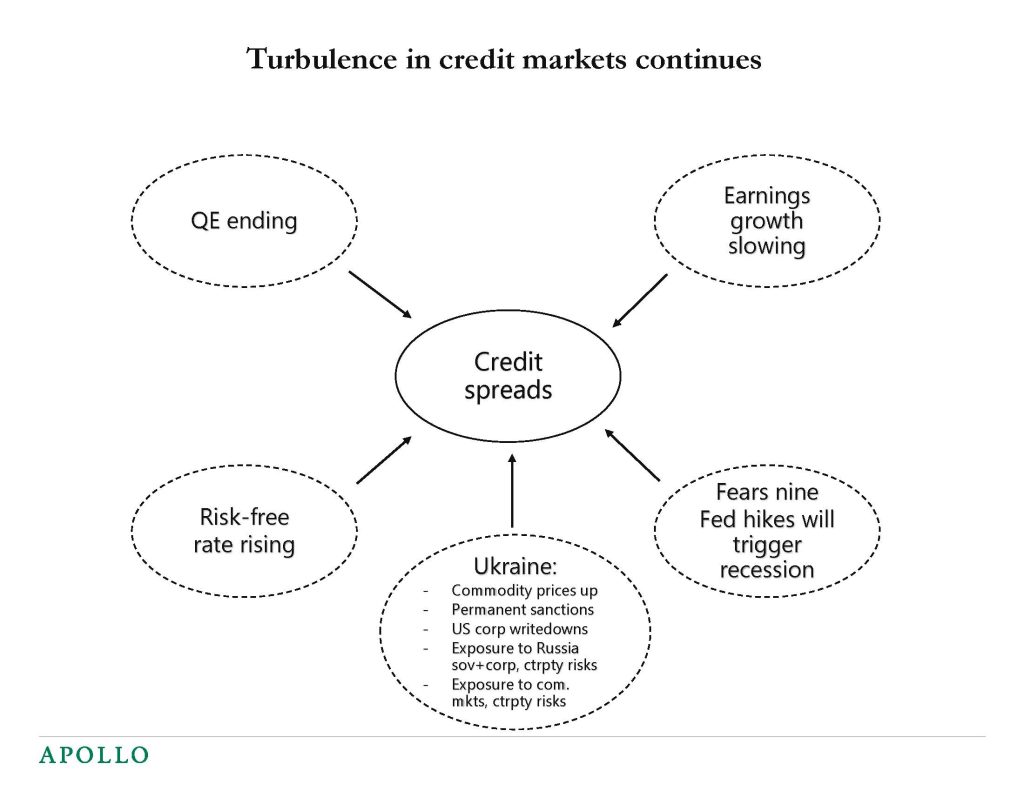
Source: Apollo Chief Economist 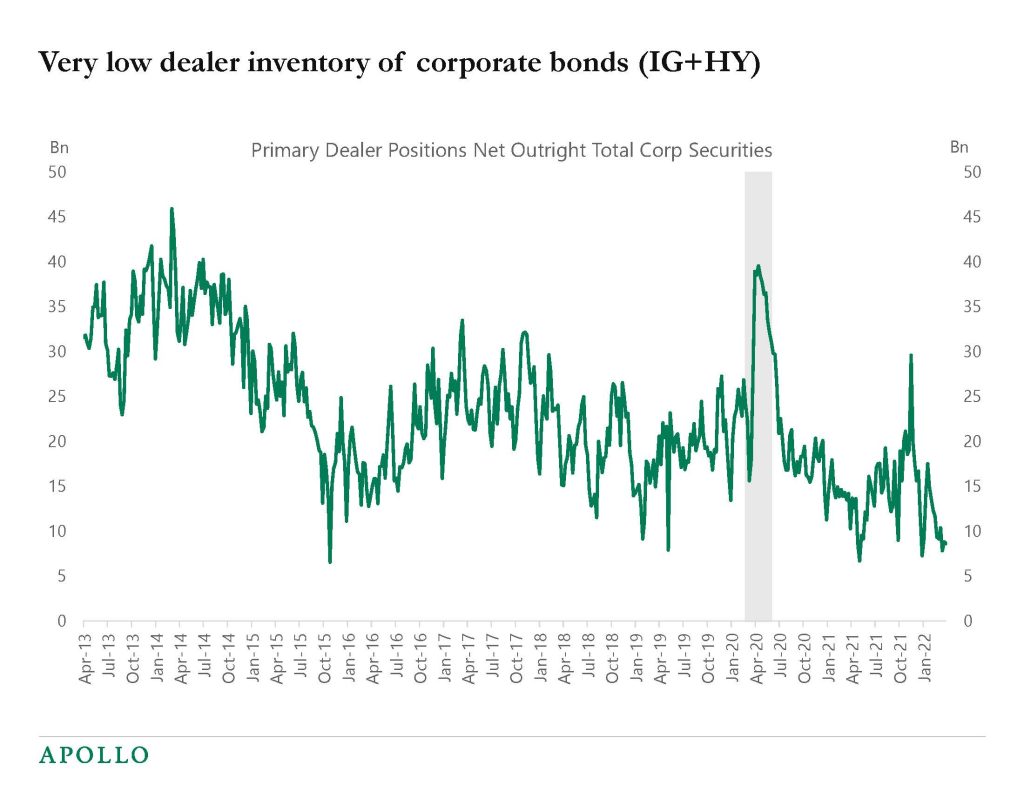
Source: Bloomberg, Apollo Chief Economist 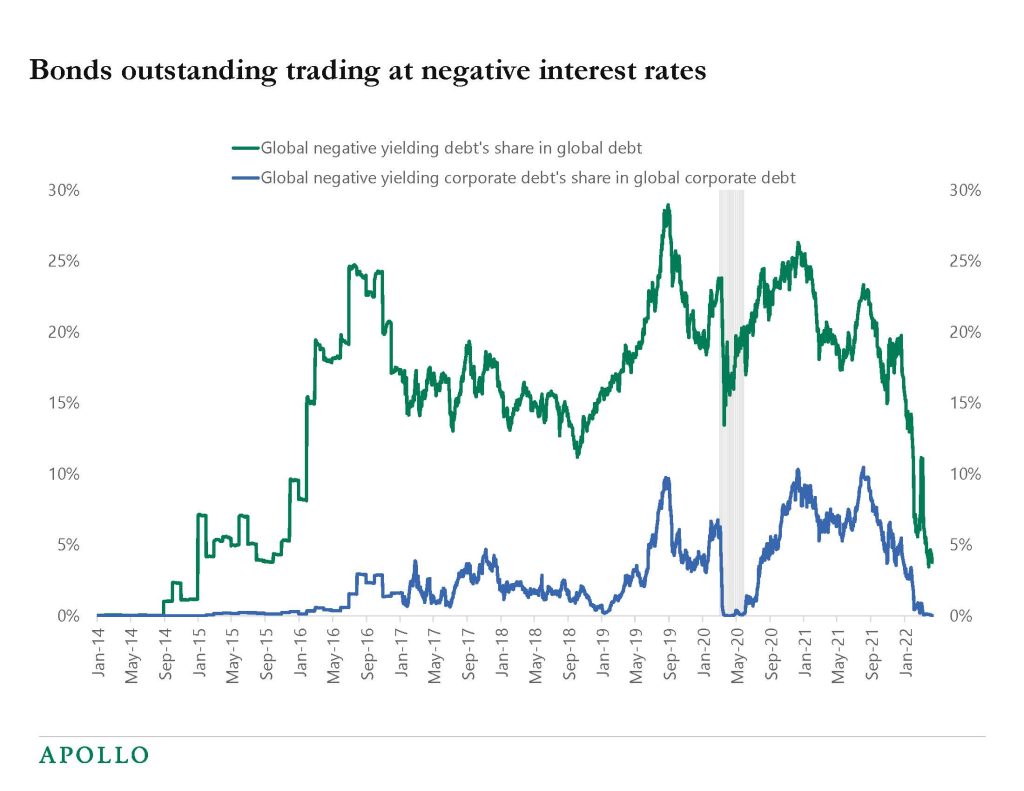
Source: Bloomberg, Apollo Chief Economist 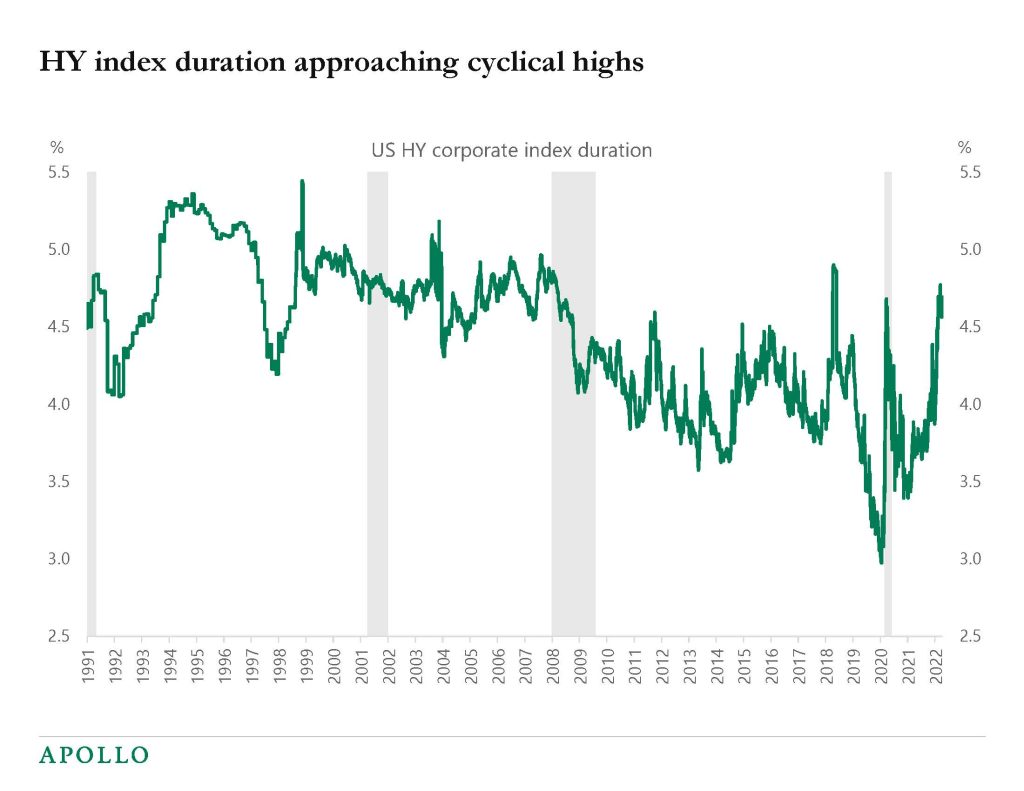
Source: Bloomberg, Apollo Chief Economist. Note: The measure used is modified duration, which measures the expected change in a bond’s price to a 1% change in interest rates. 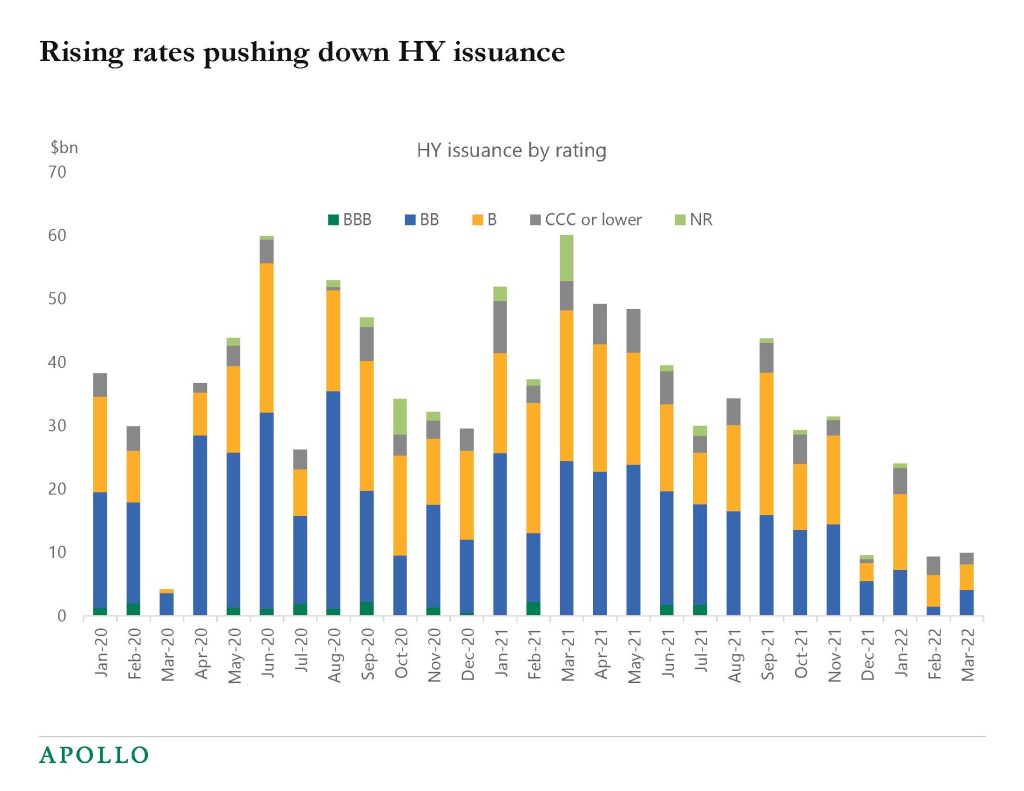
Source: S&P LCD, Apollo Chief Economist. Note: Data as of 31st March 2022. 
Source: FRB, Haver Analytics, Apollo Chief Economist 
Source: FRB, Haver Analytics, Apollo Chief Economist See important disclaimers at the bottom of the page.
-
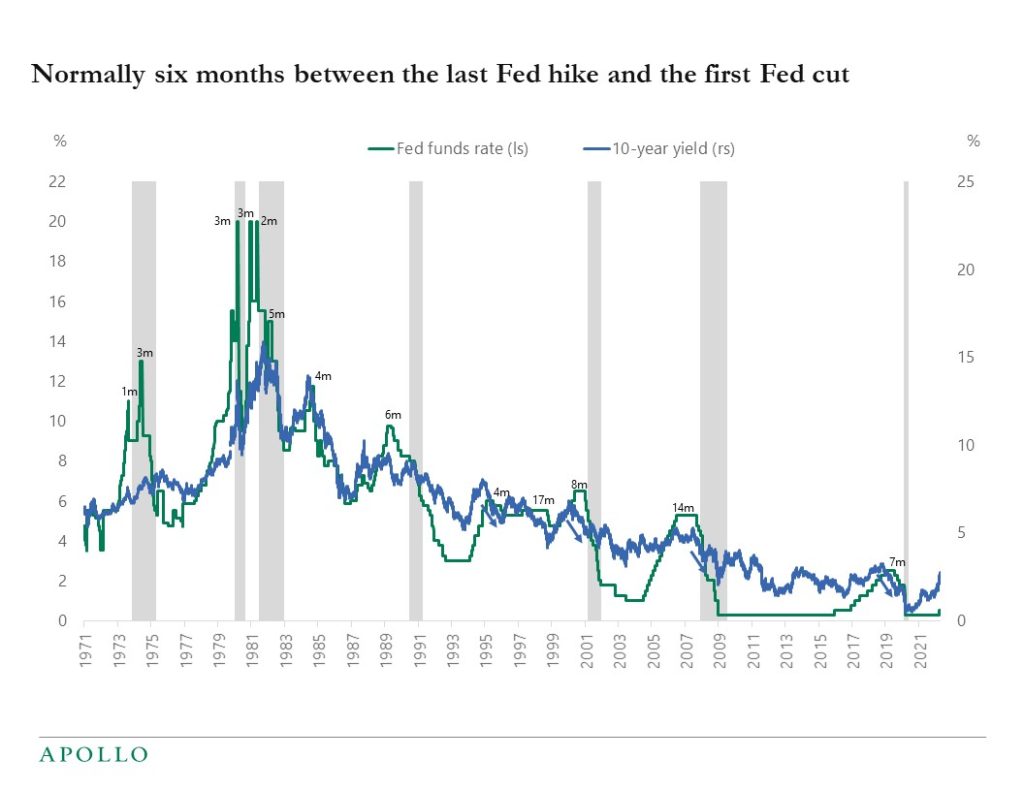
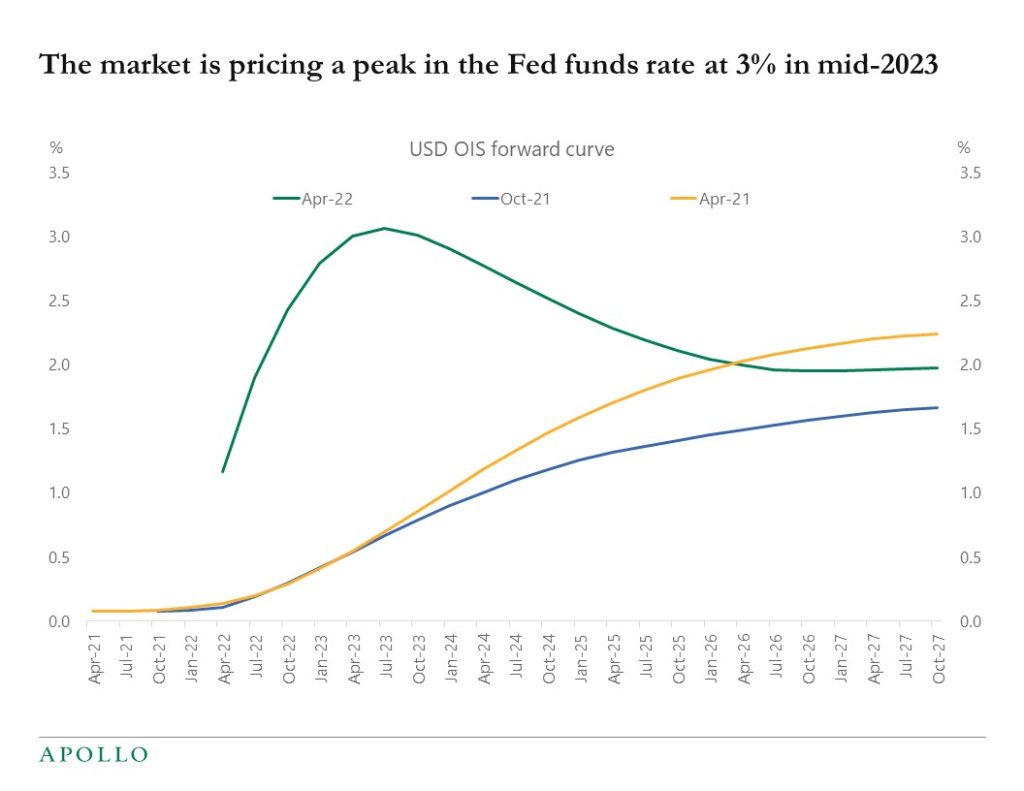
The market is currently pricing that the Fed funds rate will peak at 3.25% in mid-2023. On average, the Fed began cutting rates six months after the Fed funds rate peaks. And 10s typically peak around the time of the last Fed hike see chart below.
Source: FRB, Bloomberg, Apollo Chief Economist See important disclaimers at the bottom of the page.
-
The consensus forecast is that inflation will soon peak.
With inflation soon peaking, the question in rates markets is when the Fed will turn more dovish because there is less need for the Fed to be as hawkish once inflation begins to trend lower.
If the Fed starts to sound more dovish because of inflation trending lower, then long rates will likely peak and begin to move down in anticipation of fewer Fed hikes and slower growth coming.
With this asymmetric setup, the pain trade in markets this week is if we get an inflation print lower than the expected 8.4%. In that case, rates are likely to move lower across the curve quickly.
Source: Bloomberg, Apollo Chief Economist See important disclaimers at the bottom of the page.
-
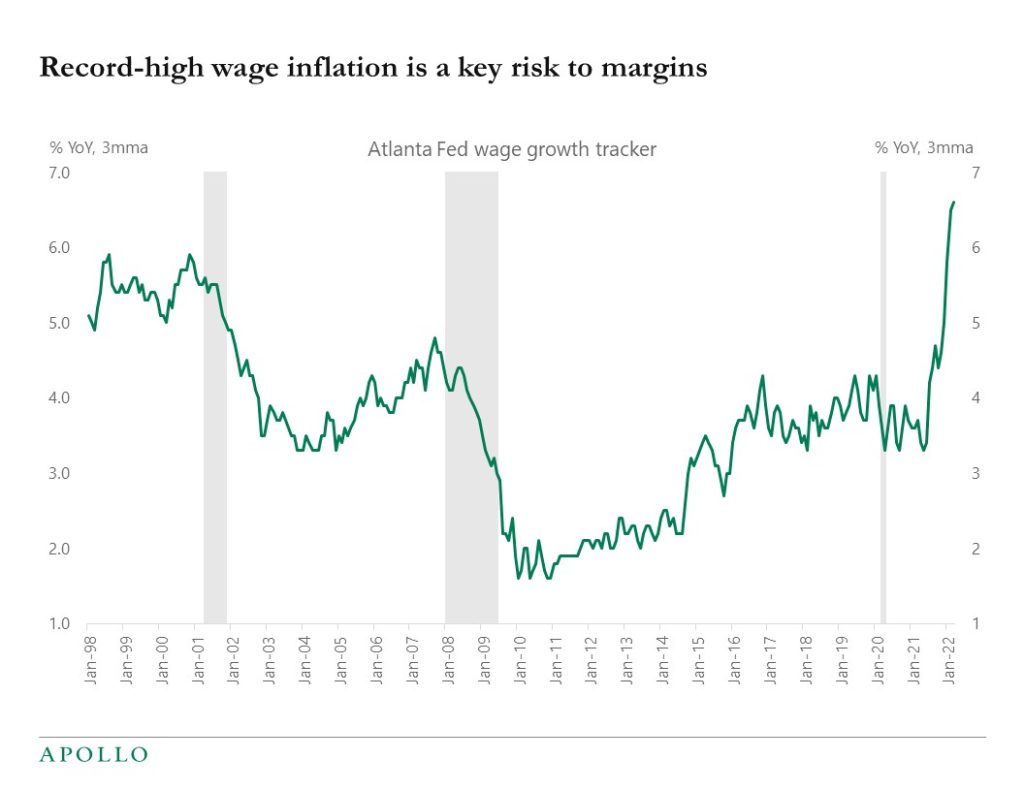
The latest wage data from the Atlanta Fed is out, and it shows the highest growth in wages on record. Job switchers are seeing particularly strong increases in compensation, see charts below.
The Fed will look at these trends and conclude that the labor market is overheating and financial conditions have to be tightened immediately. Either via higher rates, wider credit spreads, lower equities, or some combination. The goal now is demand destruction to get inflation under control, and the market should not underestimate the Fed’s commitment to make this happen.
Source: FRB Atlanta, Haver Analytics, Apollo Chief Economist 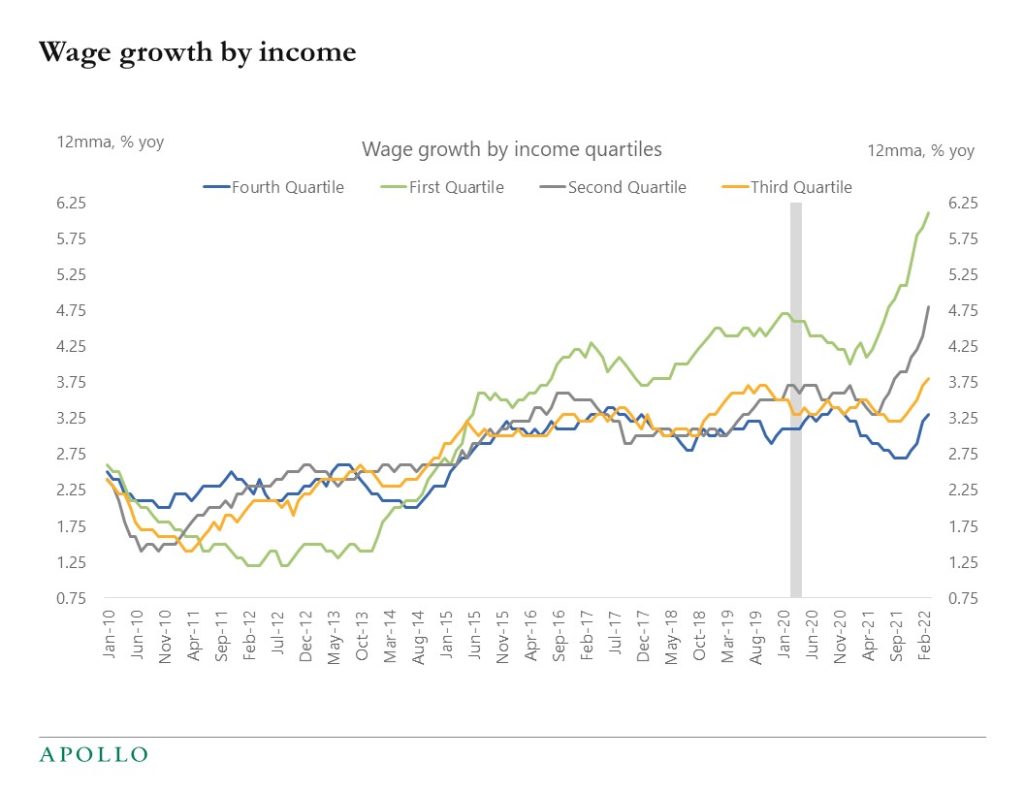
Source: FRB Atlanta, Apollo Chief Economist 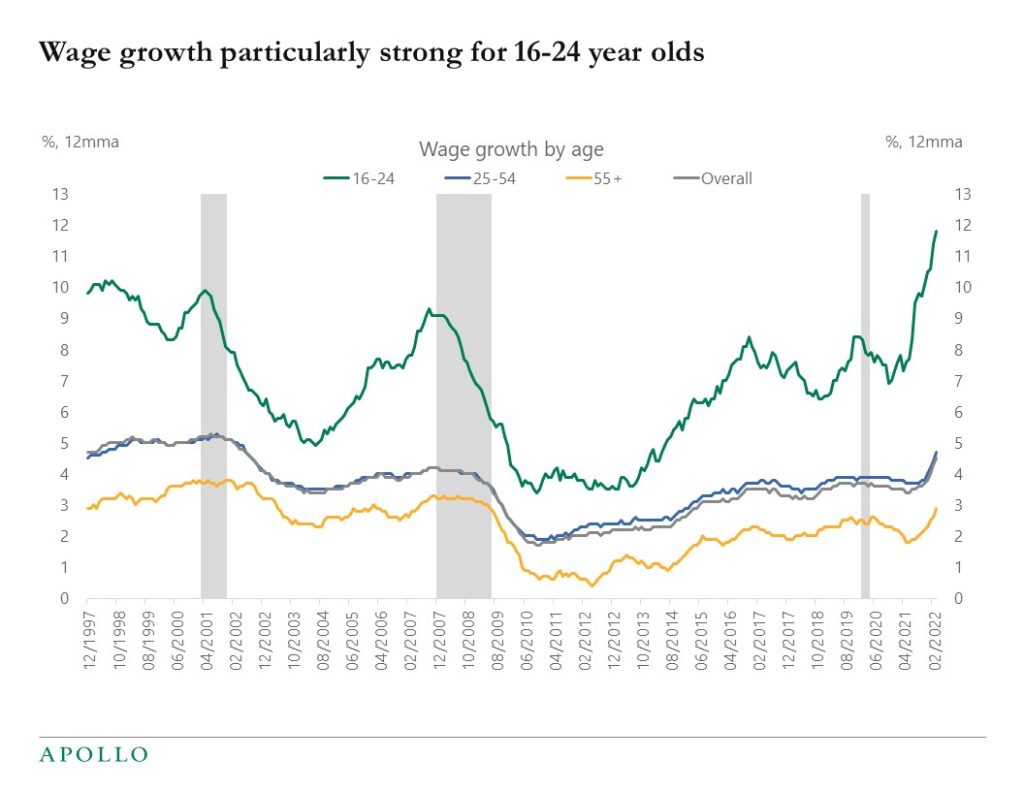
Source: FRB Atlanta, Apollo Chief Economist 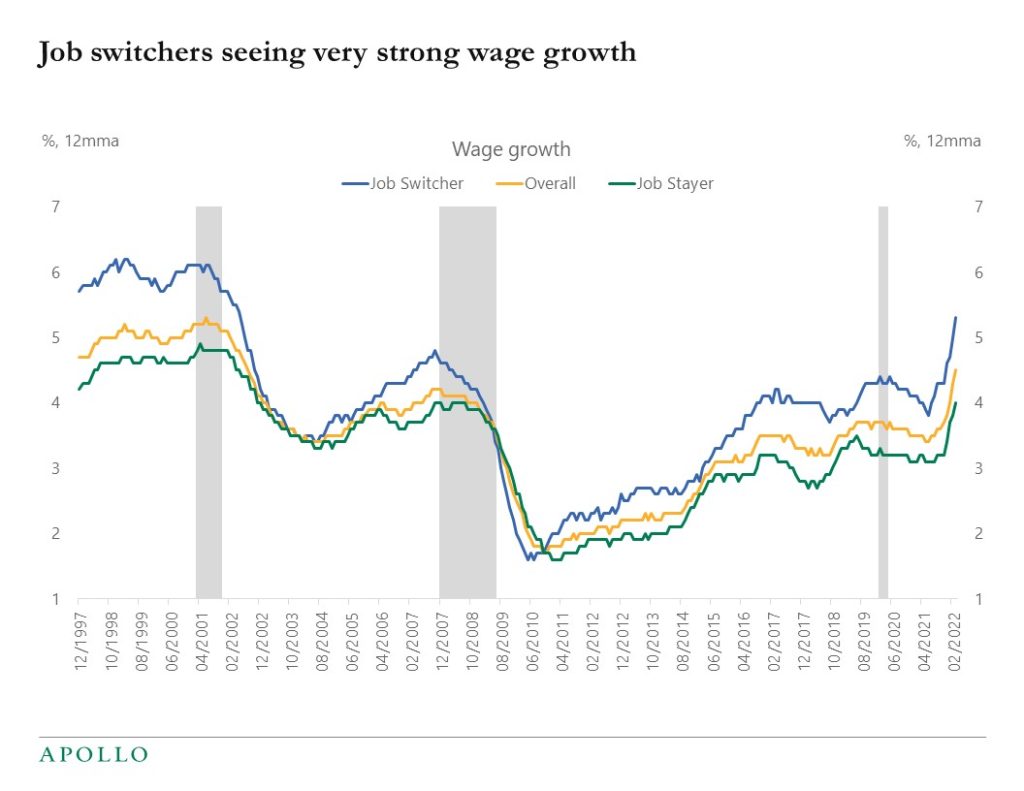
Source: FRB Atlanta, Apollo Chief Economist See important disclaimers at the bottom of the page.
-
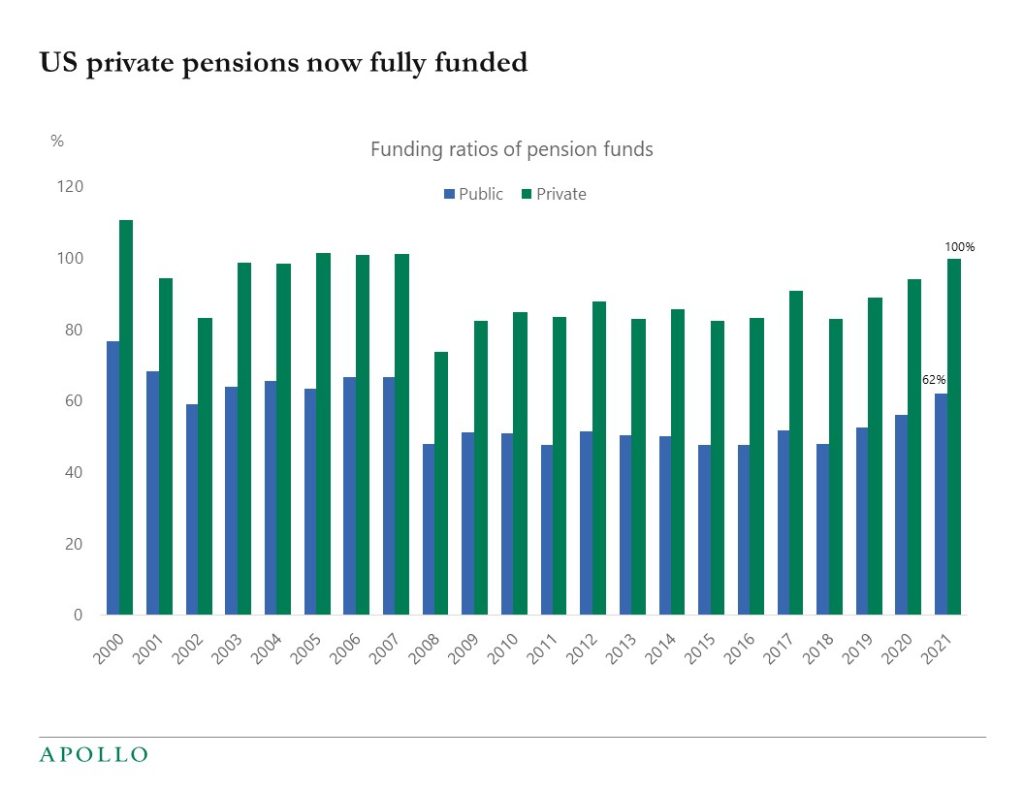
Rising stock prices and rising discount rates have increased the funding ratio of private and public pension funds, see charts below.
For the first time in 15 years, private pension funds have assets and expected cash flows matching future liabilities.
With the funding ratio reaching 100%, pension funds are de-risking and locking in gains in stock prices and buying rates and also high-grade credit to lock in yields.
The bottom line is that rising funding rates are creating significant demand for fixed income as yields move higher.
A different way to look at it is that as the Fed stops doing QE, another buyer, namely pensions, is stepping in to buy fixed income.
And such significant structural buying makes it harder for the Fed to achieve the desired tightening in financial conditions.
Source: Apollo Chief Economist, Federal Reserve Financial Accounts 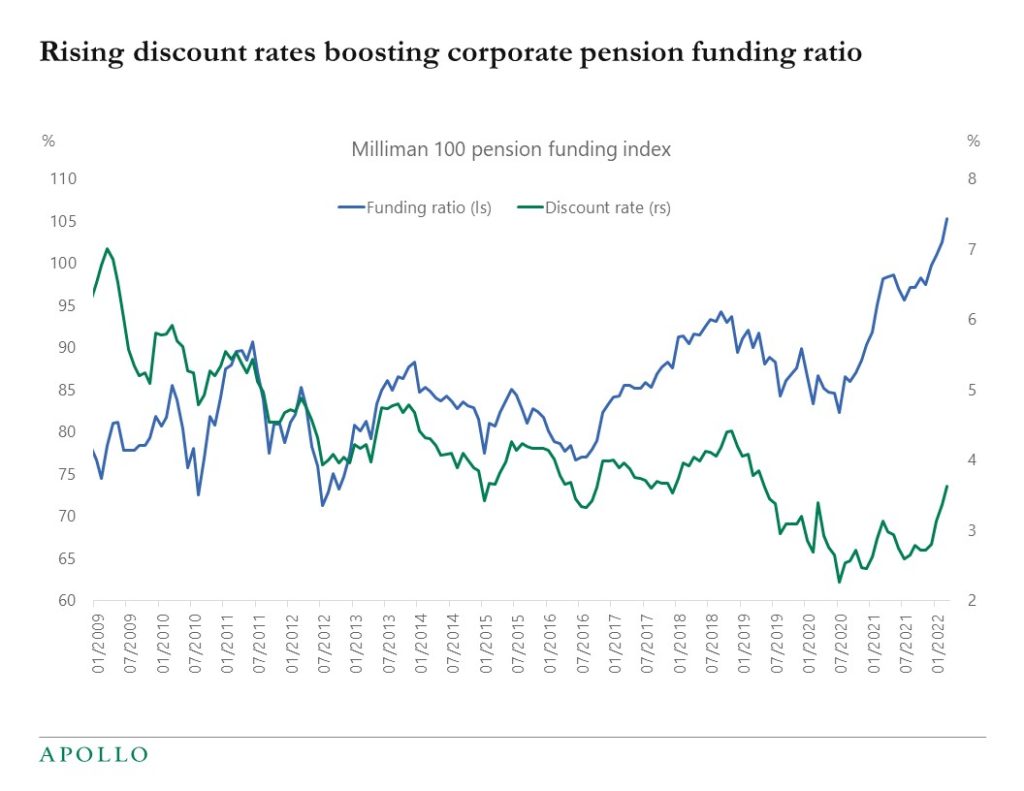
Source: Milliman, Bloomberg, Apollo Chief Economist See important disclaimers at the bottom of the page.

This presentation may not be distributed, transmitted or otherwise communicated to others in whole or in part without the express consent of Apollo Global Management, Inc. (together with its subsidiaries, “Apollo”).
Apollo makes no representation or warranty, expressed or implied, with respect to the accuracy, reasonableness, or completeness of any of the statements made during this presentation, including, but not limited to, statements obtained from third parties. Opinions, estimates and projections constitute the current judgment of the speaker as of the date indicated. They do not necessarily reflect the views and opinions of Apollo and are subject to change at any time without notice. Apollo does not have any responsibility to update this presentation to account for such changes. There can be no assurance that any trends discussed during this presentation will continue.
Statements made throughout this presentation are not intended to provide, and should not be relied upon for, accounting, legal or tax advice and do not constitute an investment recommendation or investment advice. Investors should make an independent investigation of the information discussed during this presentation, including consulting their tax, legal, accounting or other advisors about such information. Apollo does not act for you and is not responsible for providing you with the protections afforded to its clients. This presentation does not constitute an offer to sell, or the solicitation of an offer to buy, any security, product or service, including interest in any investment product or fund or account managed or advised by Apollo.
Certain statements made throughout this presentation may be “forward-looking” in nature. Due to various risks and uncertainties, actual events or results may differ materially from those reflected or contemplated in such forward-looking information. As such, undue reliance should not be placed on such statements. Forward-looking statements may be identified by the use of terminology including, but not limited to, “may”, “will”, “should”, “expect”, “anticipate”, “target”, “project”, “estimate”, “intend”, “continue” or “believe” or the negatives thereof or other variations thereon or comparable terminology.