Want it delivered daily to your inbox?
-
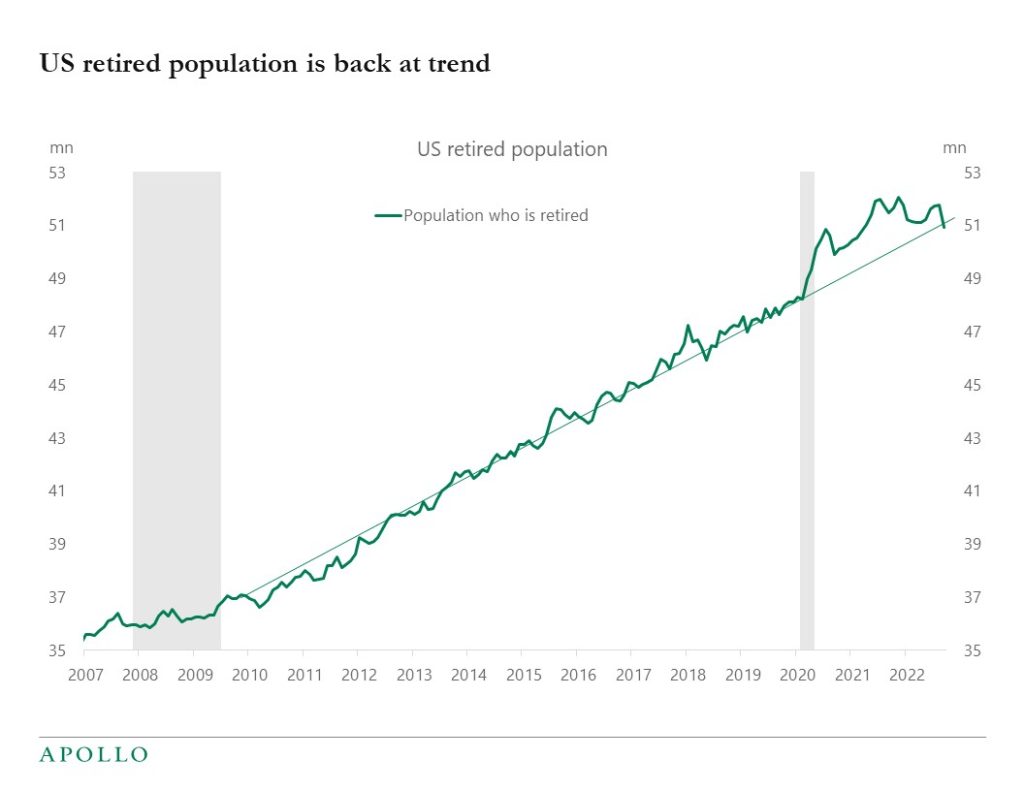
Early in the pandemic, a lot of people retired early. But the size of the retired population is now back at the pre-pandemic trend, see chart below.
Source: CPS IPUMS, Apollo Chief Economist See important disclaimers at the bottom of the page.
-
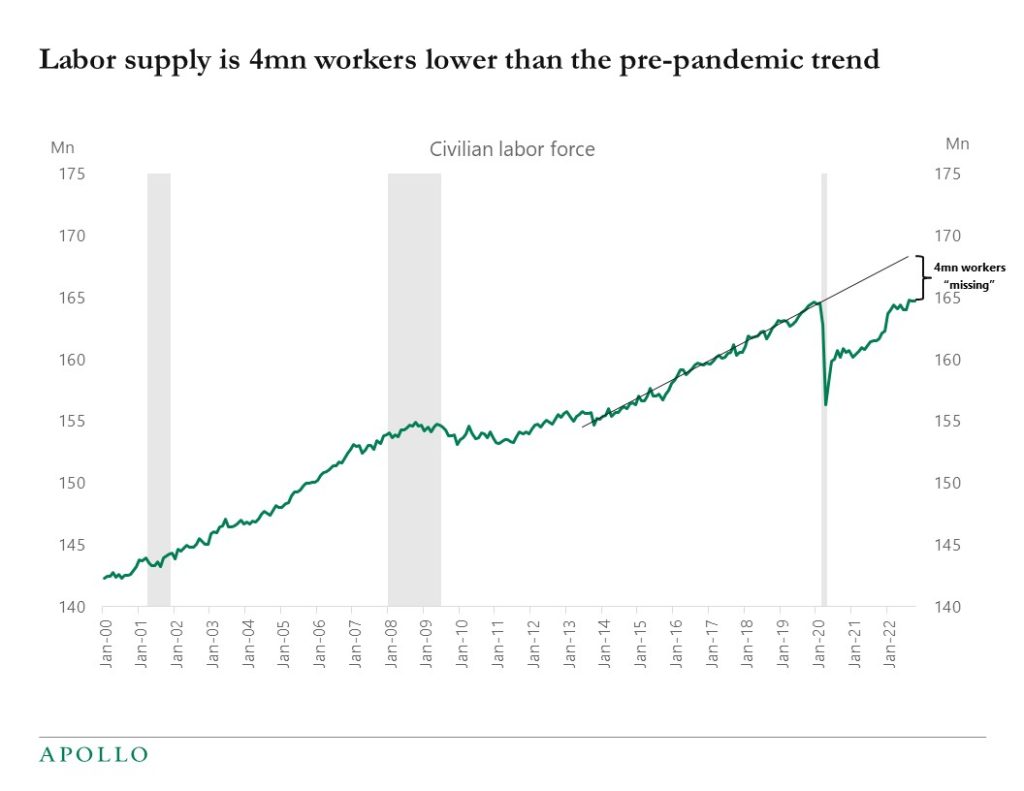
The labor force is currently 4 million below the pre-pandemic trend, see chart below. This is a high number when considering that the total number of unemployed is presently at 6 million. The bottom line is that it is difficult to find workers and the labor market remains tight, and the upward pressure on wages will likely continue.
Source: BLS, Haver, Apollo Chief Economist See important disclaimers at the bottom of the page.
-
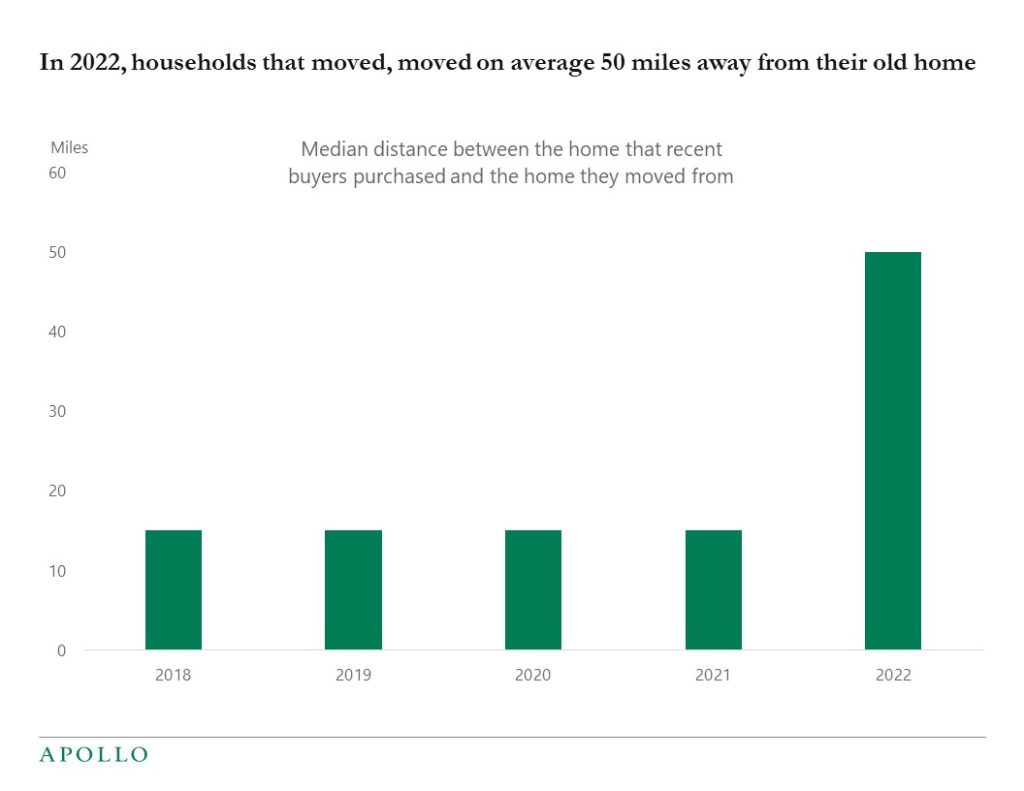
Normally households move to another house within 15 miles from where they used to live. In 2022 the median distance between the home that recent buyers purchased and the home they moved from was 50 miles, see chart below. The increase is likely driven by covid and affordability considerations.
Source: NAR, Apollo Chief Economist See important disclaimers at the bottom of the page.
-
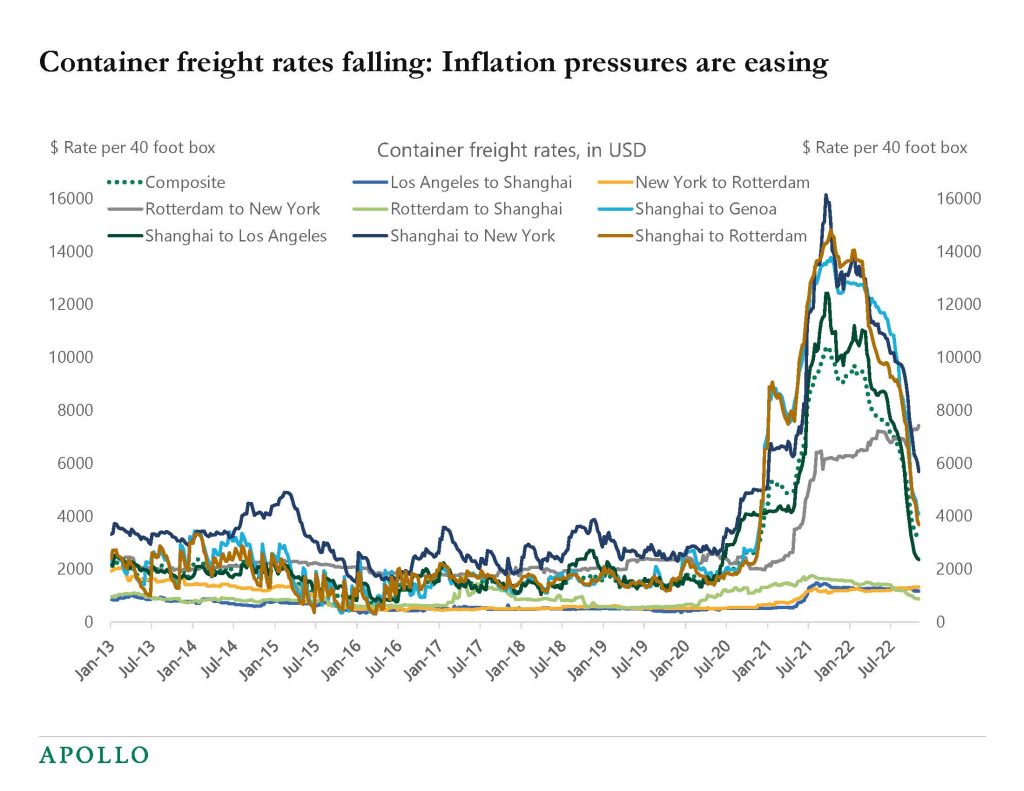
Supply chains are normalizing, and the costs of transportation by ship, truck, and train, are coming down, see charts below. The only exception is air freight rates, they are still at $5.5 per kilo, up from $2.5 before the pandemic. Our collection of supply chain charts is attached. The bottom line is that supply chains are normalizing, which will continue to put downward pressure on inflation.
Source: WCI, Bloomberg, Apollo Chief Economist 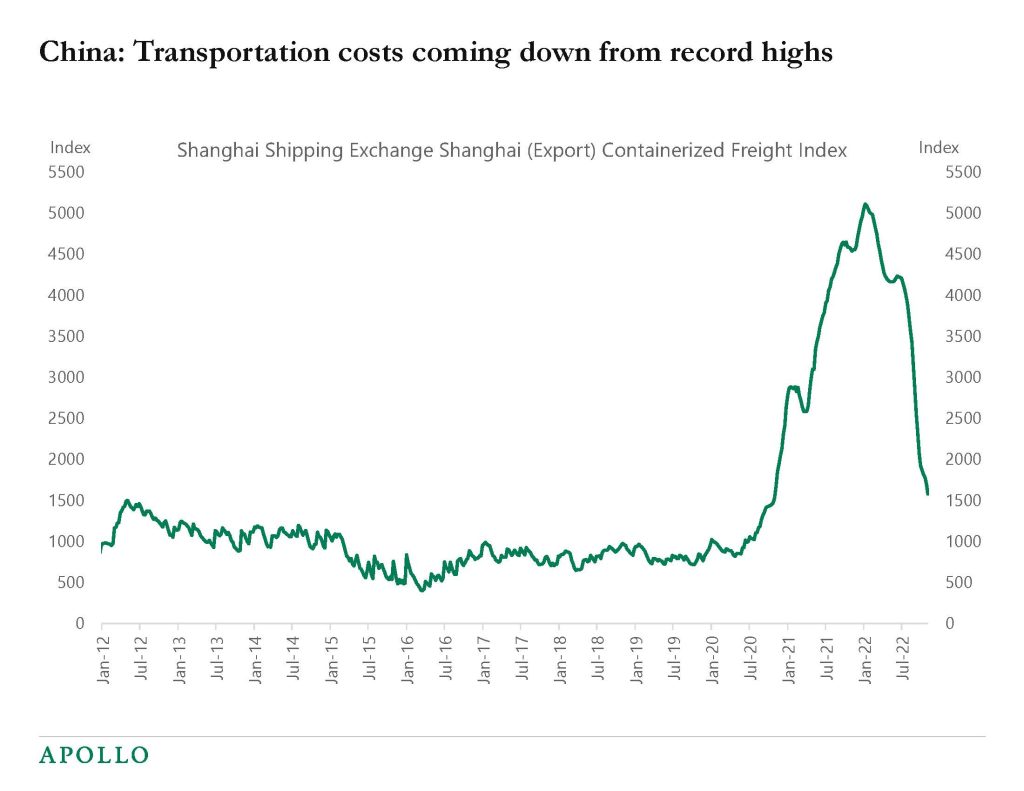
Source: Shanghai Shipping Exchange, Bloomberg, Apollo Chief Economist 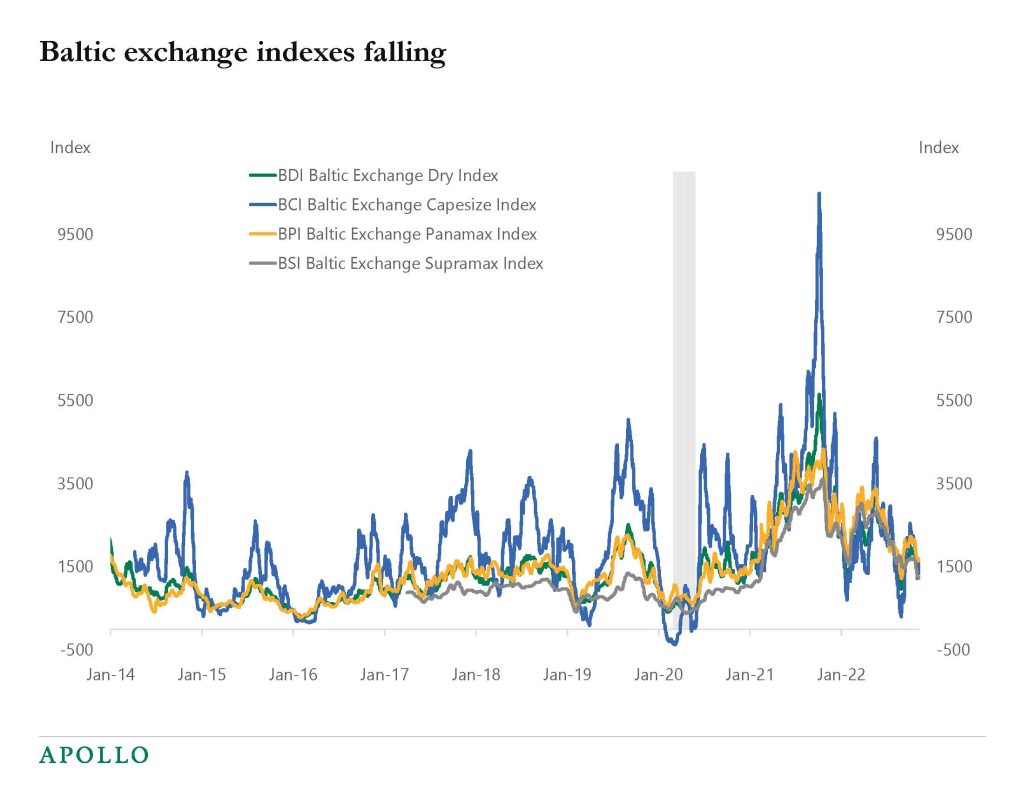
Source: Bloomberg, Apollo Chief Economist 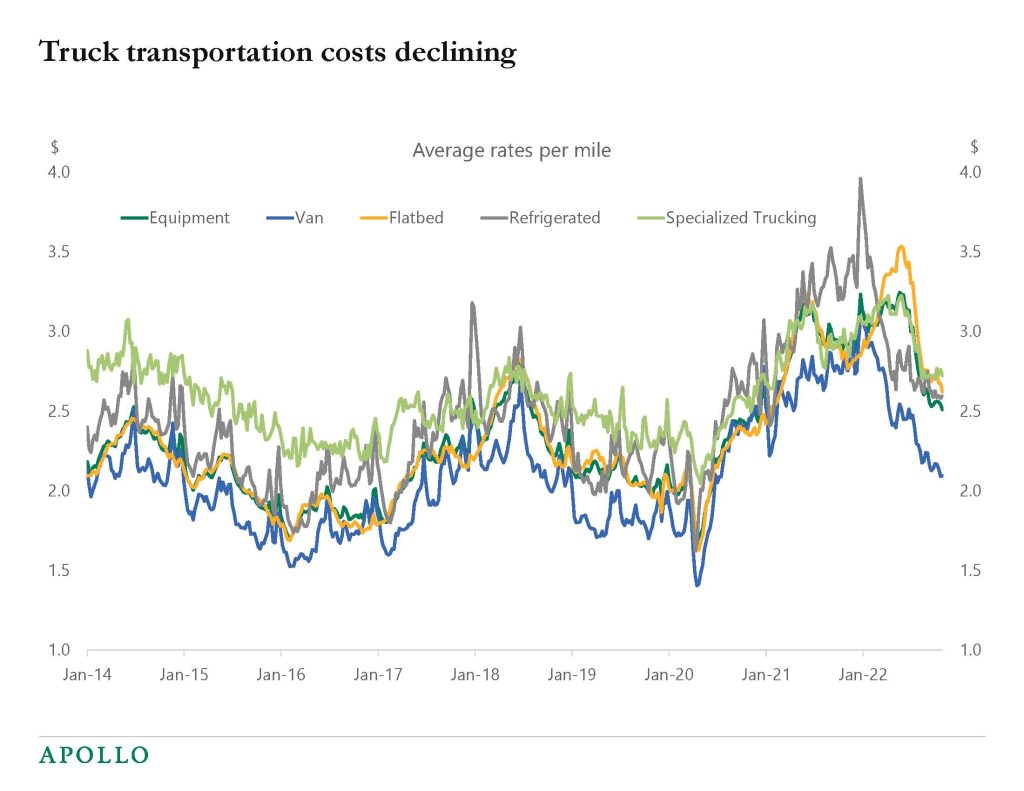
Source: Bloomberg, Apollo Chief Economist 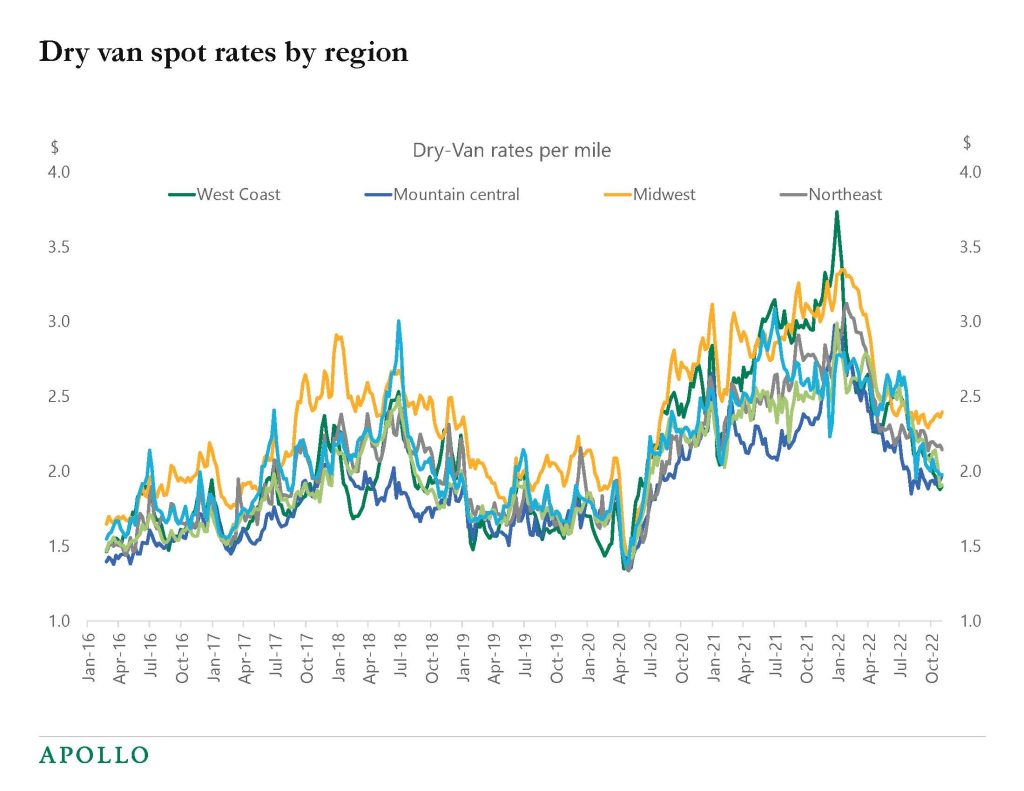
Source: Bloomberg, Apollo Chief Economist 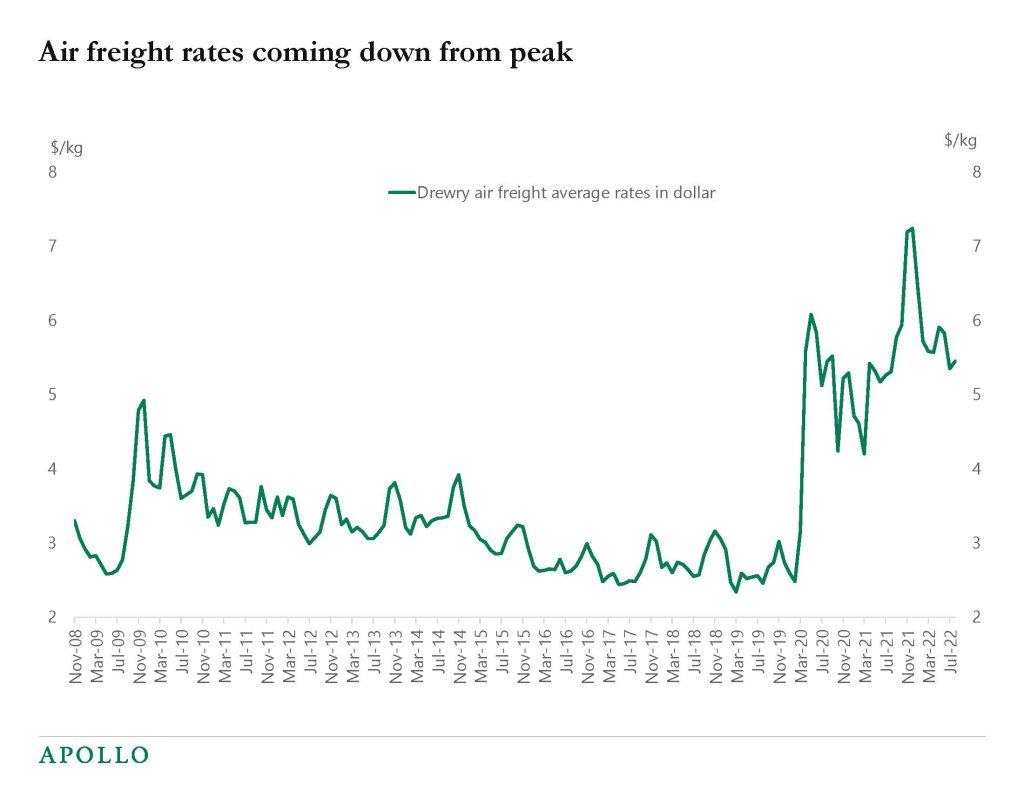
Source: Bloomberg, Apollo Chief Economist 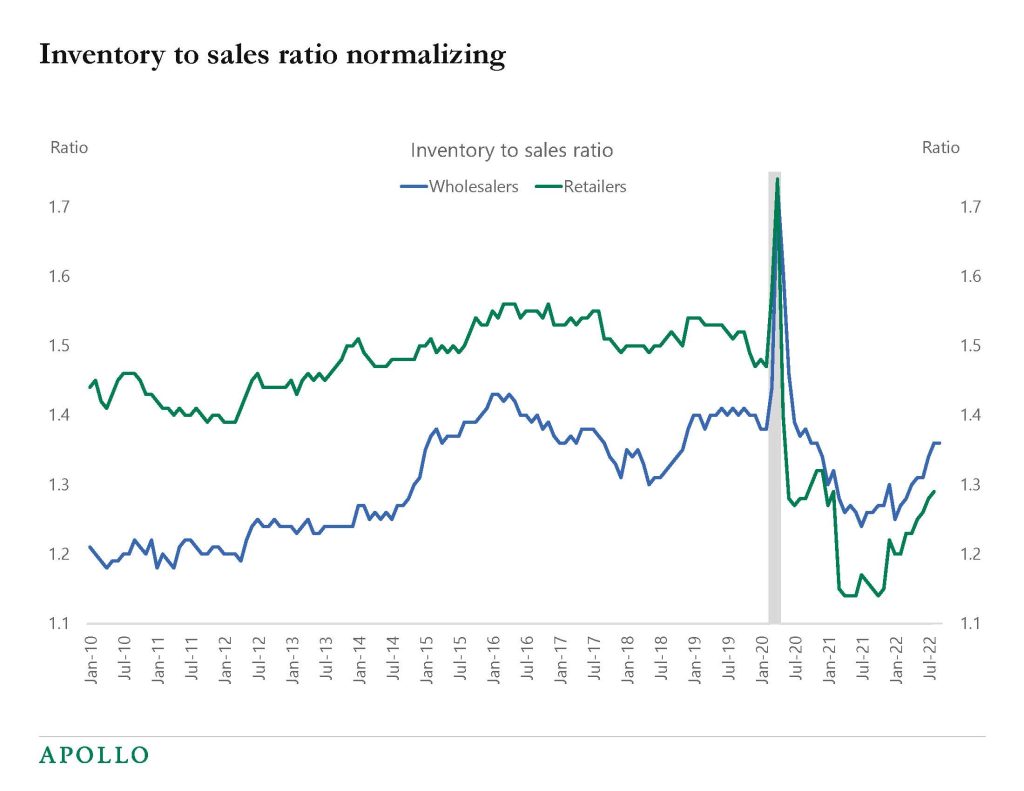
Source: Census, Haver Analytics, Apollo Chief Economist See important disclaimers at the bottom of the page.
-
The difference between inflation in the US and Europe is noteworthy, see chart below.
Europe is experiencing stagflation with high inflation and the economy in a recession.
The US is seeing falling inflation and still solid growth.
Our set of daily and weekly indicators is available here.
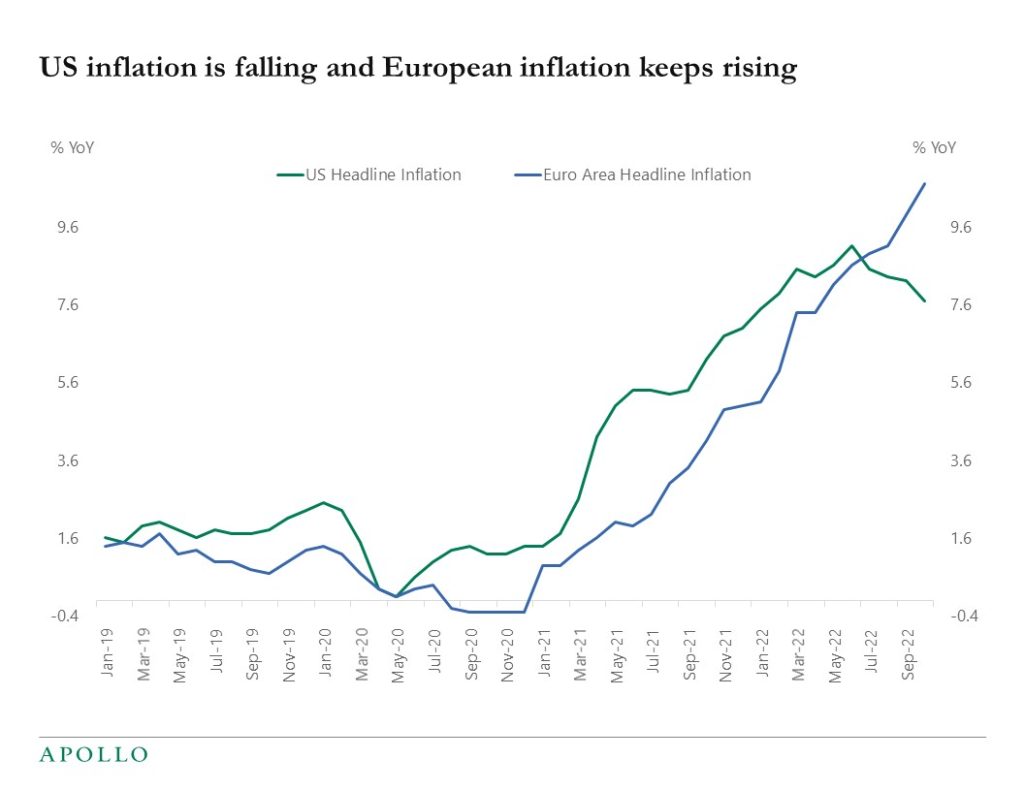
Source: Bloomberg, Apollo Chief Economist See important disclaimers at the bottom of the page.
-
The decline in inflation is good news for the Fed and markets, and there are good reasons to believe this is the beginning of a downtrend. How long will it take before we return to the Fed’s 2% inflation target? The pattern seen in the early 1970s suggests that it will take another two years, see chart below. The bottom line is that inflation is starting to come down without a sharp increase in the unemployment rate, which all points to a higher probability that we will get a soft landing, which should be bullish for credit and equities.
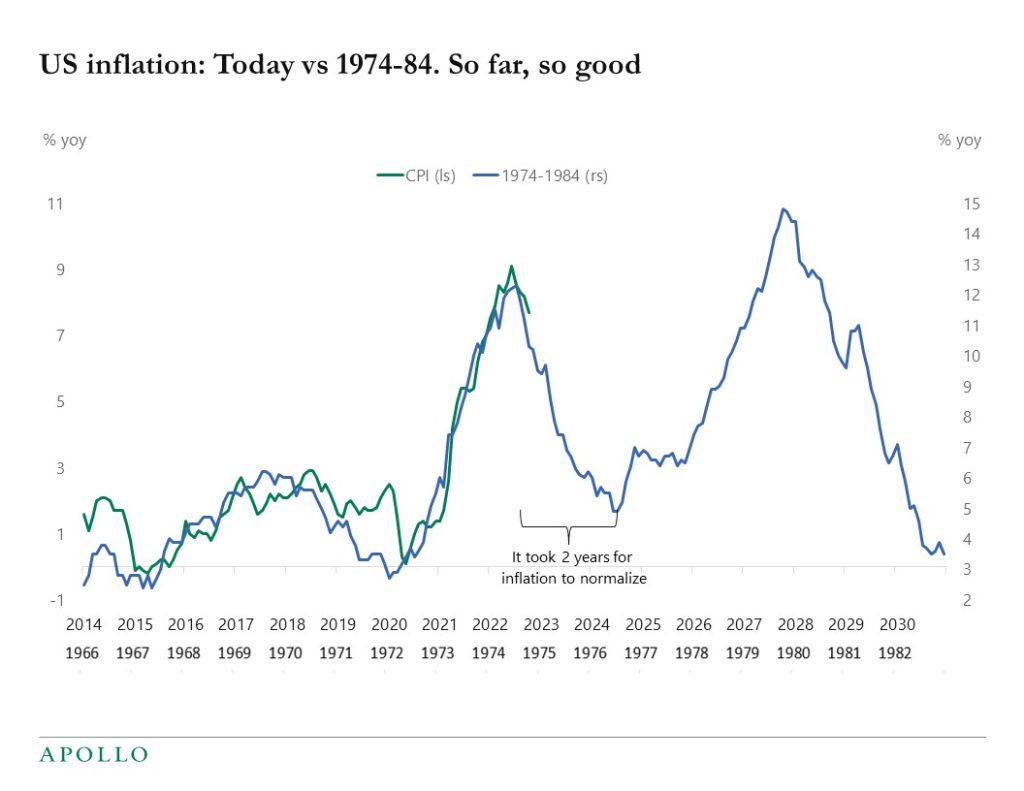
Source: BLS, Bloomberg, Apollo Chief Economist See important disclaimers at the bottom of the page.
-
Hiring for the holiday season is generally done in October, and adding up new jobs created in the BLS-defined holiday season retail sectors in the latest employment report shows that retailers expect a significantly weaker holiday season than in 2020 and 2021, see chart below. This soft outlook is consistent with growing inventories at many retailers. The BLS defines holiday sectors as furniture, electronics, personal care, clothing, sporting goods, general merchandise stores, miscellaneous store retailers (e.g., florists, office supply stores, gift shops, and pet shops), and non-store retailers (e.g., online shopping and mail-order houses, vending machine operators, and direct store establishments).
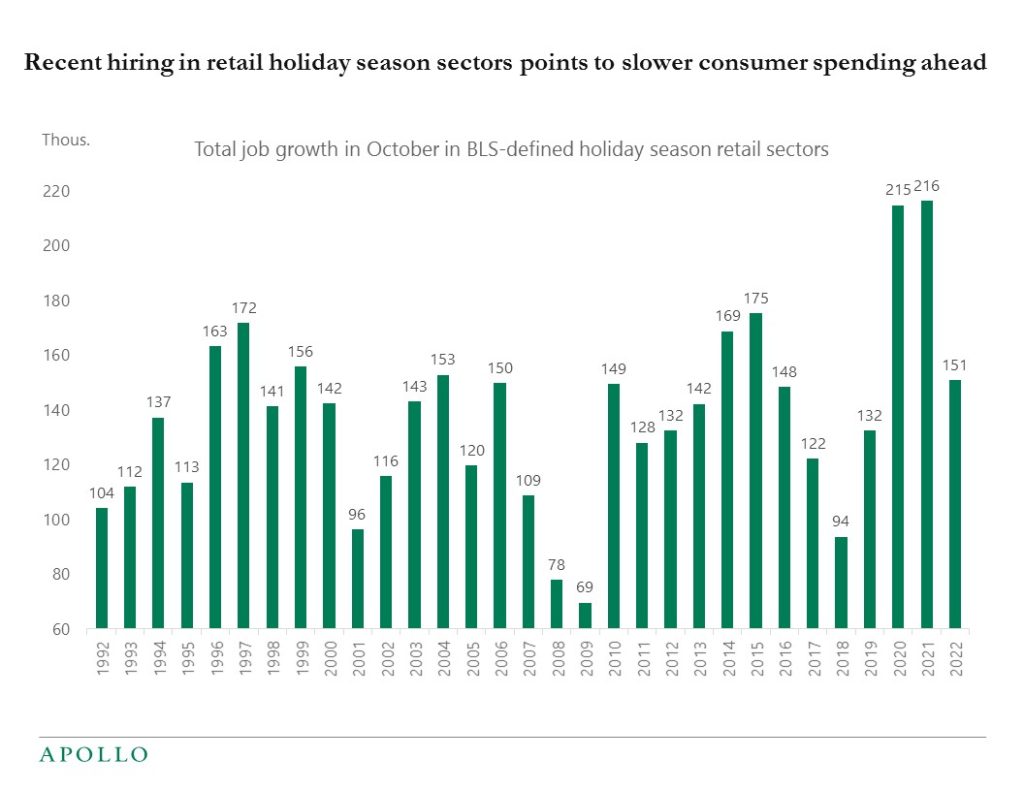
Source: BLS, Apollo Chief Economist. Note: Non-seasonally adjusted data shown. Holiday season sectors defined by BLS here: https://www.bls.gov/opub/btn/archive/holiday-season-hiring-in-retail-trade.pdf See important disclaimers at the bottom of the page.
-
Passive investors only see the overall movements in the index, but many things are going on inside the S&P500, IG, and HY indexes, which active investors are paying attention to. With inflation being a multi-year problem and the Fed raising rates, the tech sector continues to underperform, and the continued divergence in performance between growth and value in the S&P500 and credit indexes is very significant. In fact, the spread between the best and the worst performing sector of the S&P500 is currently at the highest level on record, see chart below.
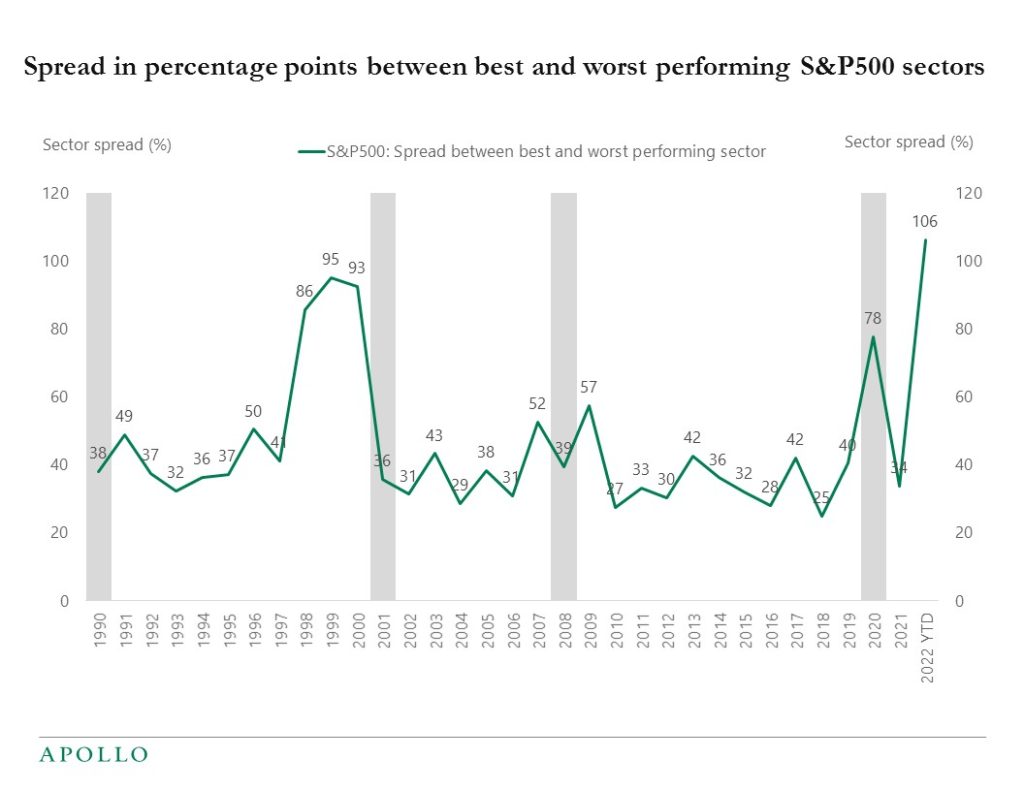
Source: Bloomberg, Bureau, Apollo Chief Economist. Note: Spread = Best minus worst performing sector in the S&P500;. Data as of 11/7/2022 See important disclaimers at the bottom of the page.
-
Layoffs in tech are being offset by hiring in Health care, Leisure and hospitality, Manufacturing, and the Government, see the first chart below.
The second chart shows that job cut announcements have increased recently but remain at pre-pandemic levels.
The bottom line is that the Fed wants to slow down hiring, and they will eventually succeed, but the labor market is not slowing down fast enough.
Once the labor market starts slowing, then the Fed will pivot. But the slowdown in the economy could be so fast that the pivot would be associated with a sell-off in credit and equities.
In other words, the pre-condition for a Fed pivot is a weaker economy. But a weaker economy means lower corporate earnings. Which means that a Fed pivot could result in a stock market sell-off and wider credit spreads.
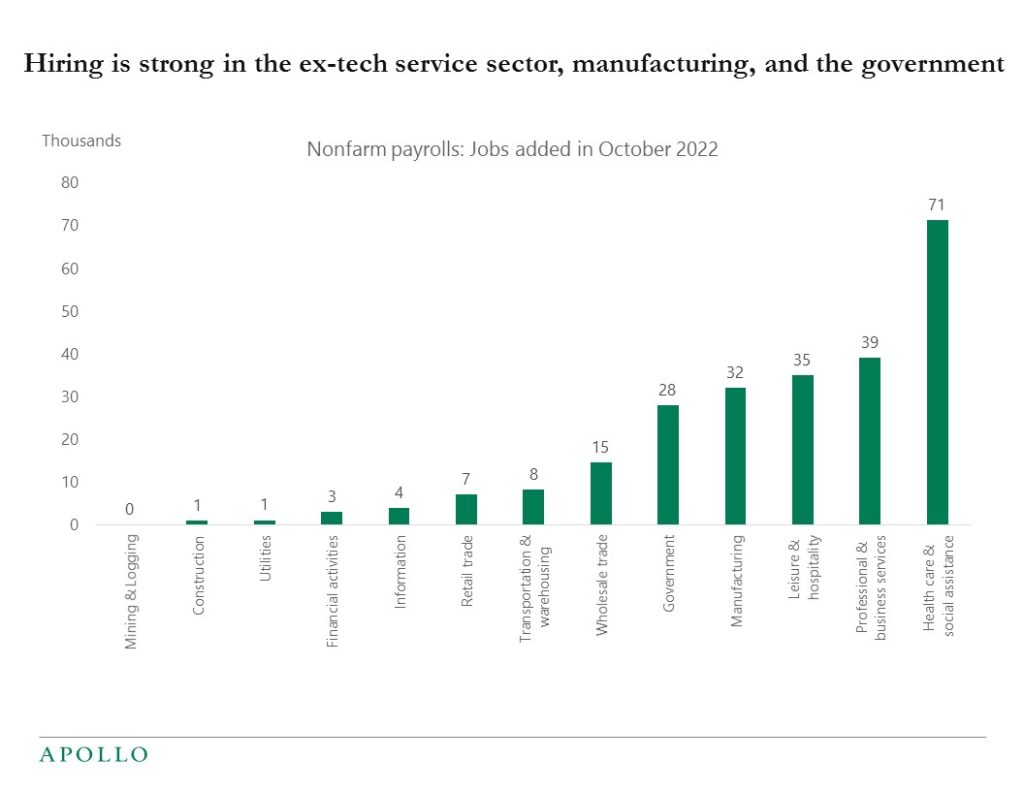
Source: BLS, Haver, Apollo Chief Economist 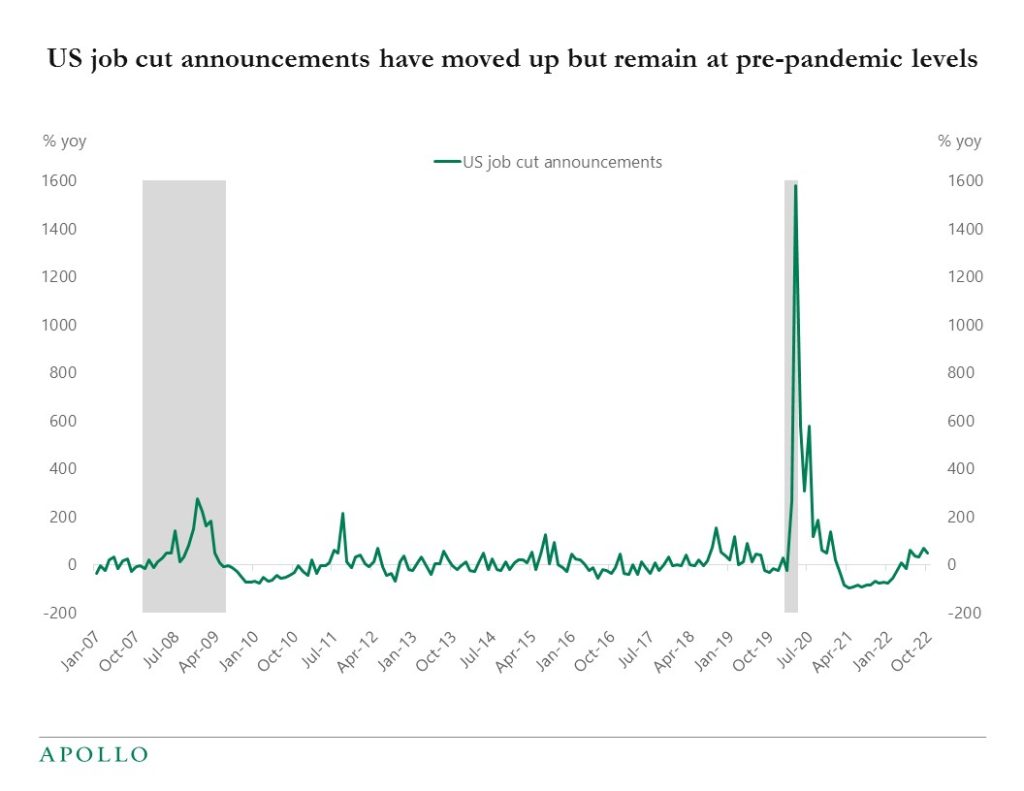
Source: Challenger, Gray and Christmas Inc, Bloomberg, Apollo Chief Economist See important disclaimers at the bottom of the page.
-
Manufacturers of electronics and computers are building factories in the US at the fastest pace on record, see chart below. Onshoring is in full swing and will likely continue for the next decade.
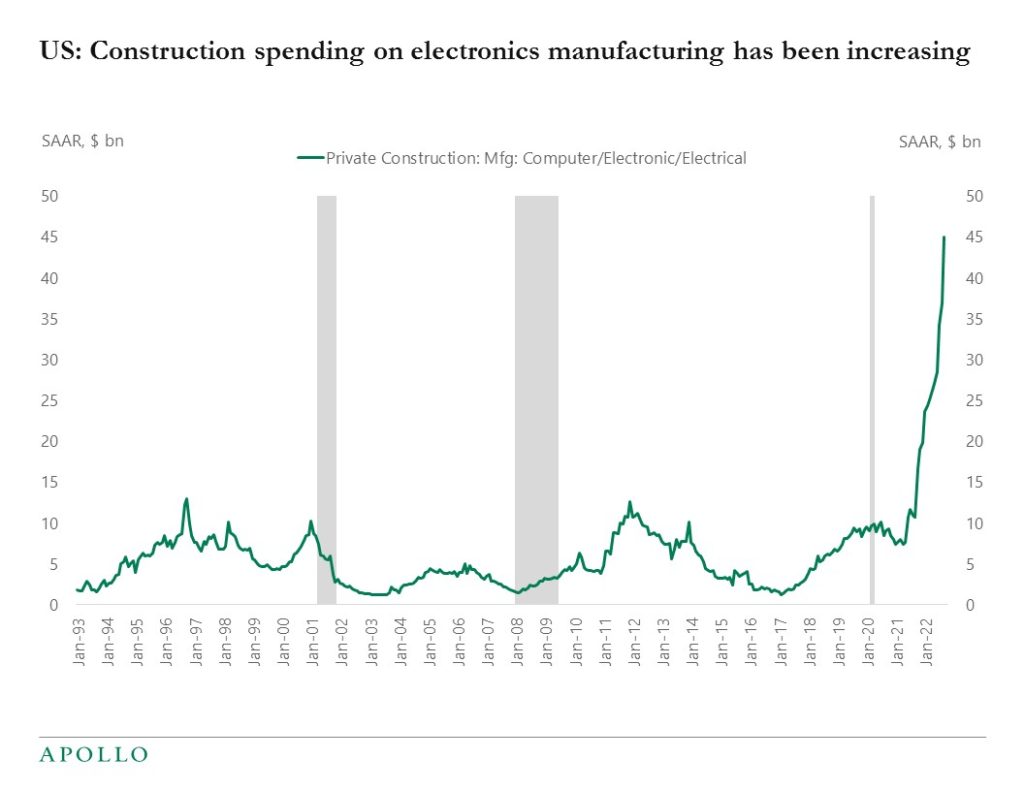
Source: Census Bureau, Apollo Chief Economist See important disclaimers at the bottom of the page.
This presentation may not be distributed, transmitted or otherwise communicated to others in whole or in part without the express consent of Apollo Global Management, Inc. (together with its subsidiaries, “Apollo”).
Apollo makes no representation or warranty, expressed or implied, with respect to the accuracy, reasonableness, or completeness of any of the statements made during this presentation, including, but not limited to, statements obtained from third parties. Opinions, estimates and projections constitute the current judgment of the speaker as of the date indicated. They do not necessarily reflect the views and opinions of Apollo and are subject to change at any time without notice. Apollo does not have any responsibility to update this presentation to account for such changes. There can be no assurance that any trends discussed during this presentation will continue.
Statements made throughout this presentation are not intended to provide, and should not be relied upon for, accounting, legal or tax advice and do not constitute an investment recommendation or investment advice. Investors should make an independent investigation of the information discussed during this presentation, including consulting their tax, legal, accounting or other advisors about such information. Apollo does not act for you and is not responsible for providing you with the protections afforded to its clients. This presentation does not constitute an offer to sell, or the solicitation of an offer to buy, any security, product or service, including interest in any investment product or fund or account managed or advised by Apollo.
Certain statements made throughout this presentation may be “forward-looking” in nature. Due to various risks and uncertainties, actual events or results may differ materially from those reflected or contemplated in such forward-looking information. As such, undue reliance should not be placed on such statements. Forward-looking statements may be identified by the use of terminology including, but not limited to, “may”, “will”, “should”, “expect”, “anticipate”, “target”, “project”, “estimate”, “intend”, “continue” or “believe” or the negatives thereof or other variations thereon or comparable terminology.


