Want it delivered daily to your inbox?
-
The latest data from the United Nations shows that population growth is now negative in China, see chart below.
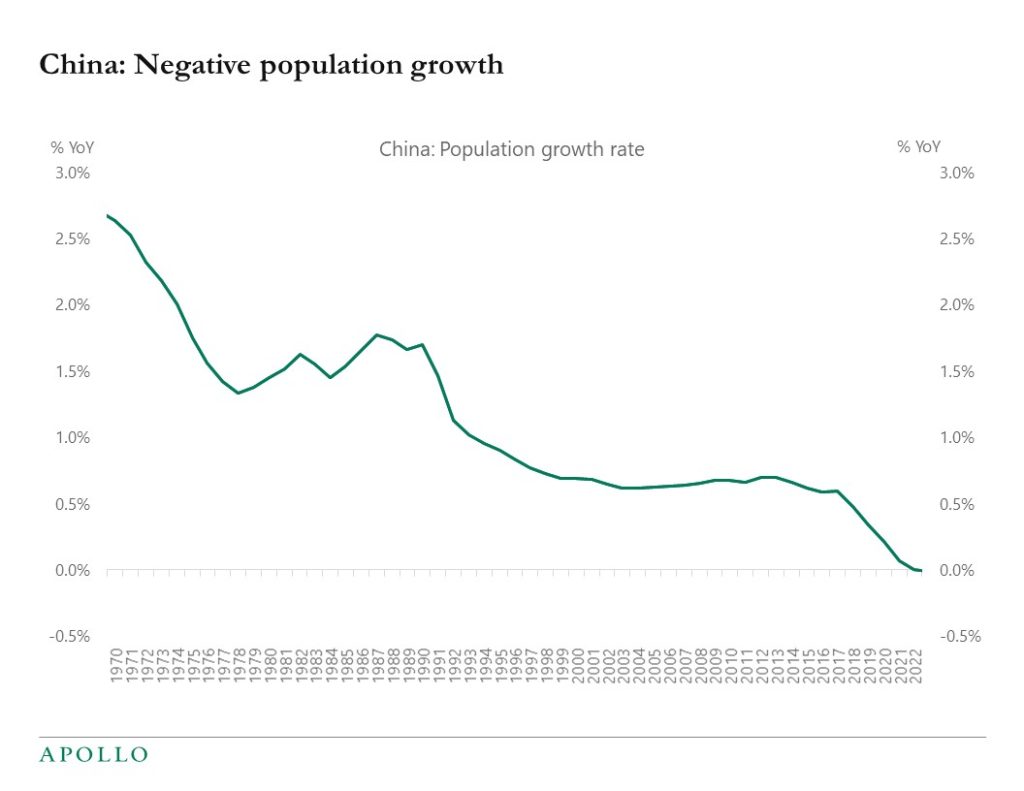
Source: UN, Haver analytics, Apollo Chief Economist See important disclaimers at the bottom of the page.
-
Euro area inflation in October came in at 10.7%, much higher than the ECB’s 2% inflation target. The sub-components showed a 42% increase in energy prices and a 4% increase in service prices.
With European energy prices coming down significantly at the moment, energy will soon turn into a significant drag on European inflation, see the first chart below.
Combined with Germany likely having a recession in 2023, European inflation will soon come down very quickly, see the second chart.
The bottom line is that inflation in Europe is mainly energy. Whereas in the US, inflation is much more broad-based.
As a result, the ECB will soon turn even more dovish. And the Fed will have to remain hawkish.
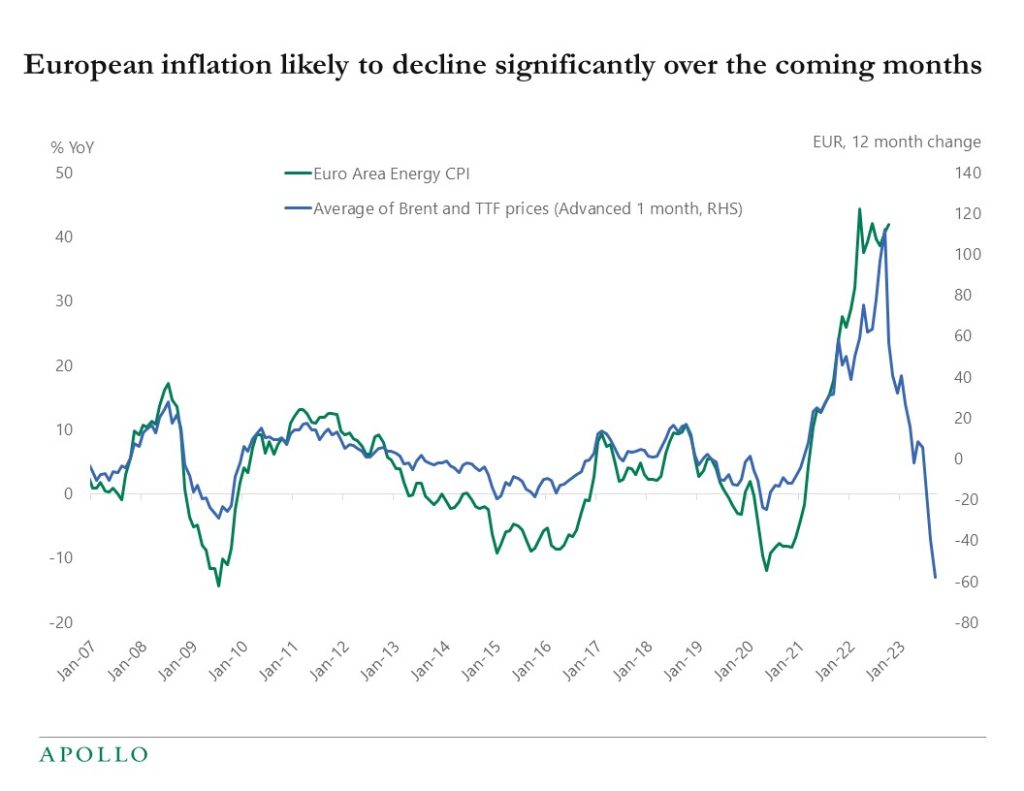
Source: Bloomberg, Apollo Chief Economist. Assuming TTF and Brent prices constant as of 31st October 2022. 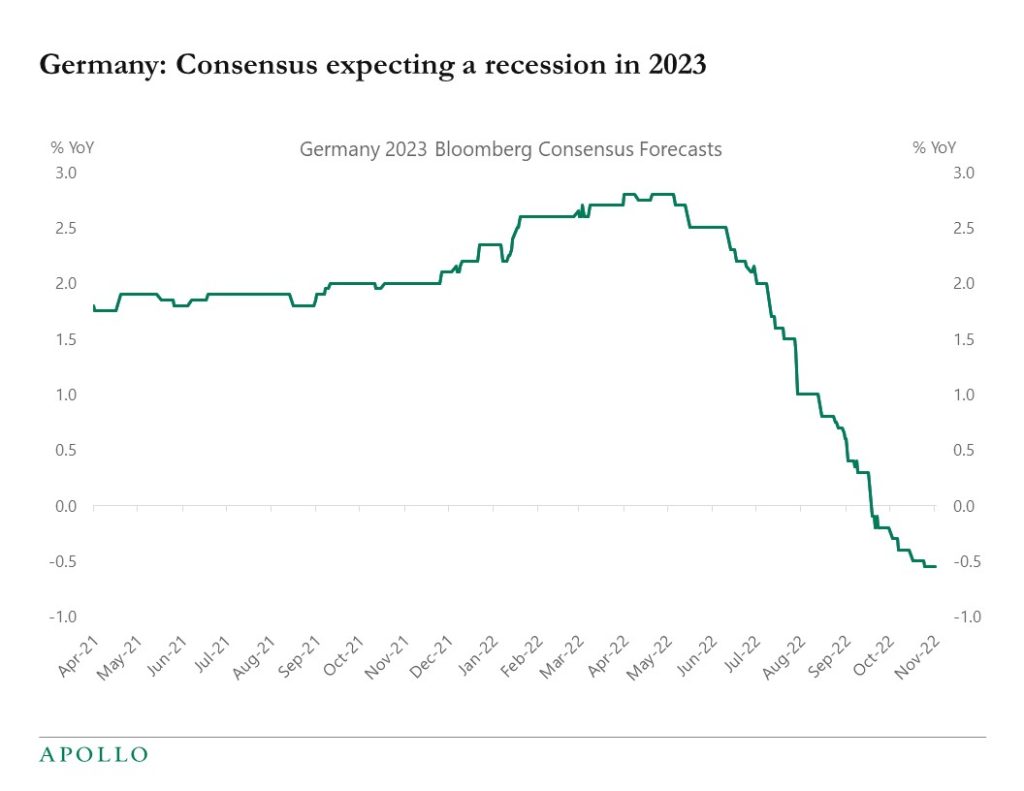
Source: Bloomberg, Apollo Chief Economist See important disclaimers at the bottom of the page.
-
The consensus now sees a 60% chance of a recession in the US over the next 12 months. For Europe and the UK the probability is 80%, see chart below.
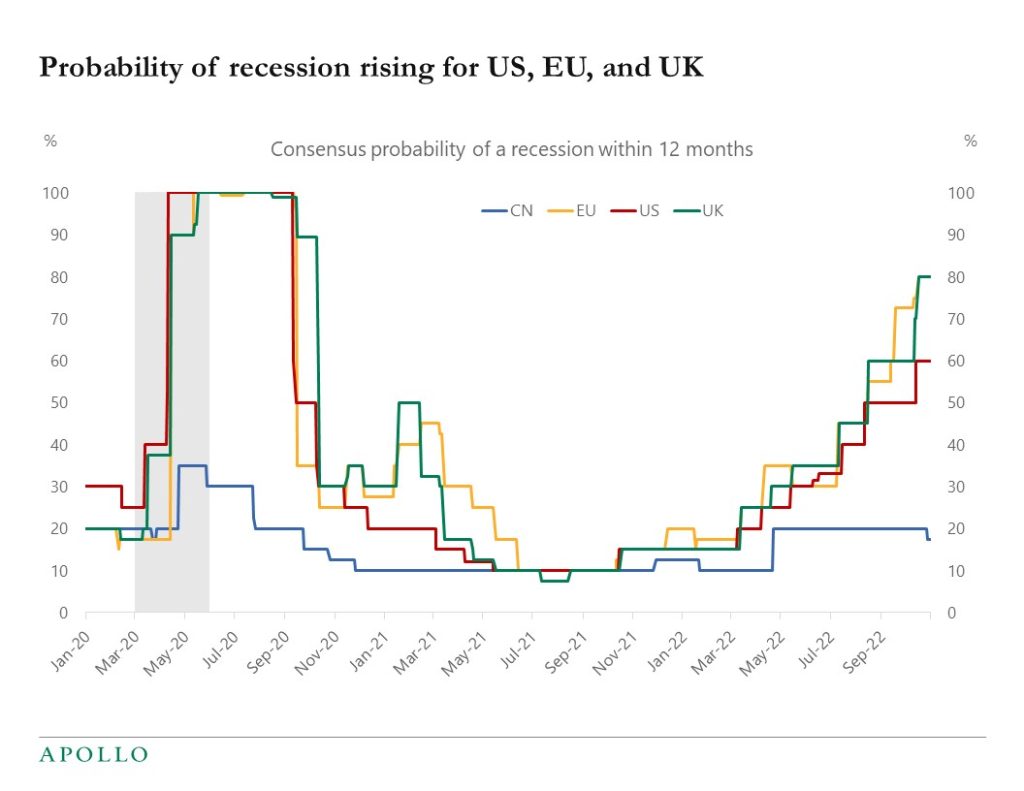
Source: Bloomberg, Apollo Chief Economist See important disclaimers at the bottom of the page.
-
The price of candy and chewing gum has increased 13% over the past year, see chart below.
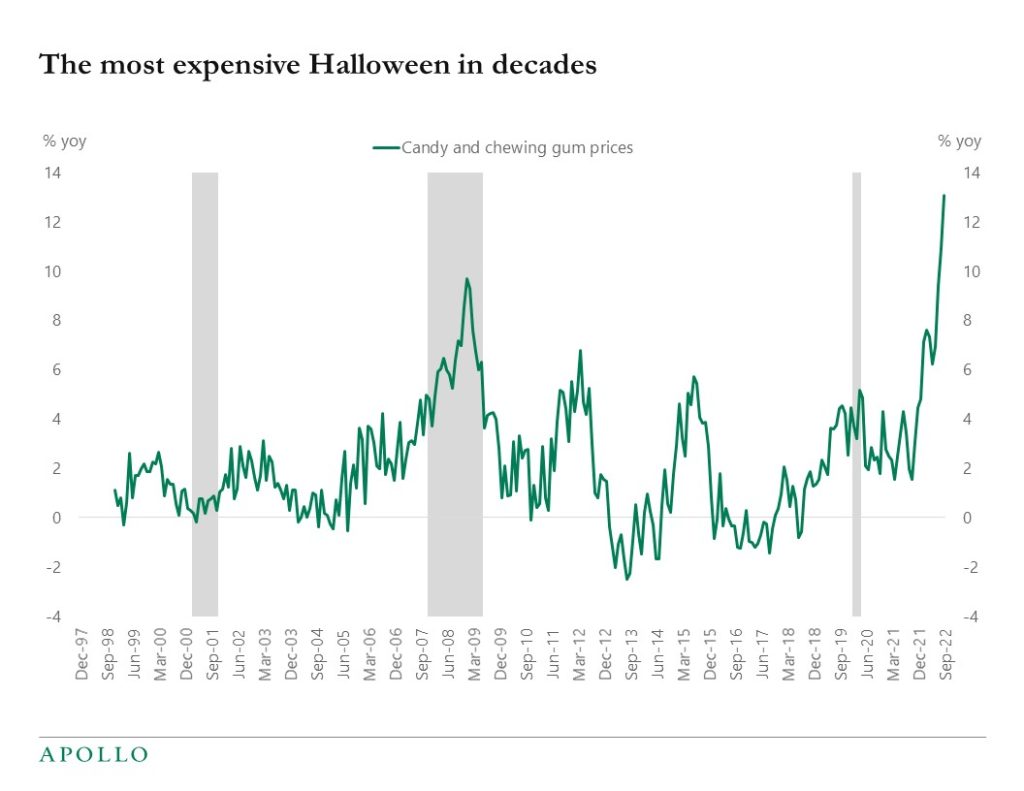
Source: BLS, Bloomberg, Apollo Chief Economist See important disclaimers at the bottom of the page.
-
BoE: How broad-based is the increase in UK inflation?
https://bankunderground.co.uk/2022/10/27/how-broad-based-is-the-increase-in-uk-inflation/Fed: Is China Running Out of Policy Space to Navigate Future Economic Challenges?
https://libertystreeteconomics.newyorkfed.org/2022/09/is-china-running-out-of-policy-space-to-navigate-future-economic-challenges/FSB: Liquidity in Core Government Bond Markets
https://www.fsb.org/wp-content/uploads/P201022.pdfSee important disclaimers at the bottom of the page.
-
Weekly data shows that hotel demand is still very strong, see chart below. Our collection of daily and weekly indicators for the US economy is available here.
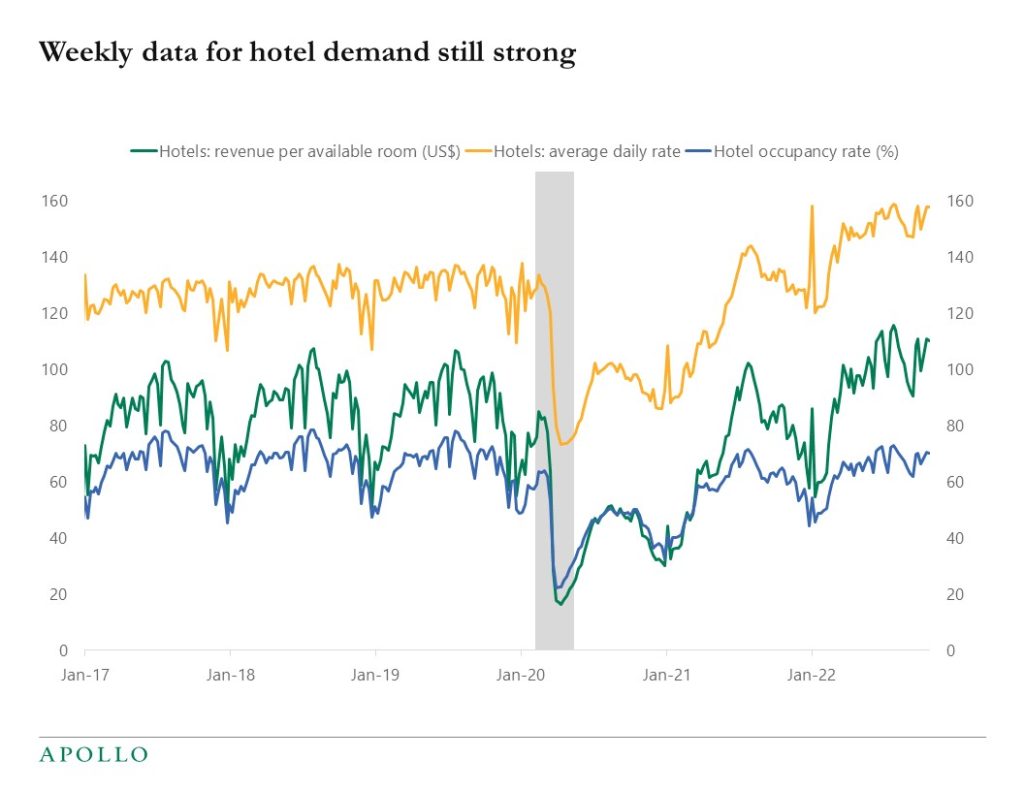
Source: STR, Haver Analytics, Apollo Chief Economist See important disclaimers at the bottom of the page.
-
The FOMC’s inflation target is 2%, and 83% of the components in the CPI basket are growing faster than 5%. Inflation is, unfortunately very broad-based, see chart below.
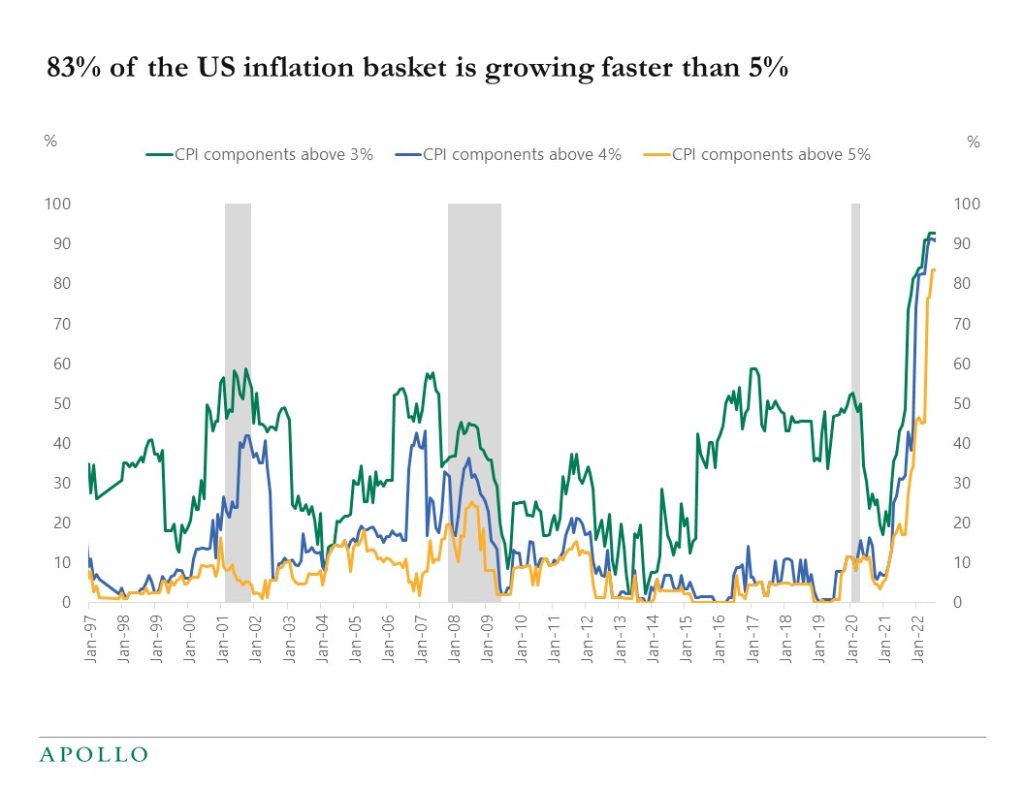
Note: Year-over-year growth used. Source: BLS, Haver, Apollo Chief Economist See important disclaimers at the bottom of the page.
-
Firms in Germany are reducing their consumption of natural gas. The reduction is driven by slowing economic growth in Europe and substitution toward other sources of energy.
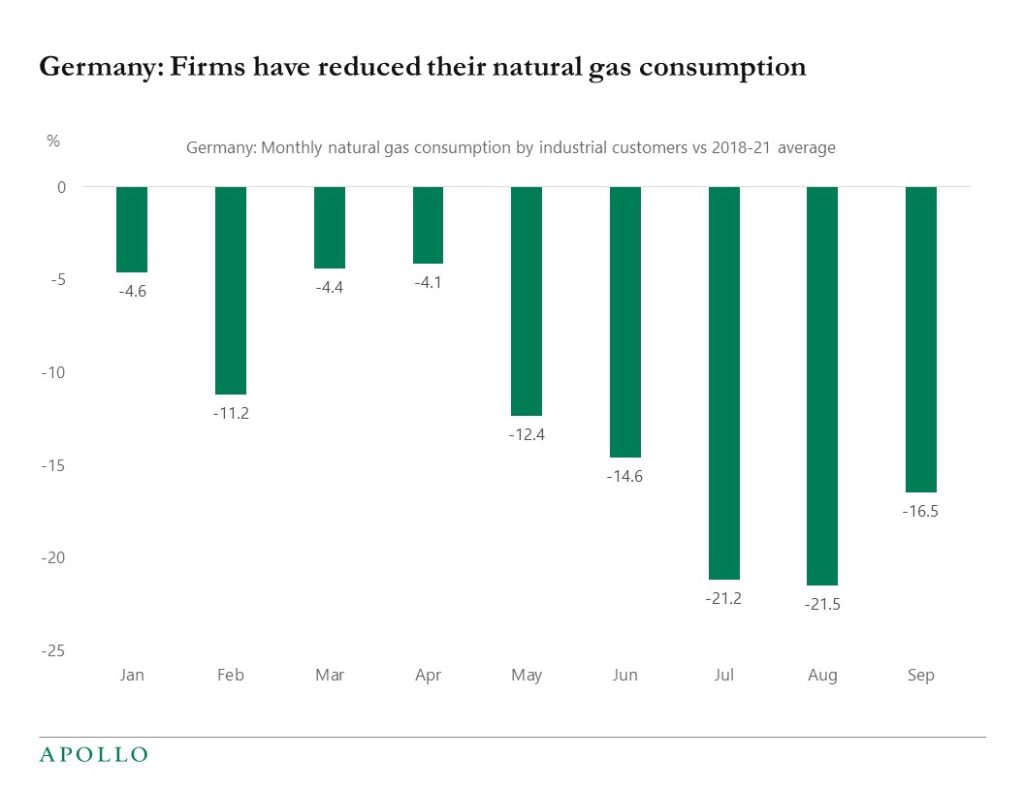
Source: https://www.bundesnetzagentur.de/, Apollo Chief Economist See important disclaimers at the bottom of the page.
-
The CPI index used by the Fed and financial markets captures the spending habits of about 80 percent of the population of the United States. But spending patterns vary across different age groups. For example, older generations spend more on services such as housing and medical care, and less on goods including food, beverages, and apparel.
To better understand these differences in spending patterns, the BLS calculates a CPI index looking at inflation for people age 62 and above. It shows that for older generations, inflation has for decades been higher because of higher inflation in services. But during the pandemic, when inflation on goods was very high, inflation for people age 62 and above has been relatively lower. With goods inflation coming down and service sector inflation still rising, we should expect more convergence between the two inflation measures going forward, a process which has already started in the chart below.
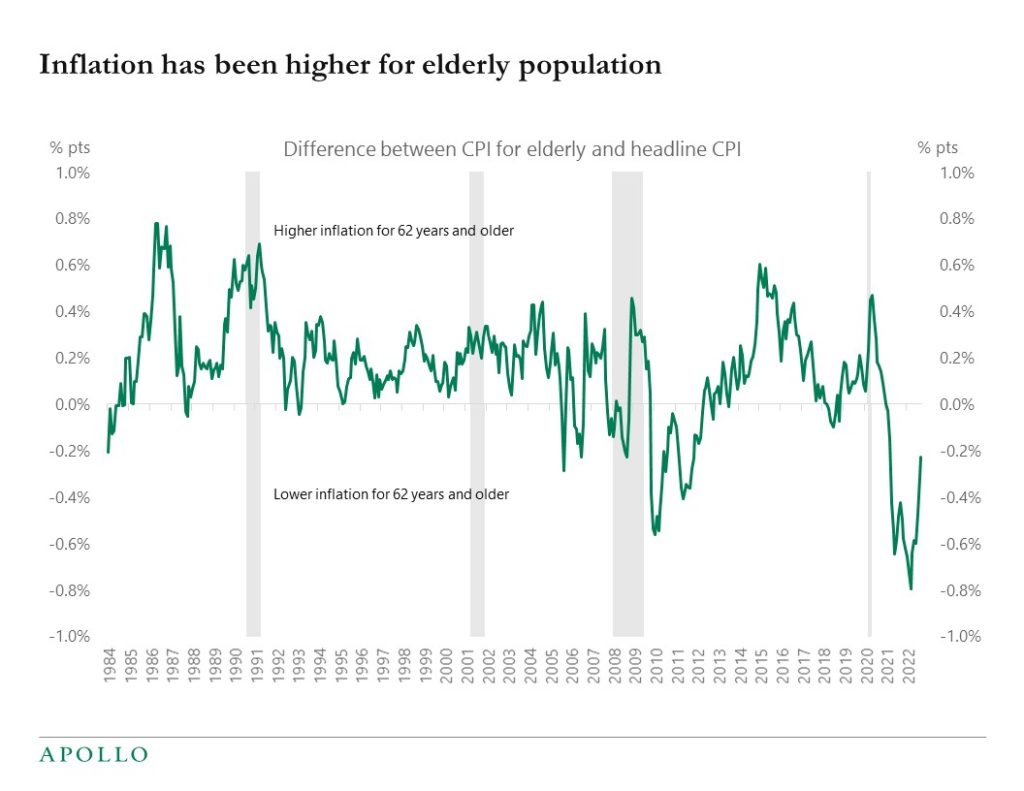
Source: BLS, Haver Analytics, Apollo Chief Economist. Note: It is calculated as the difference between CPI-E which is the CPI for 62 years and older and CPI-U which is for the total basket. Elderly spend more on housing, medical care and less on food & beverages, apparel, transportation, education and communication. See important disclaimers at the bottom of the page.
-
Inflation will be coming down over the coming quarters. This is what the Fed is predicting, that is what the consensus is expecting, and that is what we are predicting. The problem is that this has been the forecast ever since inflation started going up in April 2021, see chart below. Given how systematically wrong inflation forecasts have been over the past 18 months, there are good reasons to be cautious about the current forecast.
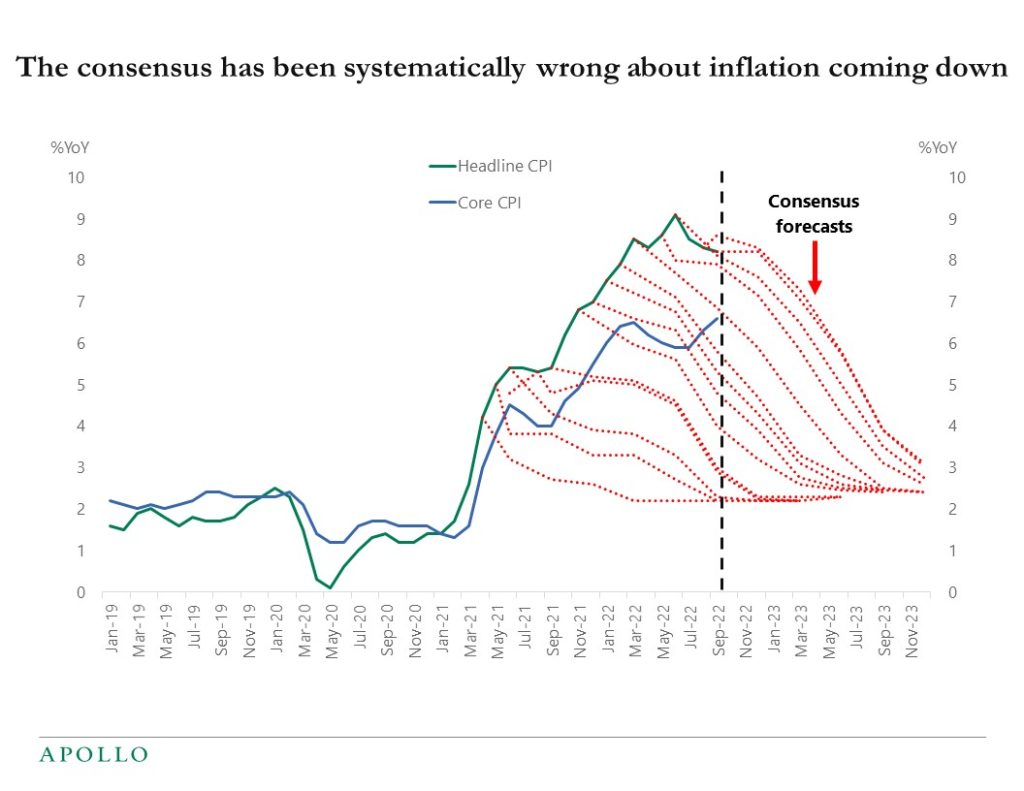
Source: Cleveland Fed, Bloomberg, Haver Analytics, Apollo Chief Economist See important disclaimers at the bottom of the page.
This presentation may not be distributed, transmitted or otherwise communicated to others in whole or in part without the express consent of Apollo Global Management, Inc. (together with its subsidiaries, “Apollo”).
Apollo makes no representation or warranty, expressed or implied, with respect to the accuracy, reasonableness, or completeness of any of the statements made during this presentation, including, but not limited to, statements obtained from third parties. Opinions, estimates and projections constitute the current judgment of the speaker as of the date indicated. They do not necessarily reflect the views and opinions of Apollo and are subject to change at any time without notice. Apollo does not have any responsibility to update this presentation to account for such changes. There can be no assurance that any trends discussed during this presentation will continue.
Statements made throughout this presentation are not intended to provide, and should not be relied upon for, accounting, legal or tax advice and do not constitute an investment recommendation or investment advice. Investors should make an independent investigation of the information discussed during this presentation, including consulting their tax, legal, accounting or other advisors about such information. Apollo does not act for you and is not responsible for providing you with the protections afforded to its clients. This presentation does not constitute an offer to sell, or the solicitation of an offer to buy, any security, product or service, including interest in any investment product or fund or account managed or advised by Apollo.
Certain statements made throughout this presentation may be “forward-looking” in nature. Due to various risks and uncertainties, actual events or results may differ materially from those reflected or contemplated in such forward-looking information. As such, undue reliance should not be placed on such statements. Forward-looking statements may be identified by the use of terminology including, but not limited to, “may”, “will”, “should”, “expect”, “anticipate”, “target”, “project”, “estimate”, “intend”, “continue” or “believe” or the negatives thereof or other variations thereon or comparable terminology.


