Every Saturday going forward, we will provide an updated chart book with daily and weekly indicators for the US economy.
Current status as of Saturday, July 20:
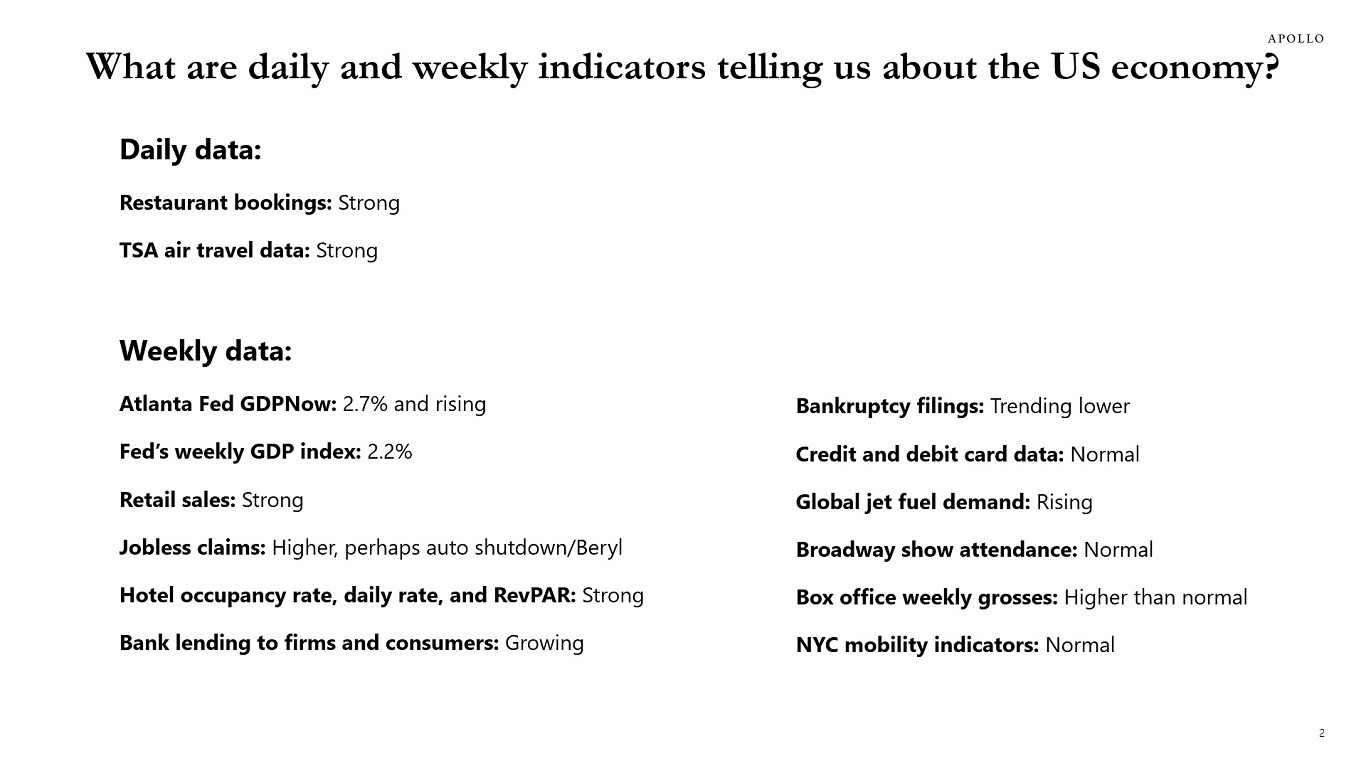
• Daily data shows restaurant bookings remain strong.
• Daily data shows TSA air travel remains strong.
• The Fed’s weekly GDP estimate is 2.2%.
• Atlanta Fed GDPNow is 2.7% and rising.
• Weekly same-store retail sales are strong.
• Jobless claims are modestly higher, perhaps because of auto plant shutdowns and Hurricane Beryl.
• Weekly data for hotel occupancy rates are strong, daily rates are strong, and RevPAR is strong.
• Weekly data for bank lending to consumers and firms show loan growth is accelerating.
• Weekly data for bankruptcy filings are trending down.
• Weekly credit and debit card data show rising loan growth.
• Weekly data for global jet fuel demand is rising.
• Weekly data for Broadway show attendance is normal.
• Weekly data for box office grosses is higher than normal.
• Weekly data shows NYC mobility indicators are normal.
The bottom line is that daily and weekly data do not show any signs of a drop-off in economic activity. Instead, the data shows ongoing steady growth around potential, similar to what we have seen over the past year. If the Fed starts cutting rates in September, then stock prices will rise further, credit spreads will tighten, and growth and inflation will start to reaccelerate.
Some sentiment indicators are weaker, including consumer confidence and long-term inflation expectations, but the list above is all hard data that feeds directly into GDP, employment, and inflation.
Let us know if there is any daily or weekly data that you think we are missing, and we will add it to the chart books.


