


Want it delivered daily to your inbox?
-
The slowdown in immigration growth in recent years has implications for the potential growth rate of the US economy and it is contributing to the ongoing tightness in the labor market, see chart below.
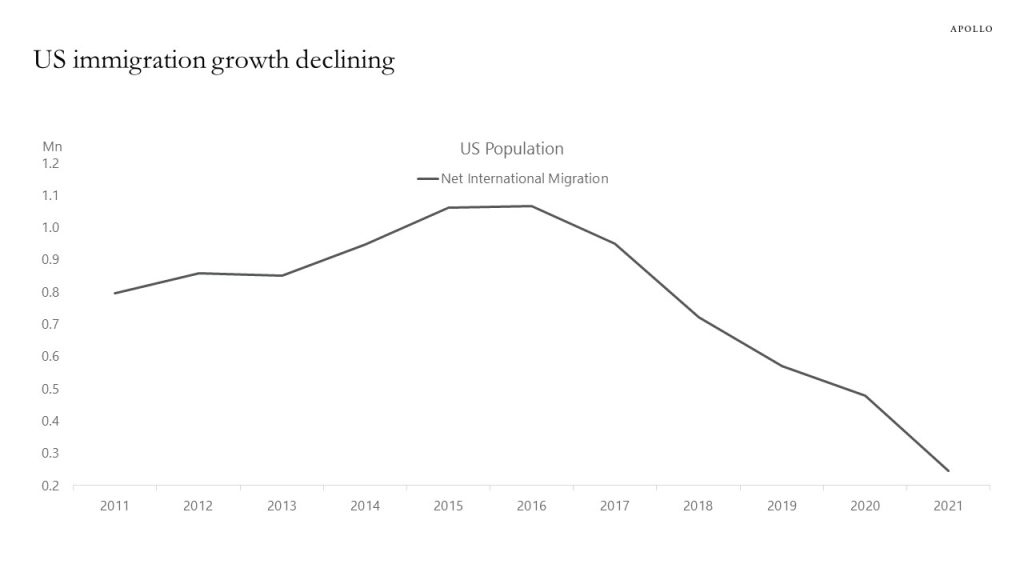
Source: Census Bureau, Apollo Chief Economist. NoteNet international migration for the United States includes the international migration of both native and foreign-born populations. Specifically, it includes: (a) the net international migration of the foreign born, (b) the net migration between the United States and Puerto Rico (c) the net migration of natives to and from the United States, and (d) the net movement of the Armed Forces population between the United States and overseas See important disclaimers at the bottom of the page.
-
Delinquency rates on auto loans and credit cards are starting to move higher, in particular in lower income zip-codes (as defined by the Fed), see charts below.
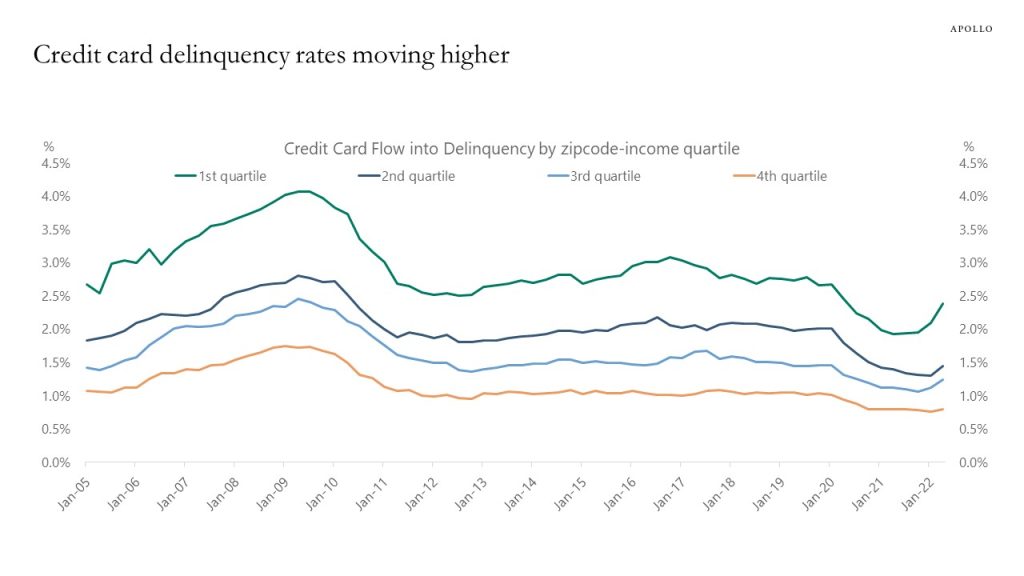
Source: New York Fed Consumer Credit Panel / Equifax; IRS SOI, Apollo Chief Economist 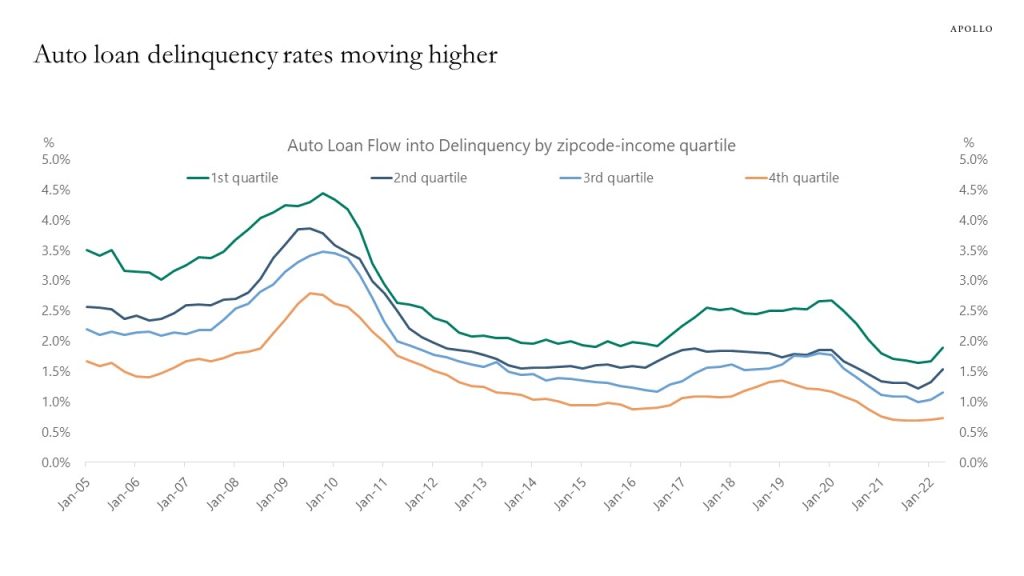
Source: New York Fed Consumer Credit Panel / Equifax; IRS SOI, Apollo Chief Economist See important disclaimers at the bottom of the page.
-
The consensus sees a 90% probability of a recession in the UK and 80% in Europe, and 65% in the US, which continues to point to lower rates in the long end of the curve in 2023.
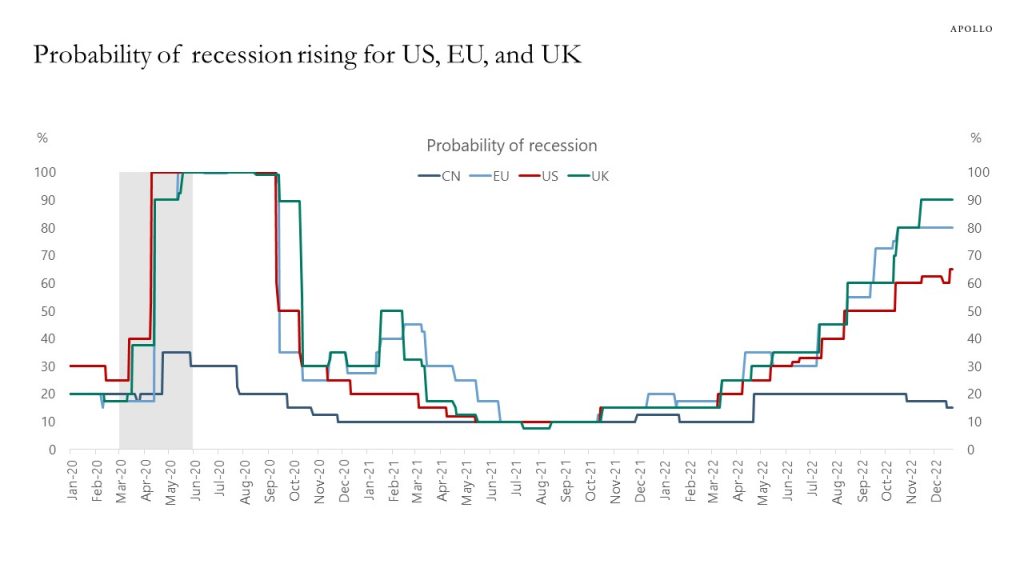
Source: Bloomberg, Apollo Chief Economist See important disclaimers at the bottom of the page.
-
Fed hikes are cooling down the economy and the interest rate-sensitive components of GDP are slowing down (housing, autos, and capex spending), see chart below.
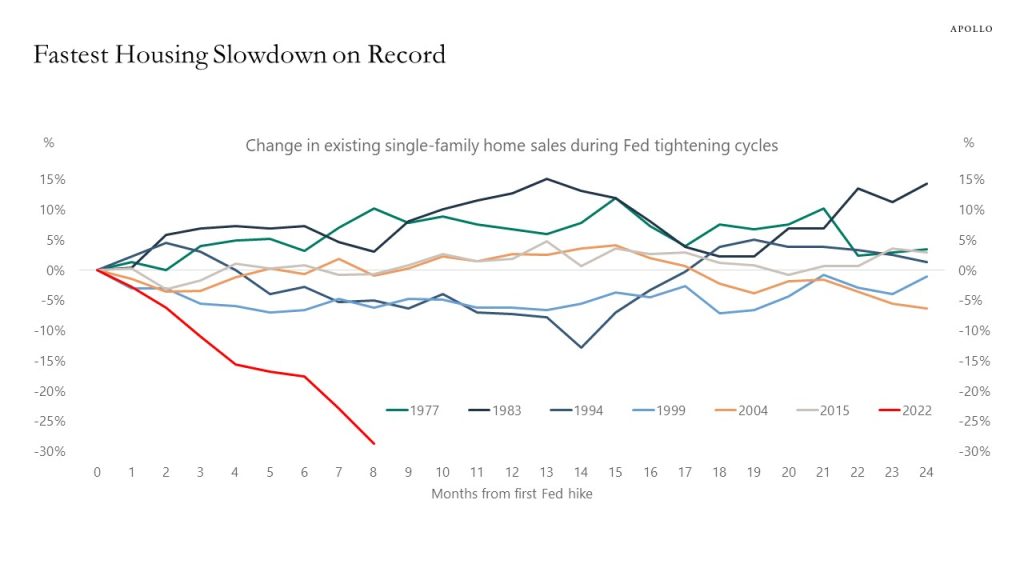
Source: NAR, Haver Analytics, Apollo Chief Economist See important disclaimers at the bottom of the page.
-
If inflation continues to decline and it becomes clear that we will only get a mild recession, then there is a lot of cash on the sidelines available to be invested in credit markets and equity markets in 2023, see chart below.
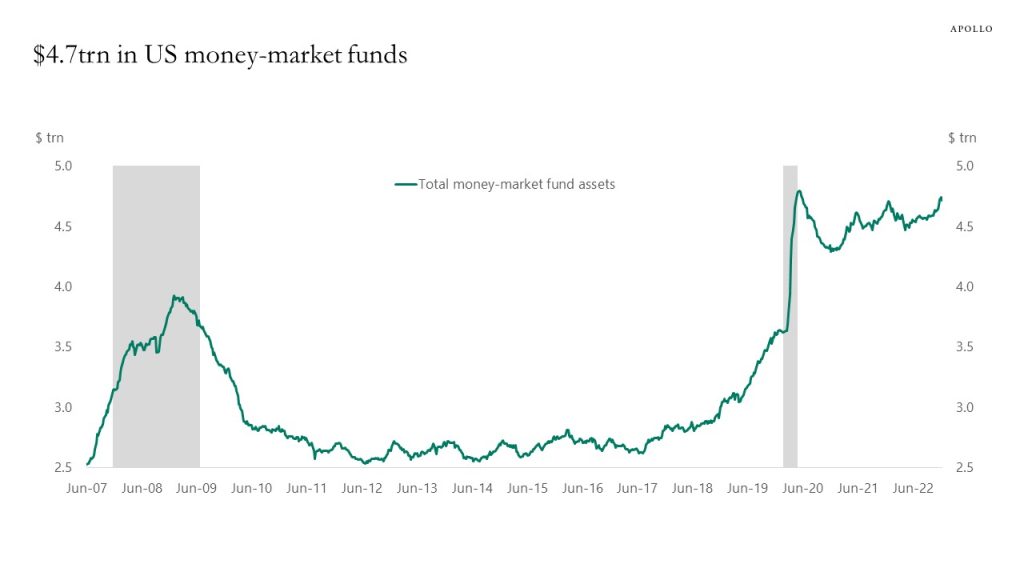
Source: Bloomberg, Apollo Chief Economist
See important disclaimers at the bottom of the page.
-
This new Fed working paper finds that the monetary policy transmission mechanism has changed in recent years, and the peak impact on the economy now comes after 12 months versus previously 18 months. The argument is that monetary policy no longer only works through the Fed funds rate but also through forward guidance and balance sheet policy.
Have Lags in Monetary Policy Transmission Shortened?
https://www.kansascityfed.org/Economic%20Bulletin/documents/9299/EconomicBulletin22DohFoerster1221.pdfSee important disclaimers at the bottom of the page.
-
Last week, the Fed published a new working paper calculating a new measure of rent inflation using only newly signed leases, and it shows that housing inflation has rolled over, see chart below. As Fed Chair Powell has pointed out, we should also expect to see the same profile in the housing components of the CPI.
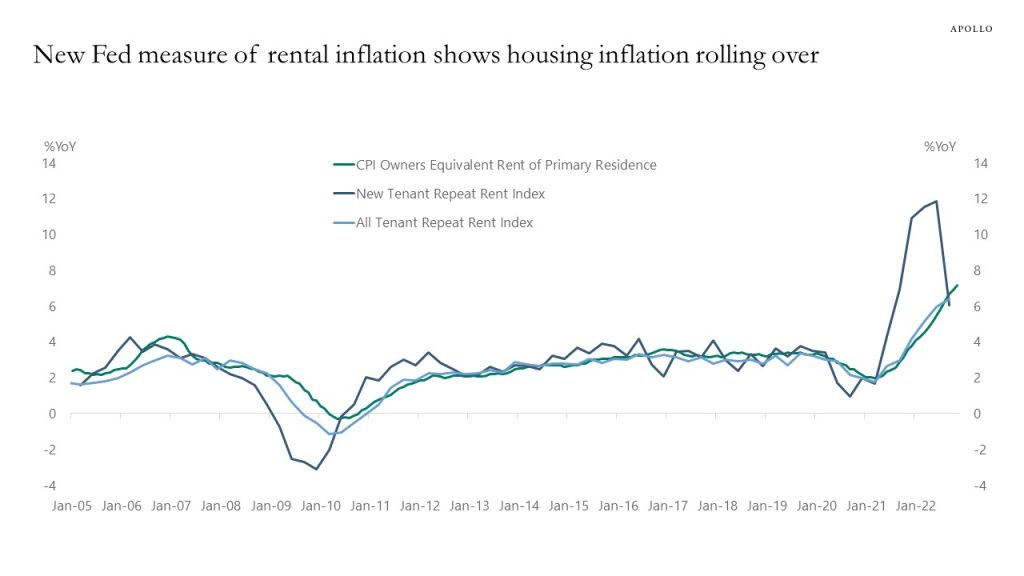
Source: Cleveland Fed, BLS, Bloomberg, Apollo Chief Economist See important disclaimers at the bottom of the page.
-
US retail gas prices continue to decline and are now lower than before Russia invaded Ukraine, driven by slowing global growth and the release from the Strategic Petroleum Reserve. The main upside risk to global growth and inflation going into 2023 is China’s reopening, which could lift oil prices and complicate the Fed’s efforts at getting inflation back to 2%.
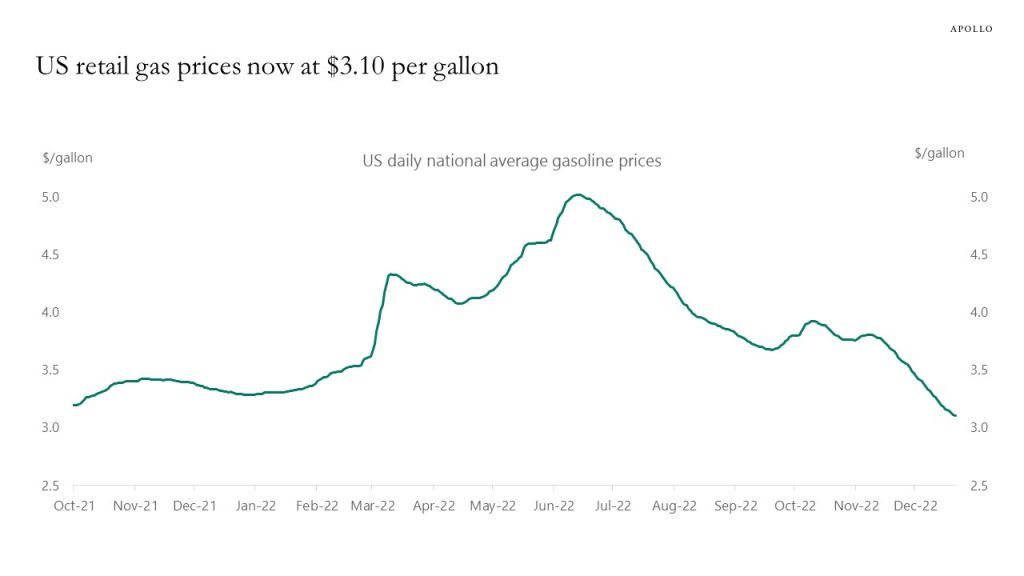
Source: Bloomberg, Apollo Chief Economist See important disclaimers at the bottom of the page.
-
From 2009 to 2022 inflation was low, rates were low, capital markets were open, and the optimal strategy for investors was to hunt yield.
In 2022 inflation became a problem, and the Fed reacted and raised rates, and capital markets became more challenging, and investors sold credit and equities and put money into rising risk-free rates.
Because of cumulative Fed action, inflation is coming down in 2023 and rates will be coming down and the hunt for yield will be coming back and capital markets will reopen.
The bottom line is that the ongoing covid-driven inflation shock has lasted longer than the Fed and the market initially expected, but the Fed’s commitment to low inflation is why the inflation problem in 2022 will turn out to be transitory. Investors should appreciate that we in 2023 are transitioning back to low inflation again, and the optimal asset allocation strategy in 2023 is likely to be the opposite of what worked in 2022. I discuss this in more detail in our 2023 outlook report and 45-minute video here on ApolloAcademy.com.
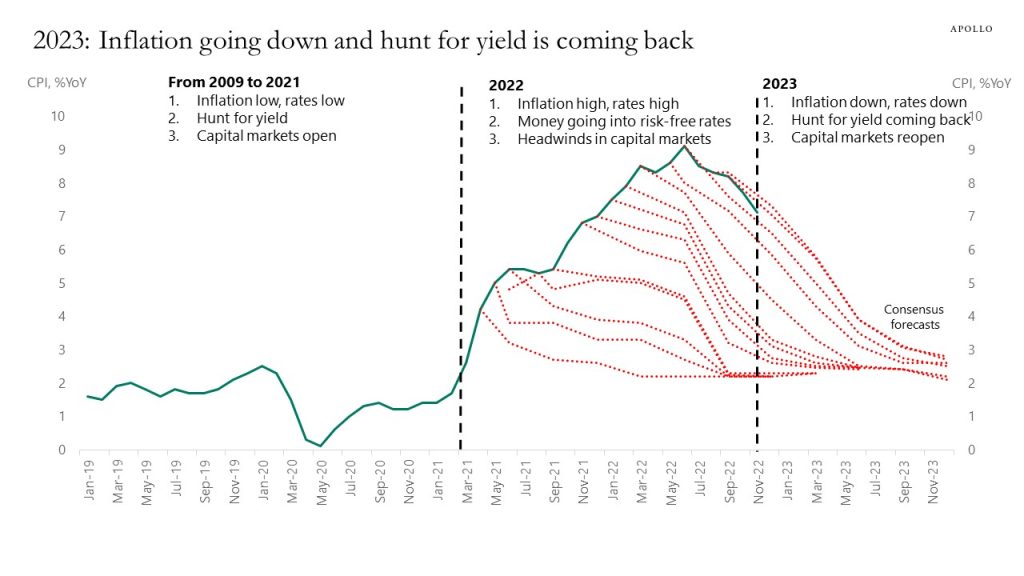
Source: Bloomberg, Haver Analytics, Apollo Chief Economist See important disclaimers at the bottom of the page.
-
Government bond yields in Europe have over the past week started to decouple from US Treasury yields, driven by rising government spending in Europe, high inflation in Europe, and ECB QT.
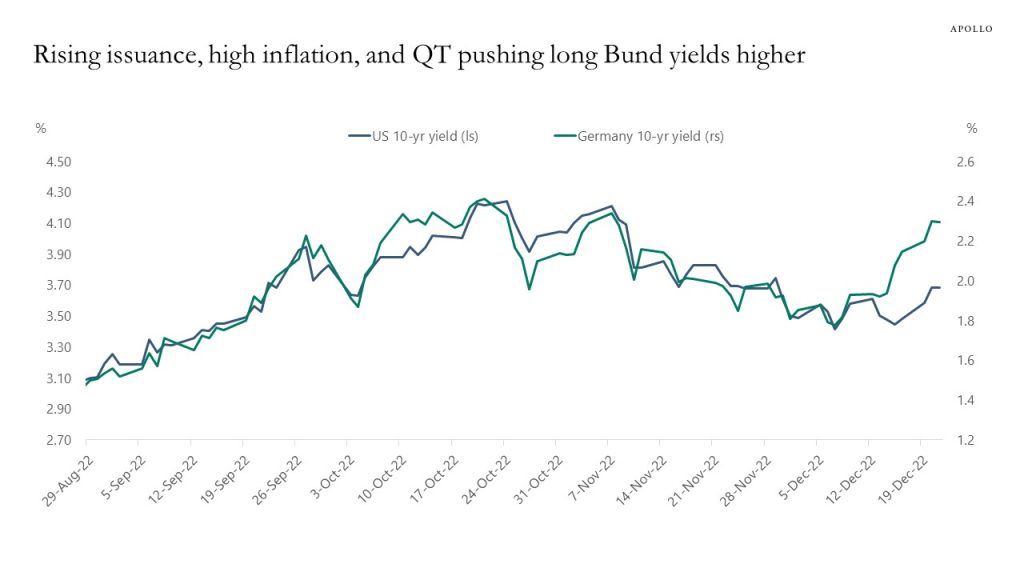
Source: Bloomberg, Apollo Chief Economist See important disclaimers at the bottom of the page.

This presentation may not be distributed, transmitted or otherwise communicated to others in whole or in part without the express consent of Apollo Global Management, Inc. (together with its subsidiaries, “Apollo”).
Apollo makes no representation or warranty, expressed or implied, with respect to the accuracy, reasonableness, or completeness of any of the statements made during this presentation, including, but not limited to, statements obtained from third parties. Opinions, estimates and projections constitute the current judgment of the speaker as of the date indicated. They do not necessarily reflect the views and opinions of Apollo and are subject to change at any time without notice. Apollo does not have any responsibility to update this presentation to account for such changes. There can be no assurance that any trends discussed during this presentation will continue.
Statements made throughout this presentation are not intended to provide, and should not be relied upon for, accounting, legal or tax advice and do not constitute an investment recommendation or investment advice. Investors should make an independent investigation of the information discussed during this presentation, including consulting their tax, legal, accounting or other advisors about such information. Apollo does not act for you and is not responsible for providing you with the protections afforded to its clients. This presentation does not constitute an offer to sell, or the solicitation of an offer to buy, any security, product or service, including interest in any investment product or fund or account managed or advised by Apollo.
Certain statements made throughout this presentation may be “forward-looking” in nature. Due to various risks and uncertainties, actual events or results may differ materially from those reflected or contemplated in such forward-looking information. As such, undue reliance should not be placed on such statements. Forward-looking statements may be identified by the use of terminology including, but not limited to, “may”, “will”, “should”, “expect”, “anticipate”, “target”, “project”, “estimate”, “intend”, “continue” or “believe” or the negatives thereof or other variations thereon or comparable terminology.