


Want it delivered daily to your inbox?
-
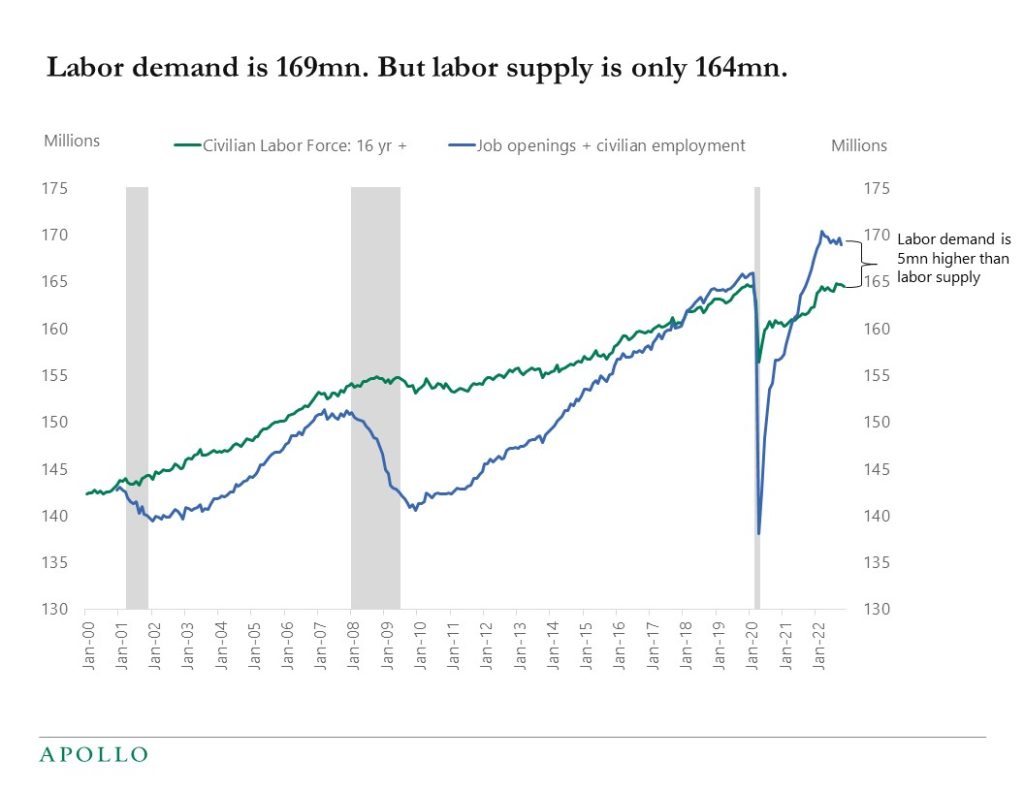
The chart below is the reason why Fed Chair Powell talks so much about the tight labor market. There are 164 million people in the US labor force. And total labor demand is 169 million (defined as total employment plus the total number of job openings). In other words, labor demand is 5 million people higher than labor supply, which is why wage inflation is so strong. The solution to this imbalance is to either increase the labor supply, for example through higher immigration, or to lower labor demand for example through an increase in the unemployment rate, and this is the challenge for the Fed.
Source: BLS, Haver, Apollo Chief Economist See important disclaimers at the bottom of the page.
-
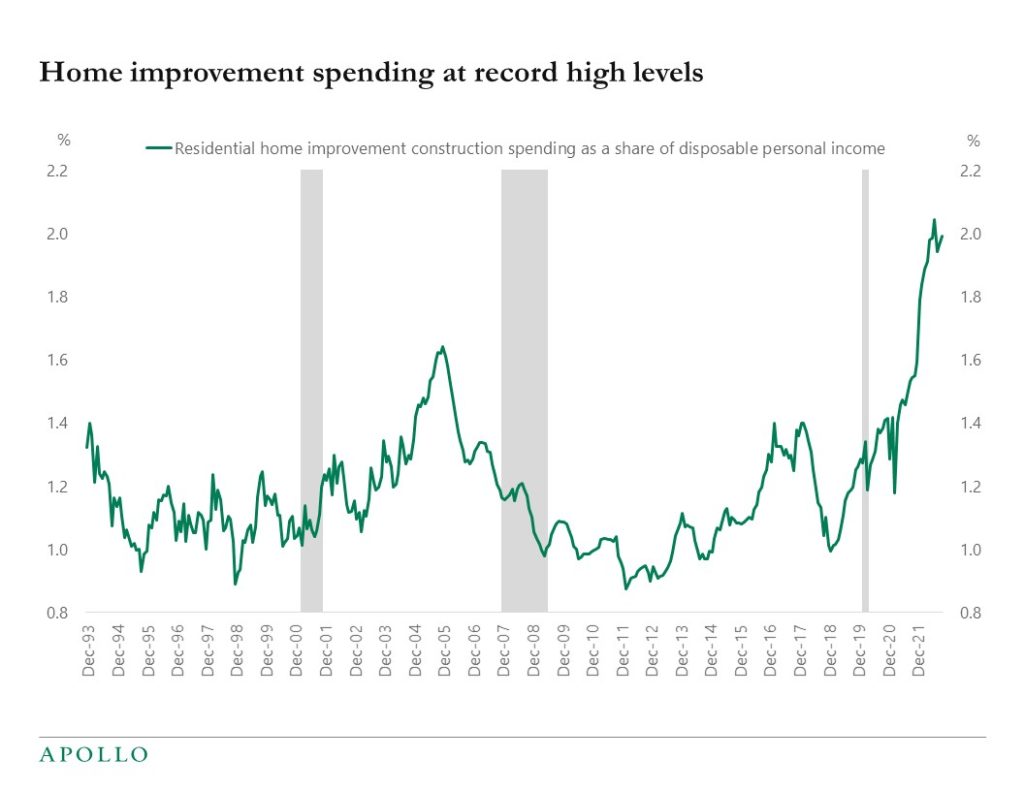
Home improvement spending is currently at the highest level on record, see chart below.
Source: Census Bureau, BEA, Bloomberg, Apollo Chief Economist See important disclaimers at the bottom of the page.
-
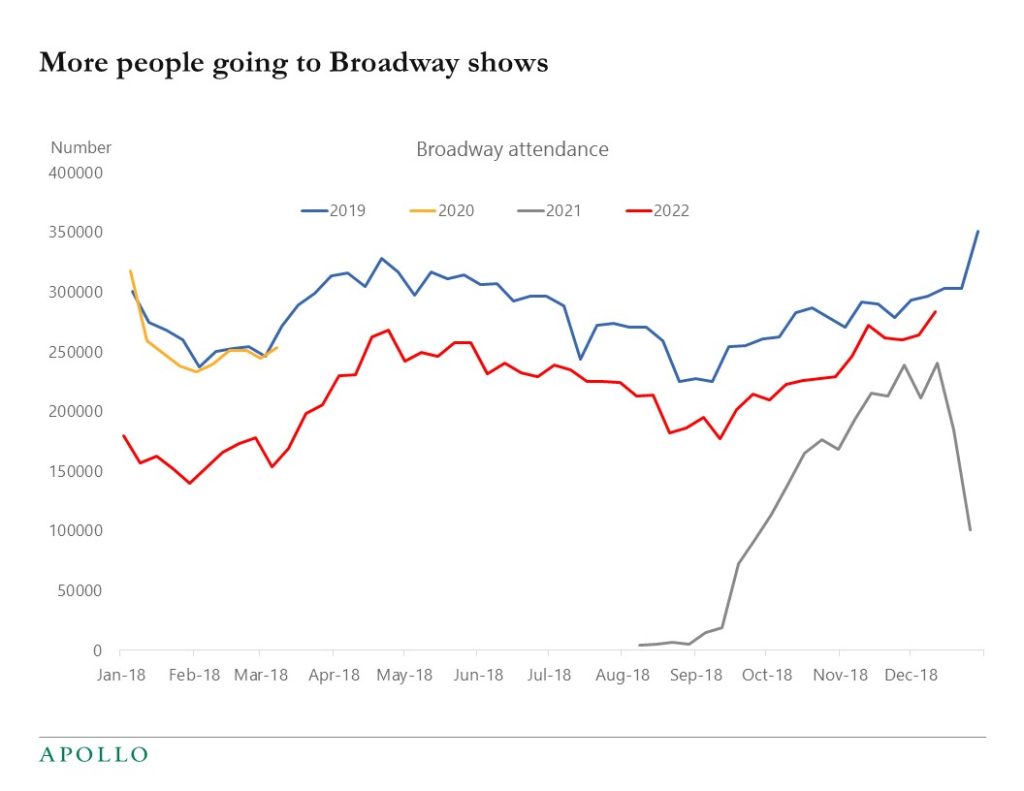
The number of people going to Broadway shows is at pre-pandemic levels and continues to rise, see chart below.
Source: Internet Broadway Database, Apollo Chief Economist See important disclaimers at the bottom of the page.
-
On our ApolloAcademy.com you can now download our 2023 Economic and Capital Markets Outlook, and watch a 45-minute video where I walk through the outlook for public and private markets next year. The video also includes a Q&A section and it was recorded after the Fed’s meeting earlier this week.

See important disclaimers at the bottom of the page.
-
The Fed is not going to increase the inflation target from 2% to, say, 3% or 4%, see also Powell’s response below from the press conference on Wednesday.
GRADY TRIMBLE. Thank you, Mr. Chair. Grady Trimble with Fox Business. You’ve reiterated today and the Committee has reiterated its commitment to that 2% inflation target. I wonder, is there ever a point where you actually reevaluate that target and maybe increase your inflation target if it is stickier than even you think it is?
CHAIR POWELL. That’s just — changing our inflation goal is just something we’re not — we’re not thinking about, and it’s something we’re not going to think about. It’s — we have a 2% inflation goal, and we’ll use our tools to get inflation back to 2%. I think this isn’t the time to be thinking about that. I mean, there may be a longer run project at some point. But that is not where we are at all. The Committee, we’re not considering that. We’re not going to consider that under any circumstances. We’re going to — we’re going to keep our inflation target at 2%. We’re going to use our tools to get inflation back to 2%.
For more, see also the Fed’s official transcript from the press conference here.
See important disclaimers at the bottom of the page.
-
Source: Apollo Chief Economist See important disclaimers at the bottom of the page.
-
The FOMC raised the Fed funds rate to 4.5%, and their forecast is that they will raise rates 75bps in 2023, likely 50bps at their next meeting in February and then 25bps in March and then keep the policy rate flat for the rest of the year, see the first chart. The bottom line for markets is that we are getting closer to the peak in the Fed funds rate, which historically has been associated with a rally in equities and credit, see the second chart.
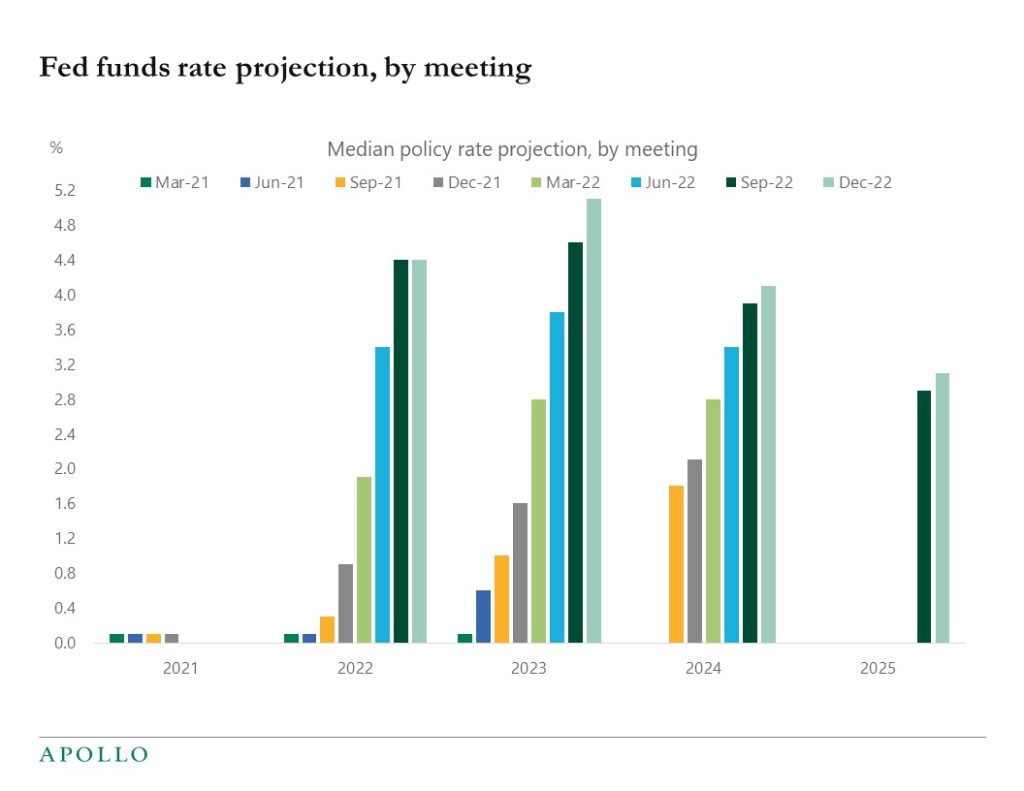
Source: FRB, Apollo Chief Economist 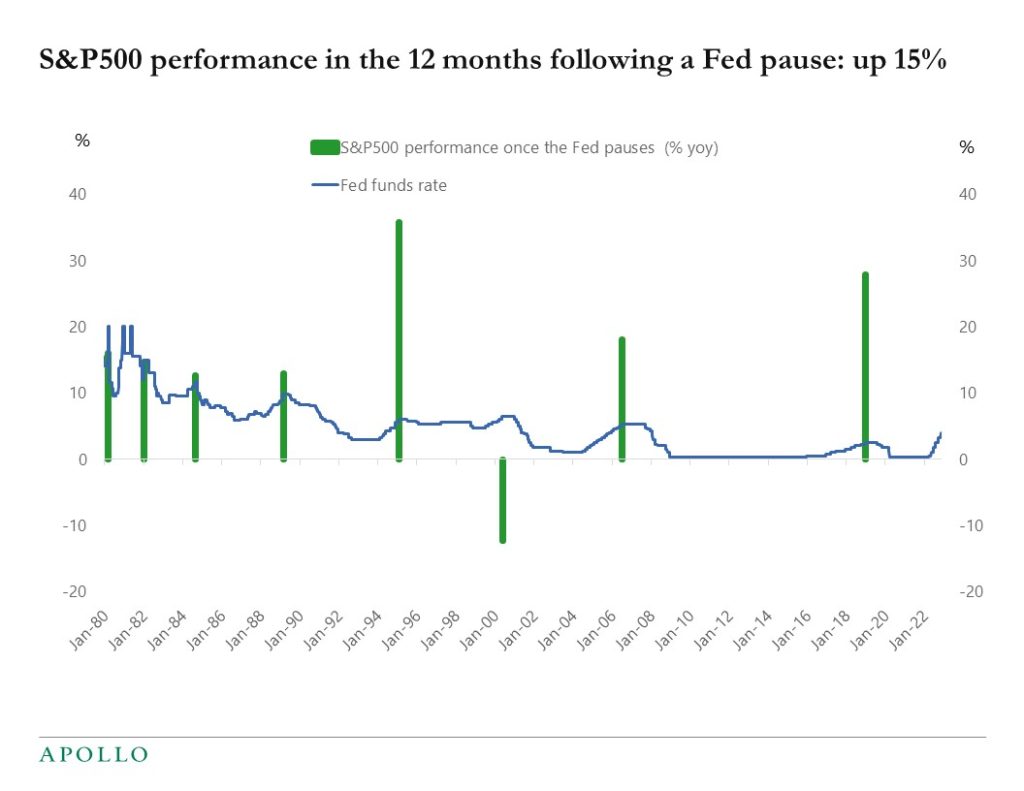
Source: Bloomberg, Apollo Chief Economist See important disclaimers at the bottom of the page.
-
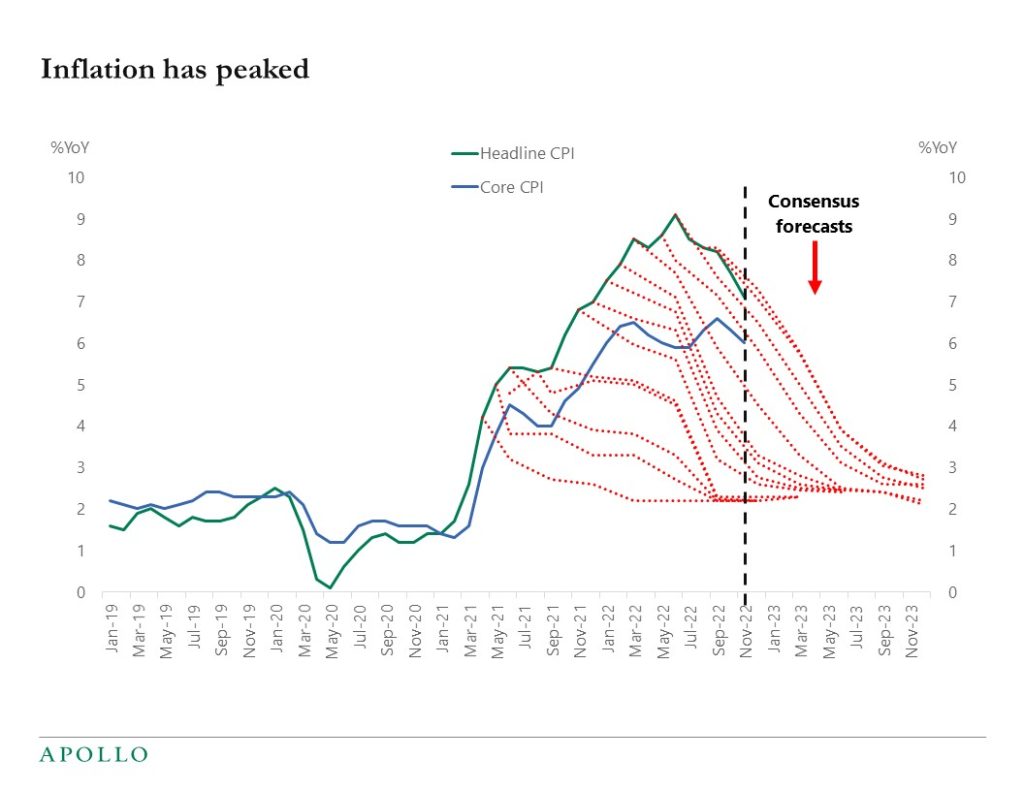
I will be on Bloomberg TV today at 8:30 am to preview the Fed meeting. Inflation continues to trend lower, which is good news for the Fed and markets. But the level of inflation at 7.1% is still significantly above the FOMC’s 2% inflation target. As a result, the Fed today is likely to argue that rates need to remain high for an extended period to ensure that inflation gets all the way back to 2%.
Source: Bloomberg, Haver Analytics, Apollo Chief Economist See important disclaimers at the bottom of the page.
-
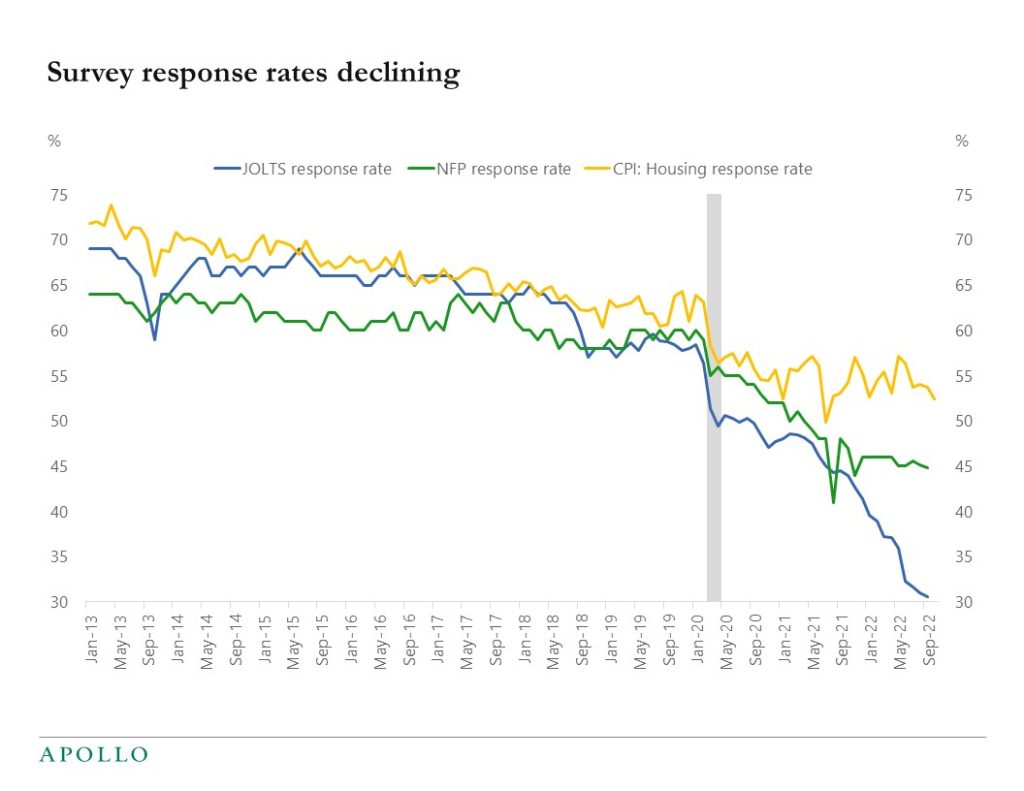
Survey response rates for employment and inflation have declined significantly during the pandemic, and this is introducing substantial measurement errors and uncertainty, see chart below. One such example is the widening gap between the establishment survey and the household survey in the employment report, with the establishment survey showing 2.6 mn jobs created over the past eight months and the household survey showing no job growth over the same period. Whether the economy created no jobs or 2.6mn jobs over the past eight months is obviously extremely important for the Fed and financial markets.
Source: BLS, Apollo Chief Economist See important disclaimers at the bottom of the page.
-
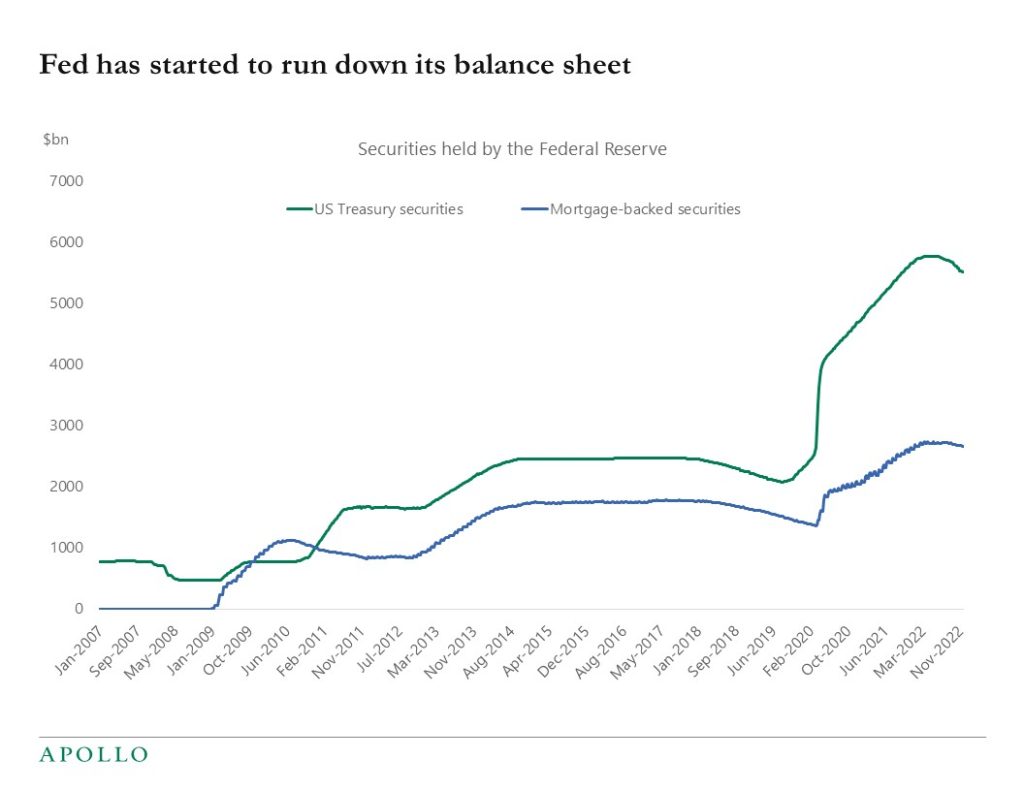
During the pandemic, the Fed expanded its balance sheet by $5trn, and the Fed is now shrinking it by $95bn every month with $60bn in Treasuries and $35bn in mortgages, see the chart below.
The implications for markets of QT are the opposite of what they were for QE. The idea with QE was to lower rates, boost equities, and narrow credit spreads. With the Fed now in tightening mode, the idea with QT is to raise long rates, lower equities, and widen credit spreads. Such a tightening in financial conditions helps increase the costs of capital and ultimately slow down inflation, see also this Fed paper, which finds that shrinking the Fed balance sheet by $2.5trn is equivalent to increasing the Fed funds rate by half a percentage point.
There are a lot of opinions in financial markets about the effects of QT, but the Fed’s view is clear: Even if the effects of QT are the opposite of QE, the negative effects on the economy and markets of QT are smaller than the positive effects of QE simply because QE normally comes quicker and bigger than QT. In other words, the fact that QT is drawn out over a much longer period than QE is spreading out the negative effects over a longer period.
The bottom line is that the Fed, with rate hikes and QT, is tightening financial conditions, and the Fed’s intentions are clear: higher long rates, lower equities, and wider credit spreads. But because these effects are spread out over a longer period than when the Fed is doing QE, the negative effects of QT on markets and the economy are smaller than the positive effects of QE.
For more, see these Fed papers here, here, here, and this paper by Caballero and Simsek.
Source: FRB, Haver, Apollo Chief Economist See important disclaimers at the bottom of the page.

This presentation may not be distributed, transmitted or otherwise communicated to others in whole or in part without the express consent of Apollo Global Management, Inc. (together with its subsidiaries, “Apollo”).
Apollo makes no representation or warranty, expressed or implied, with respect to the accuracy, reasonableness, or completeness of any of the statements made during this presentation, including, but not limited to, statements obtained from third parties. Opinions, estimates and projections constitute the current judgment of the speaker as of the date indicated. They do not necessarily reflect the views and opinions of Apollo and are subject to change at any time without notice. Apollo does not have any responsibility to update this presentation to account for such changes. There can be no assurance that any trends discussed during this presentation will continue.
Statements made throughout this presentation are not intended to provide, and should not be relied upon for, accounting, legal or tax advice and do not constitute an investment recommendation or investment advice. Investors should make an independent investigation of the information discussed during this presentation, including consulting their tax, legal, accounting or other advisors about such information. Apollo does not act for you and is not responsible for providing you with the protections afforded to its clients. This presentation does not constitute an offer to sell, or the solicitation of an offer to buy, any security, product or service, including interest in any investment product or fund or account managed or advised by Apollo.
Certain statements made throughout this presentation may be “forward-looking” in nature. Due to various risks and uncertainties, actual events or results may differ materially from those reflected or contemplated in such forward-looking information. As such, undue reliance should not be placed on such statements. Forward-looking statements may be identified by the use of terminology including, but not limited to, “may”, “will”, “should”, “expect”, “anticipate”, “target”, “project”, “estimate”, “intend”, “continue” or “believe” or the negatives thereof or other variations thereon or comparable terminology.