


Want it delivered daily to your inbox?
-
Inflation has for several years been moving down toward the Fed’s 2% inflation target. But the consensus now expects inflation to rise over the coming quarters, driven by tariffs and by upward pressure on housing inflation, see charts below.
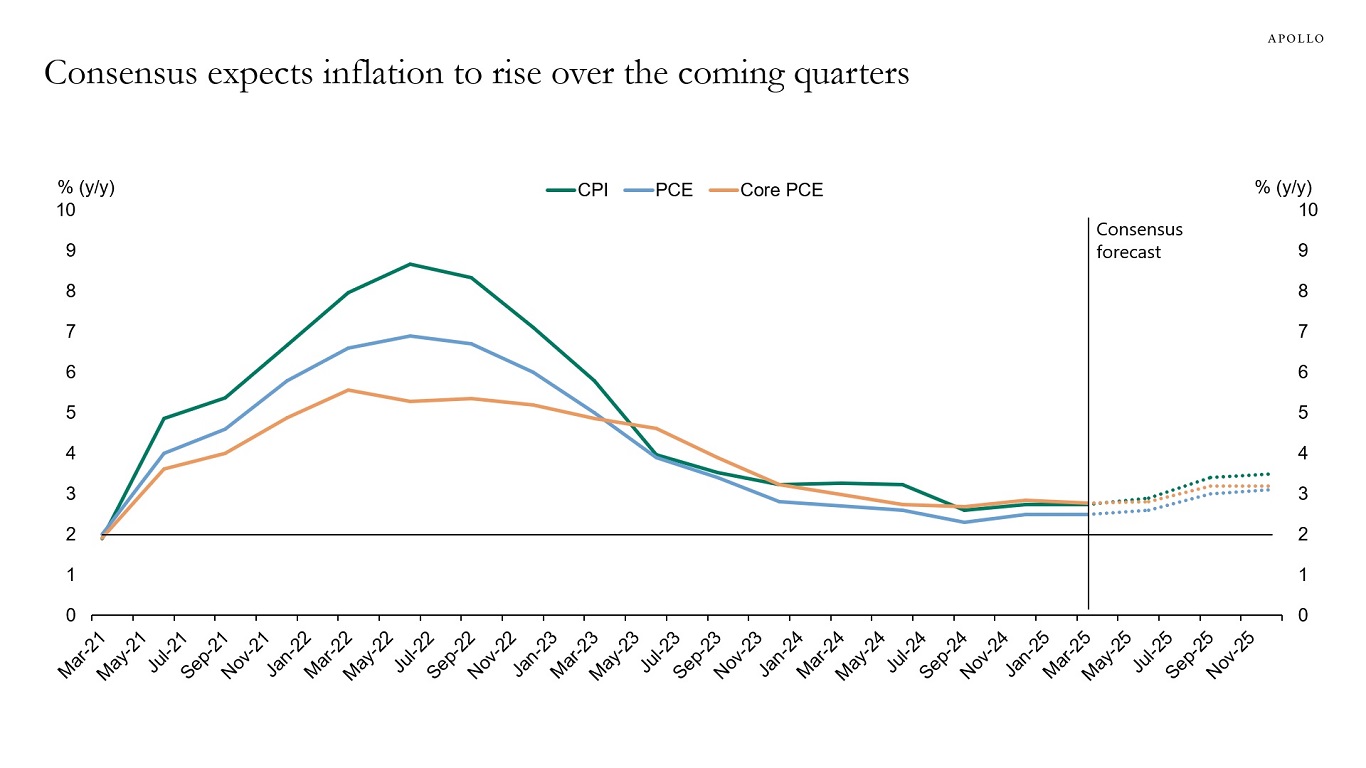
Sources: Bloomberg, Apollo Chief Economist 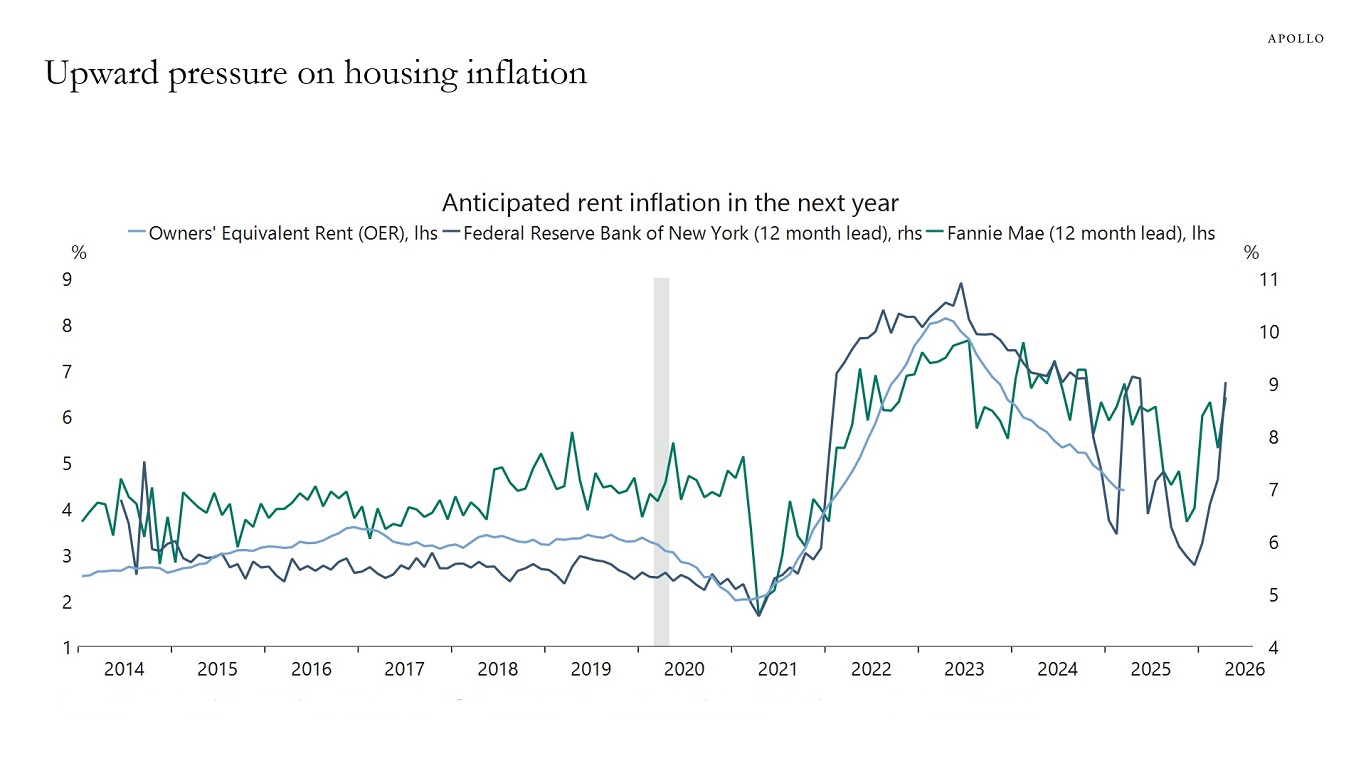
Sources: Federal National Mortgage Association (Fannie Mae), Federal Reserve Bank of New York, US Bureau of Labor Statistics (BLS), Macrobond, Apollo Chief Economist See important disclaimers at the bottom of the page.
-
It’s been nearly two weeks since the China/US trade deal, but container traffic from China to the US hasn’t shown a strong rebound, see chart below.
This raises the question: Are 30% tariffs on China still too high? Or are US companies simply waiting to see if tariffs will drop further before ramping up shipments?
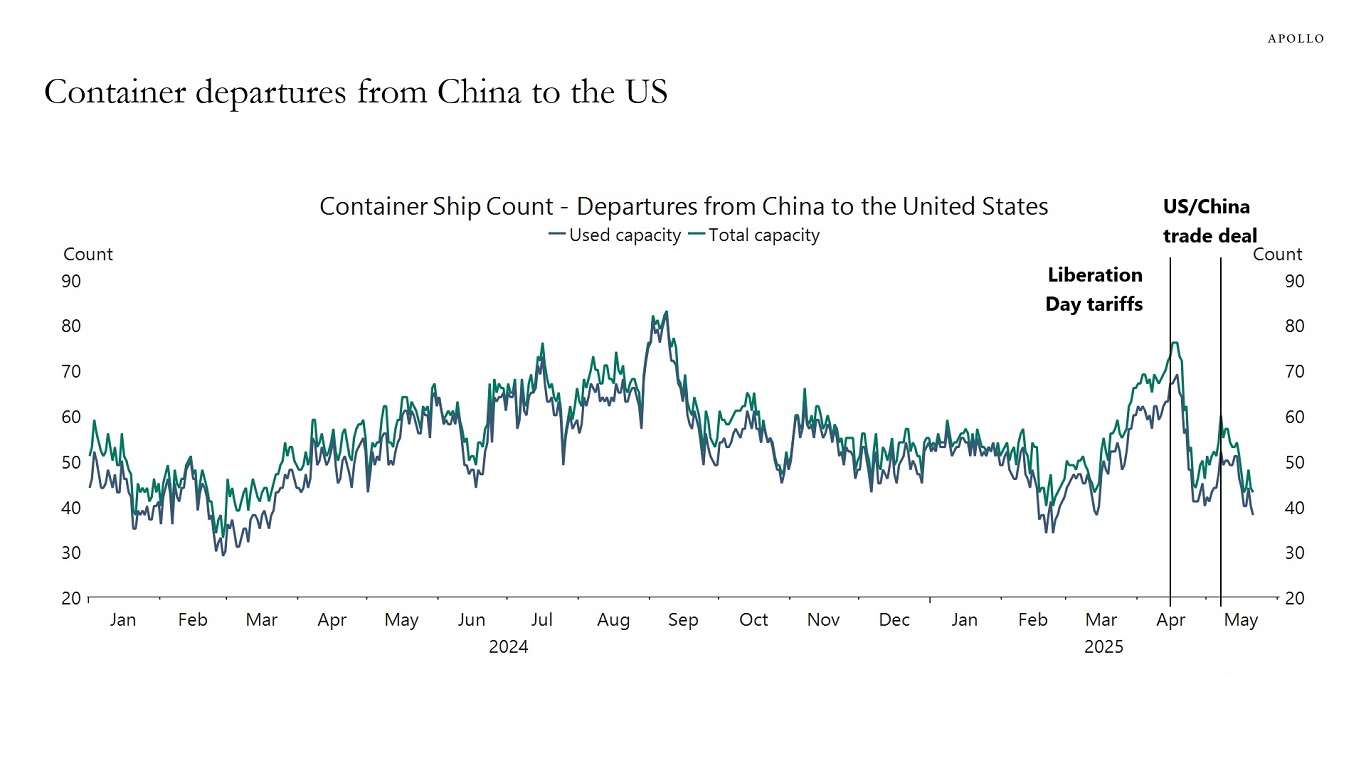
Note: Displays the estimated number of container vessels departing China for the United States, focusing on dry cargo ships. Aggregates data using a 15-day moving average to reduce short-term volatility and to provide a clearer view of broader trends in vessel activity. Sources: Bloomberg, Macrobond, Apollo Chief Economist See important disclaimers at the bottom of the page.
-
Weekly data for homebuilder traffic points to a weak spring selling season, driven by mortgage rates near 7%, record-low consumer confidence, and a rising inventory of homes for sale, see chart below.
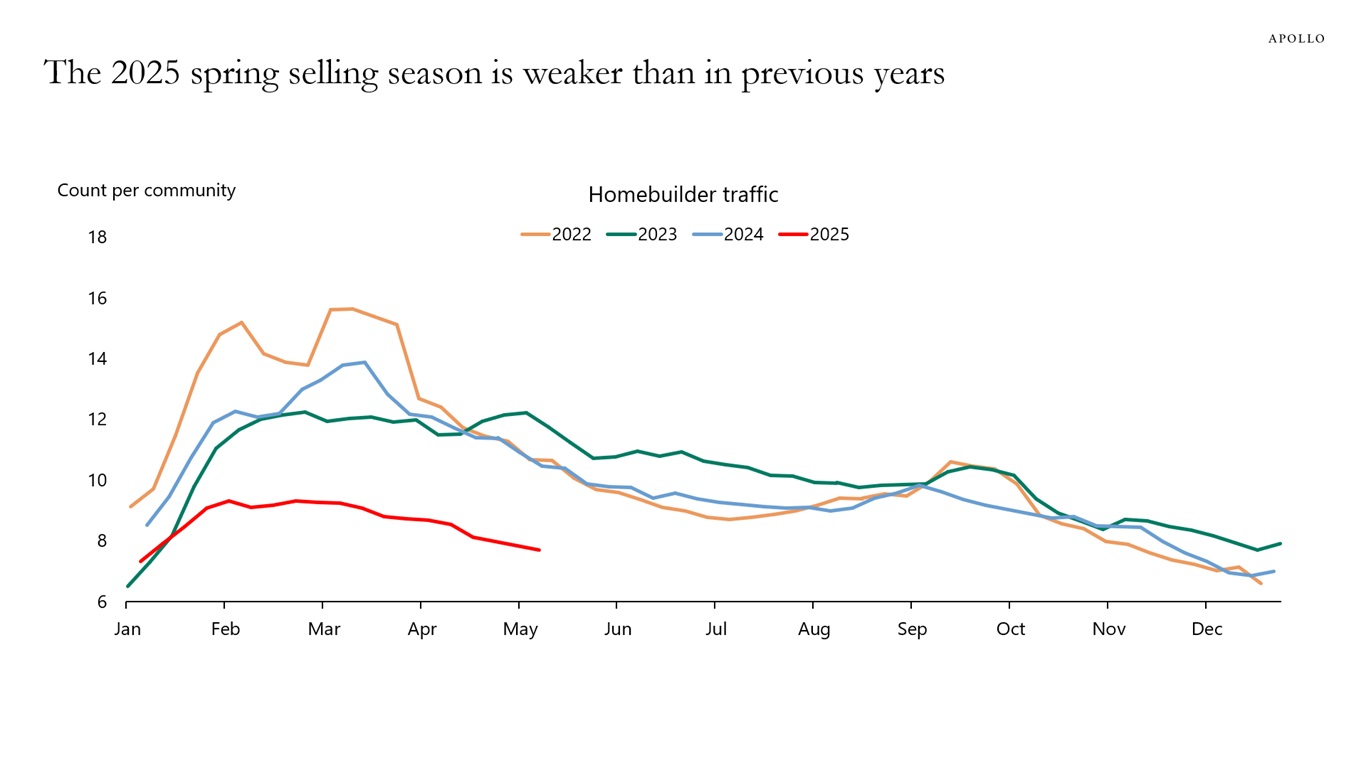
Sources: Zonda, Apollo Chief Economist See important disclaimers at the bottom of the page.
-
When the Fed started raising interest rates in March 2022, the Magnificent 7 stopped hiring more workers, see chart below.
Why is the tech sector so vulnerable to higher interest rates? First, tech firms are priced to deliver cash flows far out in the future, which makes tech companies more vulnerable to changes in the discount rate. Second, tech firms often need to borrow to finance multi-year projects, which also makes them more vulnerable to higher interest rates. Third, when interest rates are high, general risk appetite among investors is low, as investors can generate higher returns in fixed income.
The bottom line is that the bubble in AI valuations was simply the result of a long period with zero interest rates.
With upward pressures on inflation coming from tariffs, deglobalization, and demographics, interest rates will remain high and continue to be a headwind to tech and growth for the coming years.

Sources: Bloomberg, Apollo Chief Economist See important disclaimers at the bottom of the page.
-
While tariffs on China have declined from 145% to 30%, the headwind to corporate earnings from tariffs remains significant because of the overall jump in the average tariff rate from 3% in January to 18% today, see the first and second chart below. We are already beginning to see weakness in the economic data with a significant decline in the earnings revisions ratio since Liberation Day, see the third chart.

Sources: White House, China Ministry of Finance, Macrobond, Apollo Chief Economist 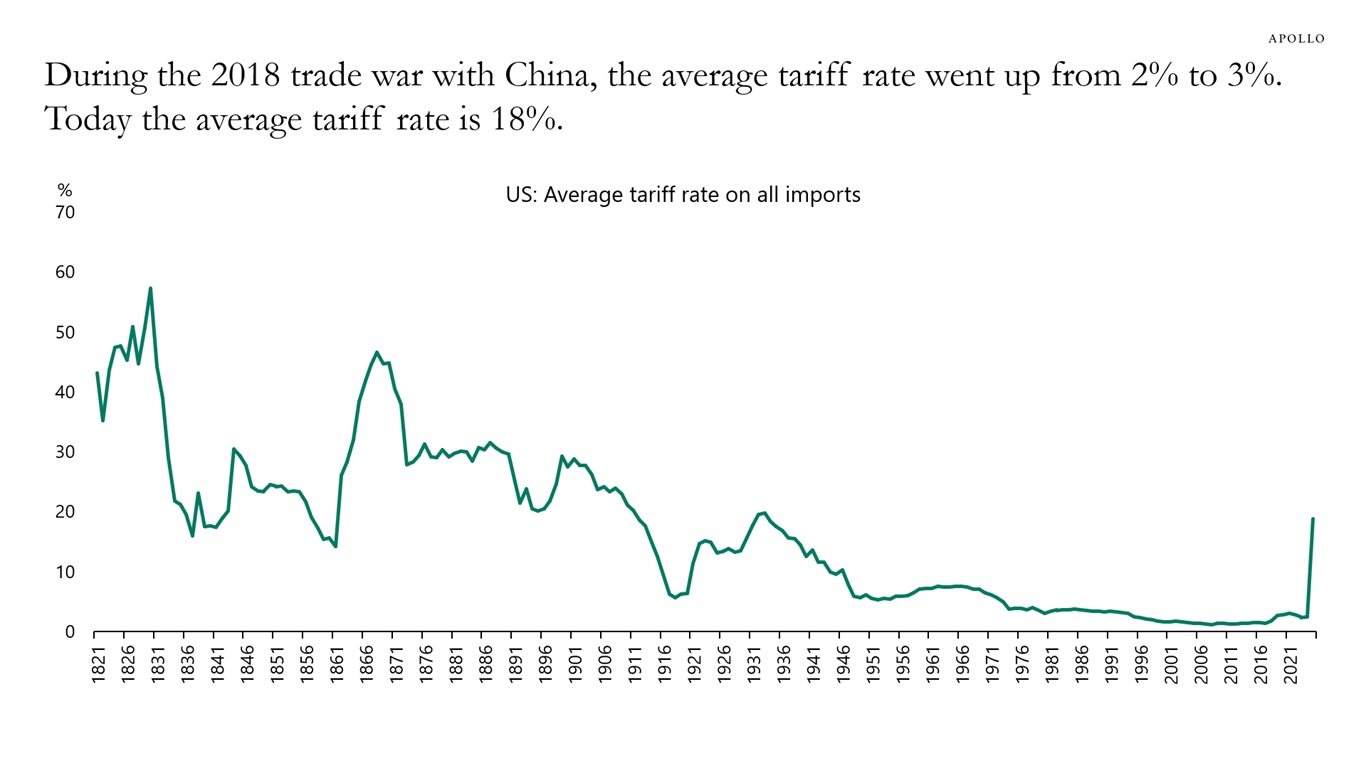
Note: Includes IEEPA tariffs on Canada, Mexico, and China (with USMCA exemptions); April 2 “reciprocal” tariffs; and steel, aluminum, auto, and auto parts tariffs. Tariff revenue estimate uses an elasticity of -0.997 and a noncompliance rate of 8 percent. Sources: US Census Bureau; Historical Statistics of the United States: Colonial Times to 1970, Part II; US International Trade Commission, “U.S. imports for consumption, duties collected, and ratio of duties to values, 1891-2023, (Table 1)”; Tax Foundation calculations; Apollo Chief Economist 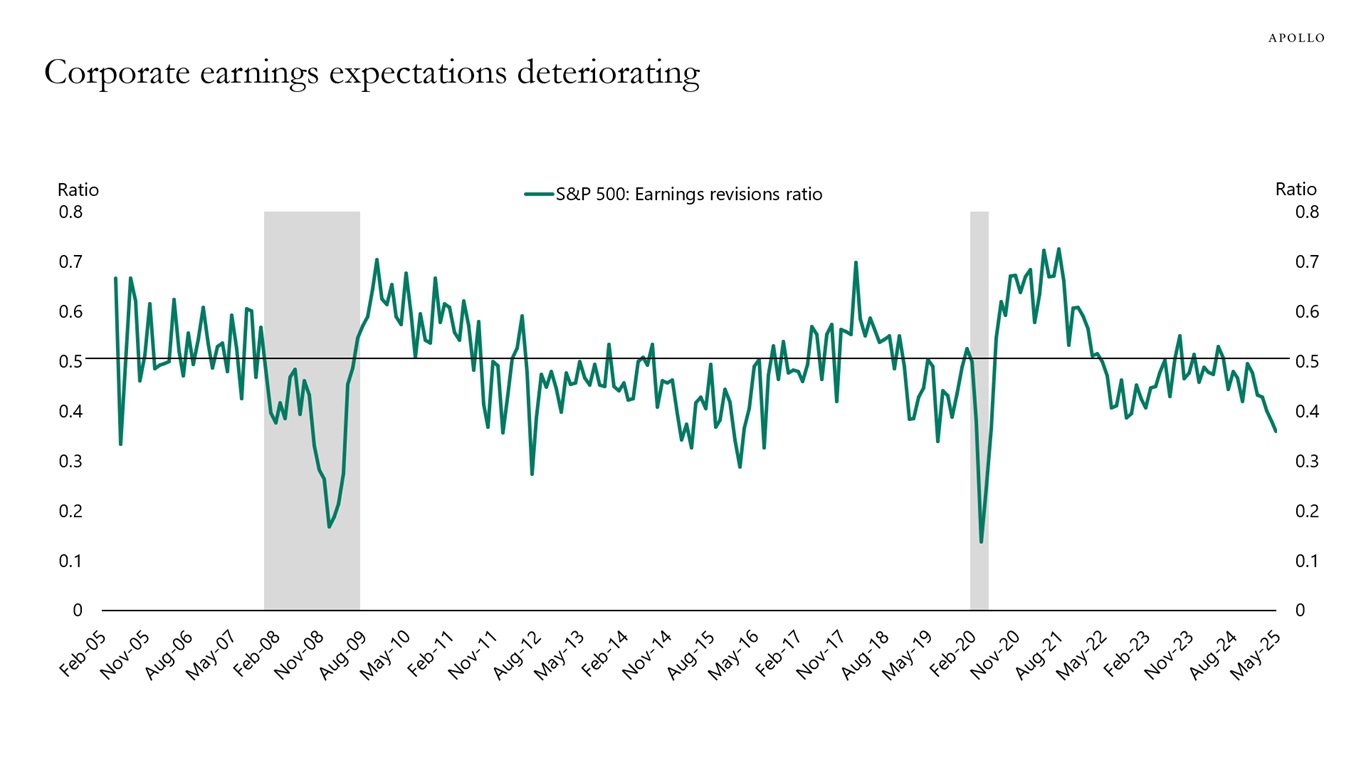
Note: Earnings revisions ratio measures how many upward revisions to earnings estimates analysts are making versus downward revisions over a given period. Above 0.5 more upgrades than downgrades and below 0.5 more downgrades than upgrades. Sources: Bloomberg, Apollo Chief Economist See important disclaimers at the bottom of the page.
-
The Covid-motivated pause on reporting delinquent federal student loans has now ended. As a result, starting in May 2025, up to 10% of US households may face a steep decline in their credit score, see chart below. This means they will no longer be able to get a loan to buy a car, a house, or new furniture. Combined with tariffs and high uncertainty, this is a significant headwind to consumer spending over the coming months. See here for more discussion from the New York Fed.
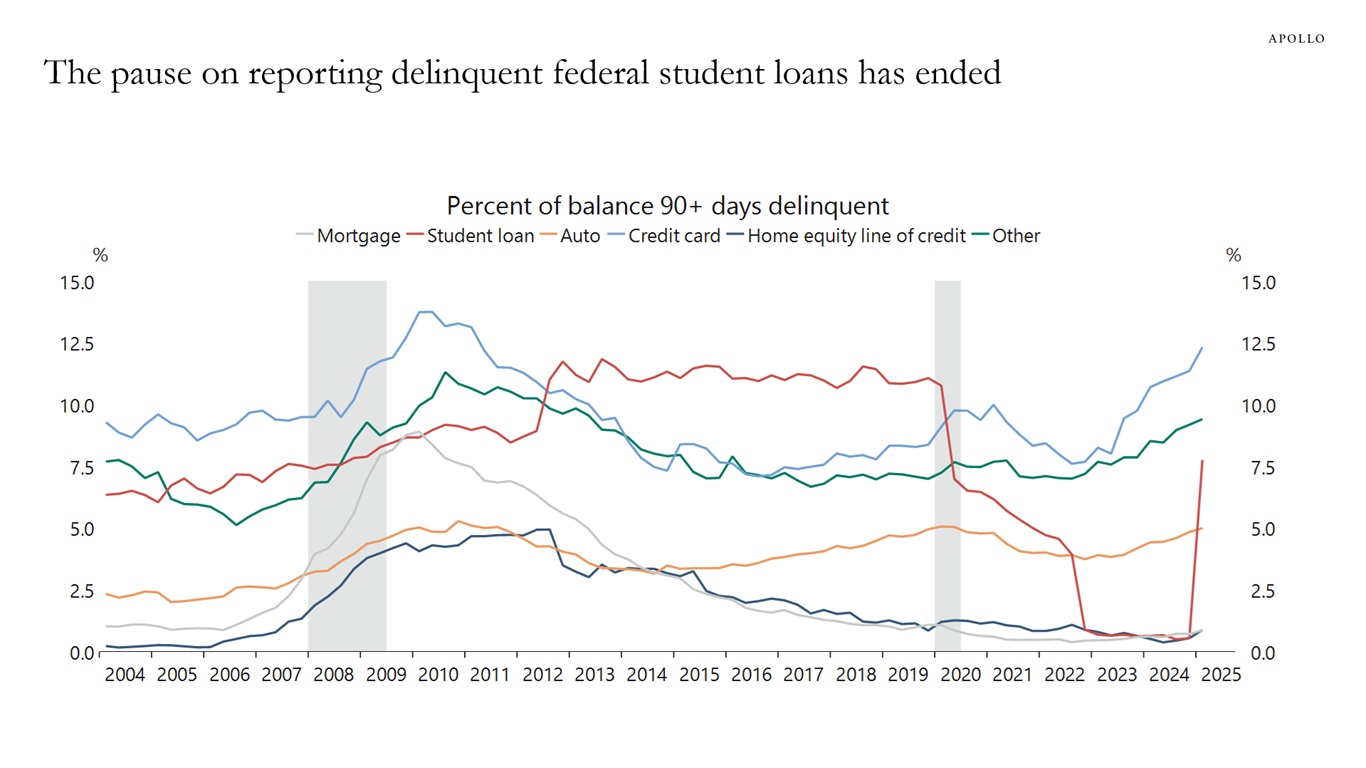
Sources: Federal Reserve Bank of New York, Macrobond, Apollo Chief Economist See important disclaimers at the bottom of the page.
-
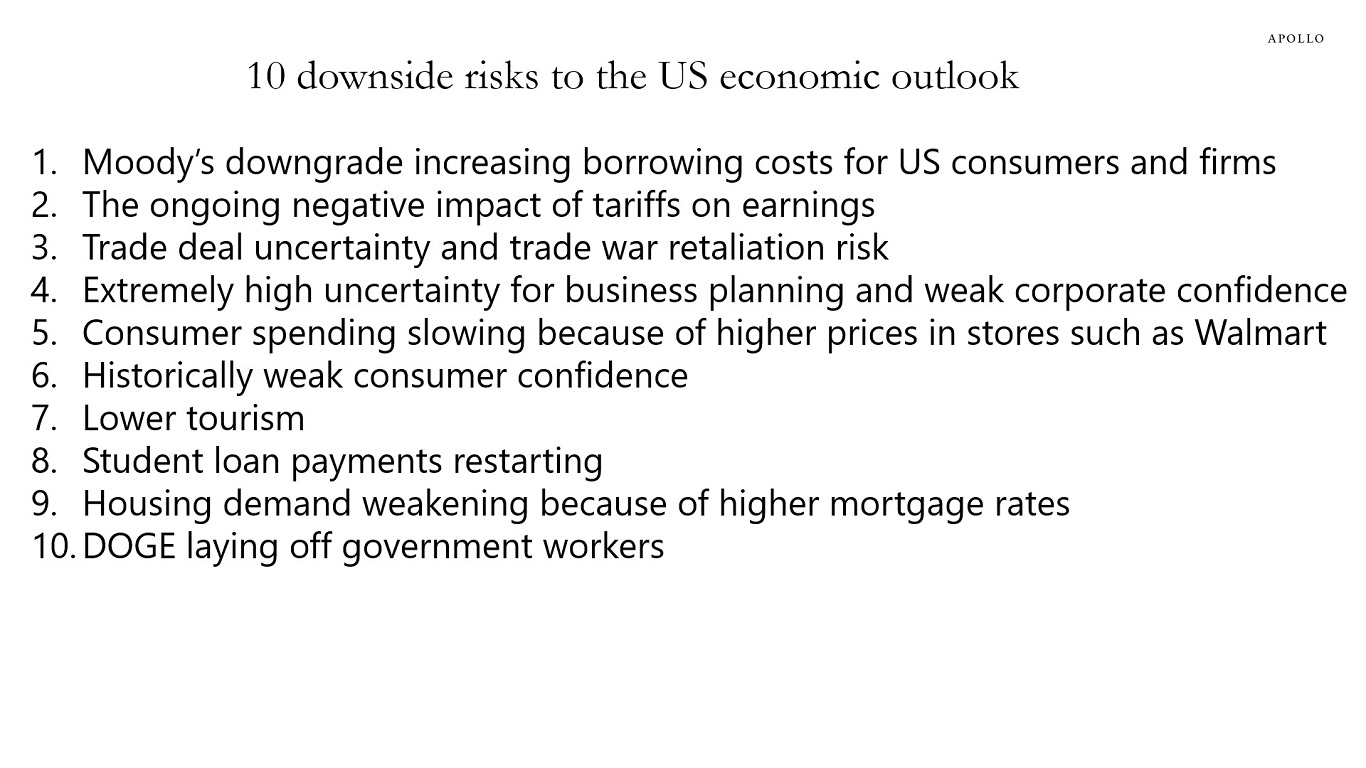
The trade war is making products more expensive at Walmart, student loan payments are restarting, and the Moody’s downgrade is pushing up borrowing costs for consumers and firms. The list of headwinds is growing, see below.
Source: Apollo Chief Economist See important disclaimers at the bottom of the page.
-
Indirect bidding in Treasury auctions refers to bids submitted on behalf of foreign institutions. These bidders don’t participate directly, but instead have their bids placed by intermediaries—hence “indirect.” Looking at foreign participation in 30-year Treasury auctions shows a downward trend in recent months, see chart below.
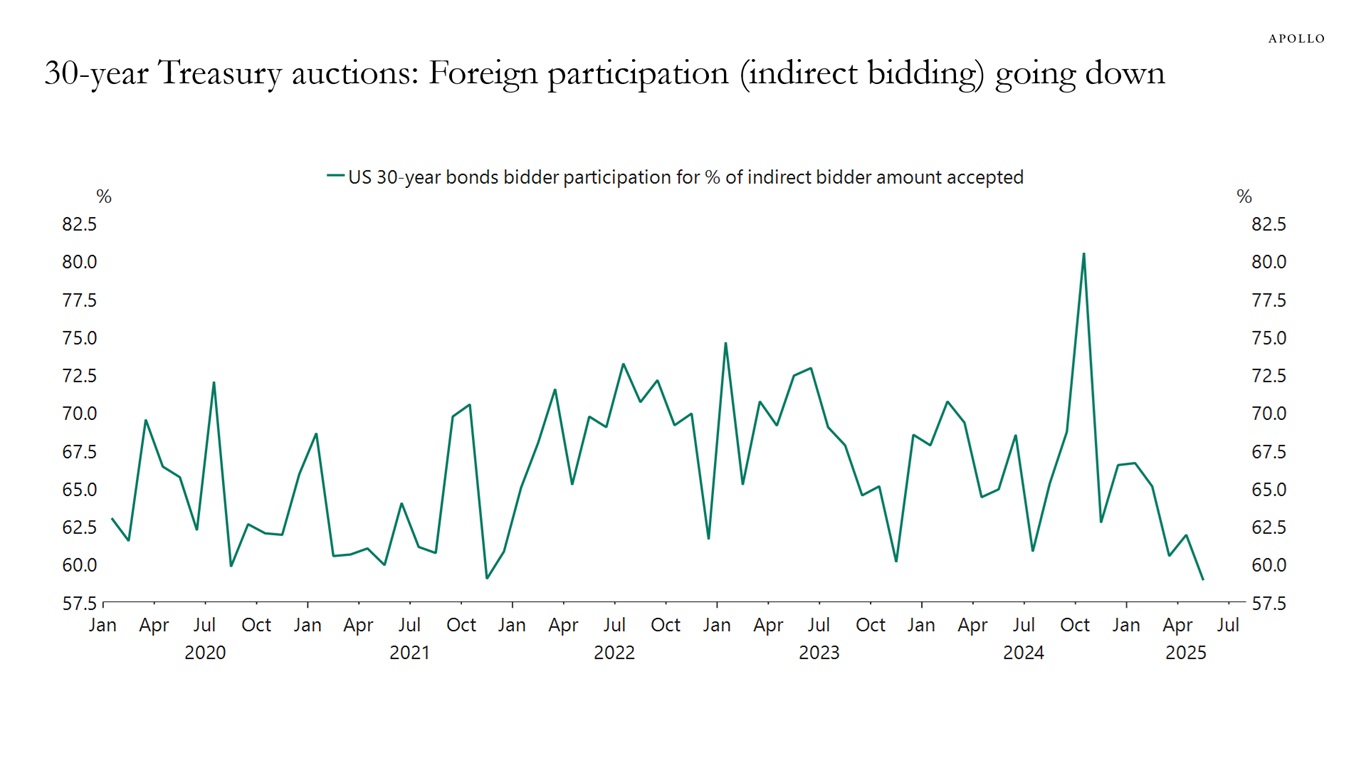
Sources: Bloomberg, Macrobond, Apollo Chief Economist See important disclaimers at the bottom of the page.
-
US data centers are currently powered mainly by gas and coal. The IEA is forecasting that this will change over the coming years with renewables playing a much more significant role, see chart below.
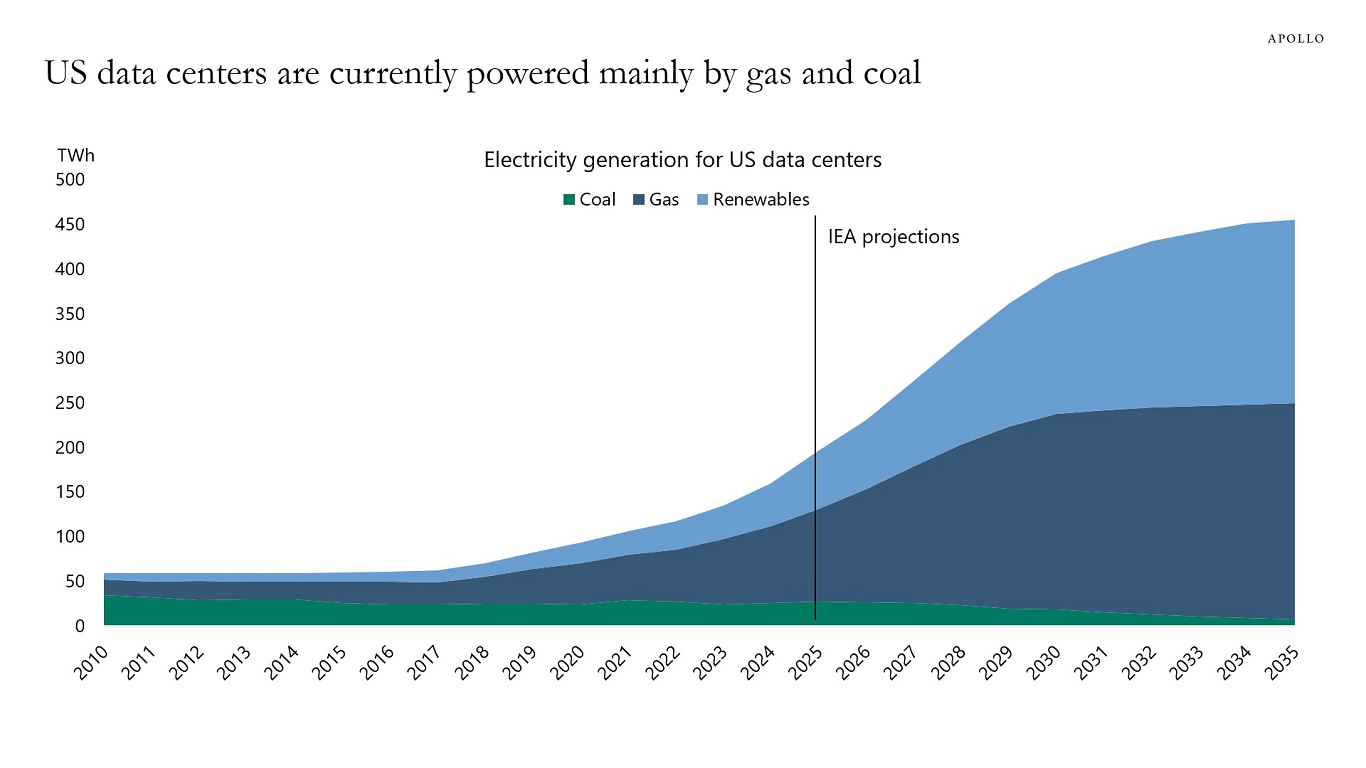
Sources: IEA, Bloomberg, Apollo Chief Economist See important disclaimers at the bottom of the page.
-
See important disclaimers at the bottom of the page.

This presentation may not be distributed, transmitted or otherwise communicated to others in whole or in part without the express consent of Apollo Global Management, Inc. (together with its subsidiaries, “Apollo”).
Apollo makes no representation or warranty, expressed or implied, with respect to the accuracy, reasonableness, or completeness of any of the statements made during this presentation, including, but not limited to, statements obtained from third parties. Opinions, estimates and projections constitute the current judgment of the speaker as of the date indicated. They do not necessarily reflect the views and opinions of Apollo and are subject to change at any time without notice. Apollo does not have any responsibility to update this presentation to account for such changes. There can be no assurance that any trends discussed during this presentation will continue.
Statements made throughout this presentation are not intended to provide, and should not be relied upon for, accounting, legal or tax advice and do not constitute an investment recommendation or investment advice. Investors should make an independent investigation of the information discussed during this presentation, including consulting their tax, legal, accounting or other advisors about such information. Apollo does not act for you and is not responsible for providing you with the protections afforded to its clients. This presentation does not constitute an offer to sell, or the solicitation of an offer to buy, any security, product or service, including interest in any investment product or fund or account managed or advised by Apollo.
Certain statements made throughout this presentation may be “forward-looking” in nature. Due to various risks and uncertainties, actual events or results may differ materially from those reflected or contemplated in such forward-looking information. As such, undue reliance should not be placed on such statements. Forward-looking statements may be identified by the use of terminology including, but not limited to, “may”, “will”, “should”, “expect”, “anticipate”, “target”, “project”, “estimate”, “intend”, “continue” or “believe” or the negatives thereof or other variations thereon or comparable terminology.