


Want it delivered daily to your inbox?
-
If the Fed cuts in March, it will be eight months after the last Fed hike, which is exactly the average of all previous Fed hike cycles, see chart below.
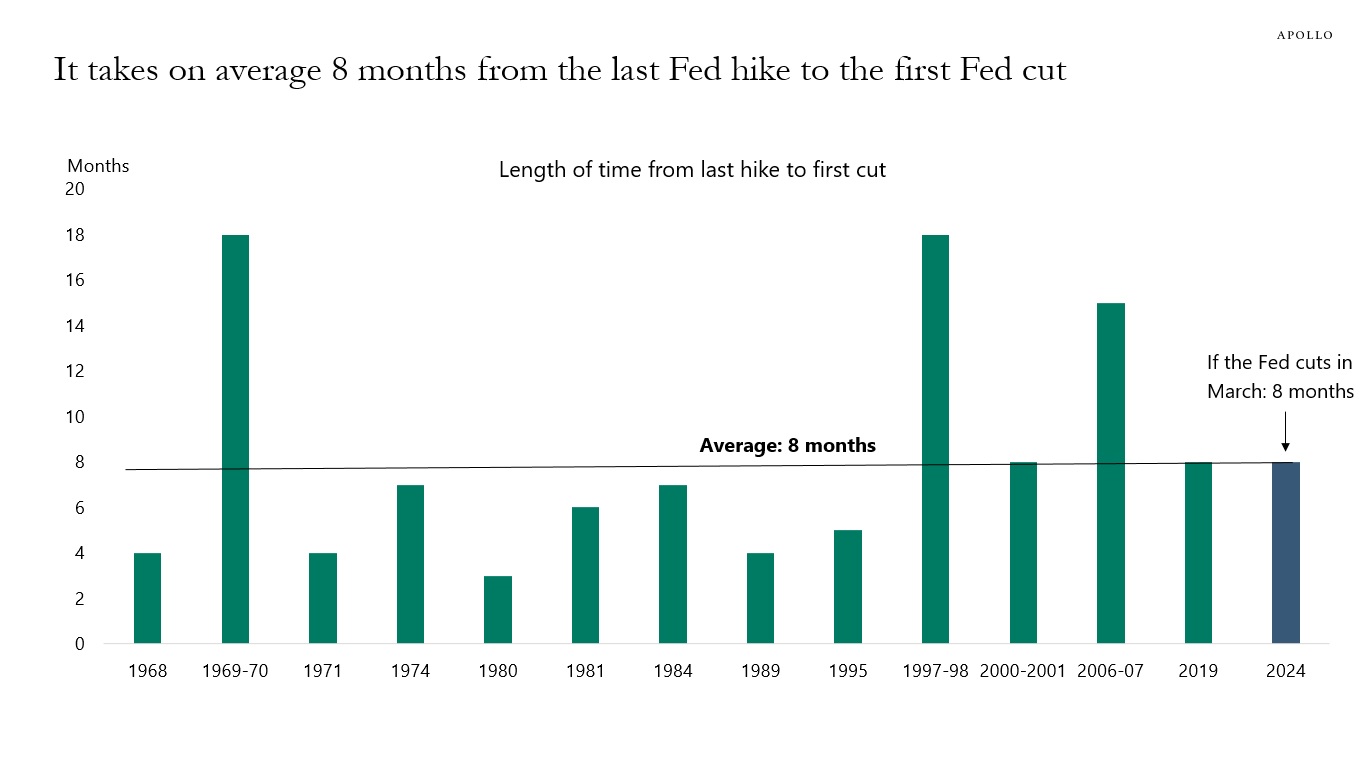
Source: FRB, Haver Analytics, Apollo Chief Economist. Note: Discount rate used before 1988. See important disclaimers at the bottom of the page.
-
The average price of a hotel room in Manhattan is now $375 per night, see chart below.
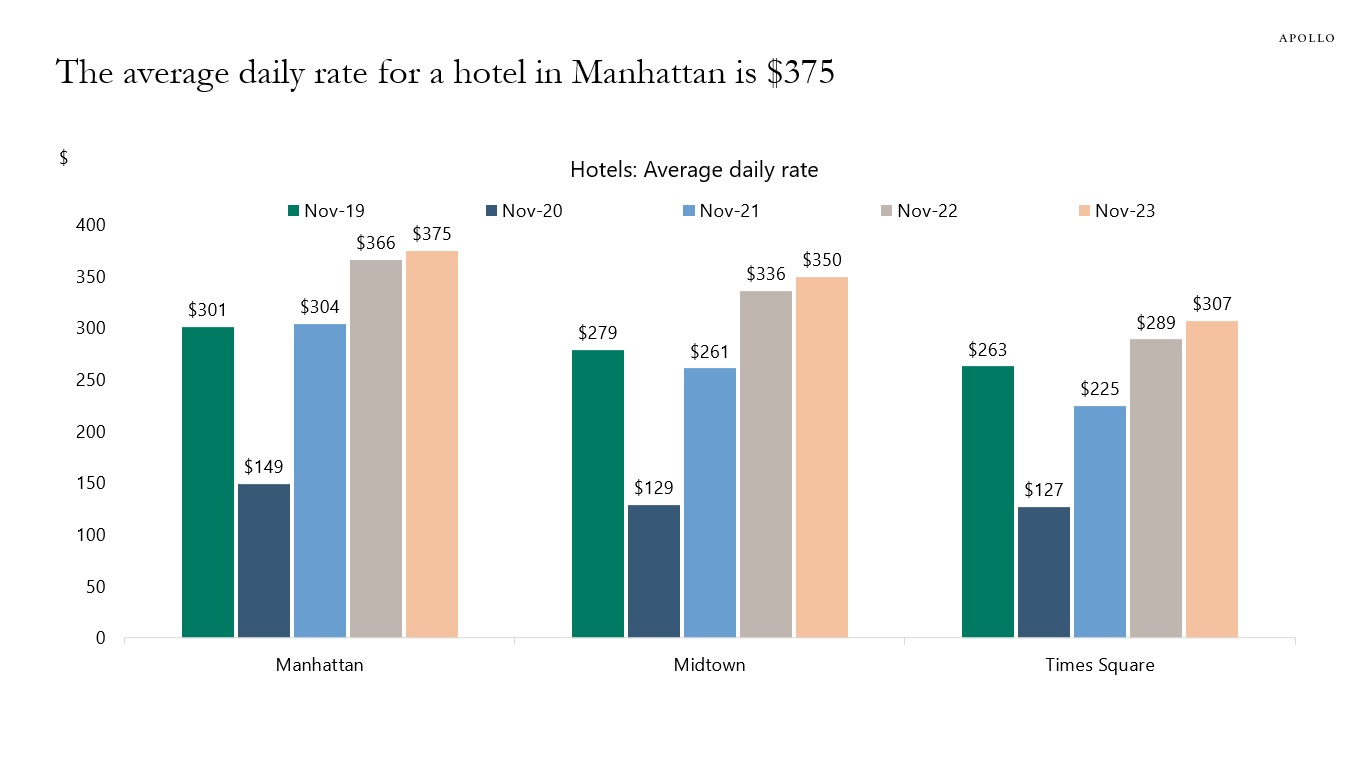
Source: Timessquarenyc.org, Apollo Chief Economist See important disclaimers at the bottom of the page.
-
Home prices are in freefall in Germany, driven by higher rates, high construction costs, and massive amounts of red tape in the housing sector, see chart below.
This downtrend is in sharp contrast to the US, where home prices are rising.
With more persistent inflation in Europe, and the ECB therefore cutting after the Fed, the downward pressure on home prices is likely to continue.
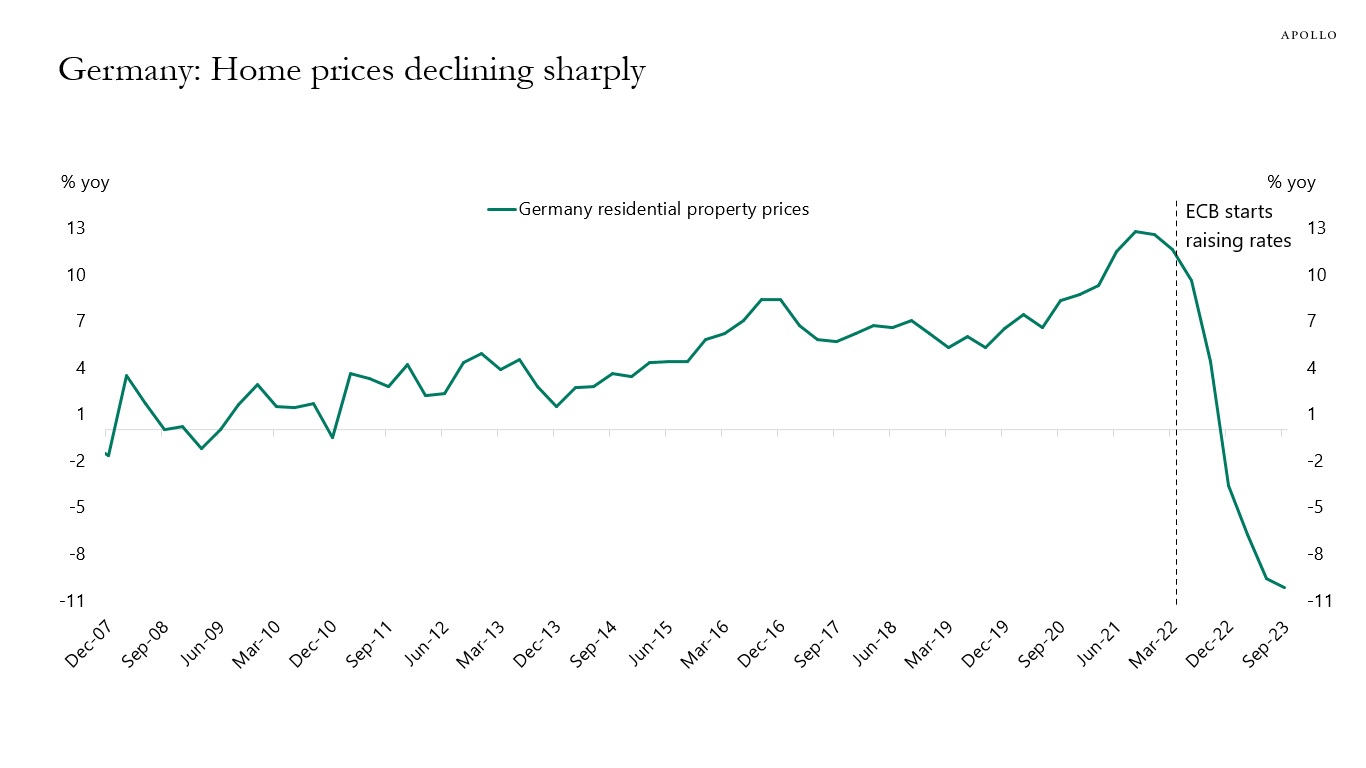
Source: Eurostat, Bloomberg, Apollo Chief Economist See important disclaimers at the bottom of the page.
-
The main argument for the Fed cutting rates in March is that the Fed’s workhorse model says that because of the sharp decline in inflation over the past six months, the Fed funds rate today should not be 5.5% but 4.5%, see chart below. Specifically, the Fed has used the Taylor rule framework for decades to understand what the Fed funds rate should be, and inserting the current level of inflation and unemployment into the Taylor rule shows that the Fed funds rate today should be 4.5%, see chart below and Daily Spark here.
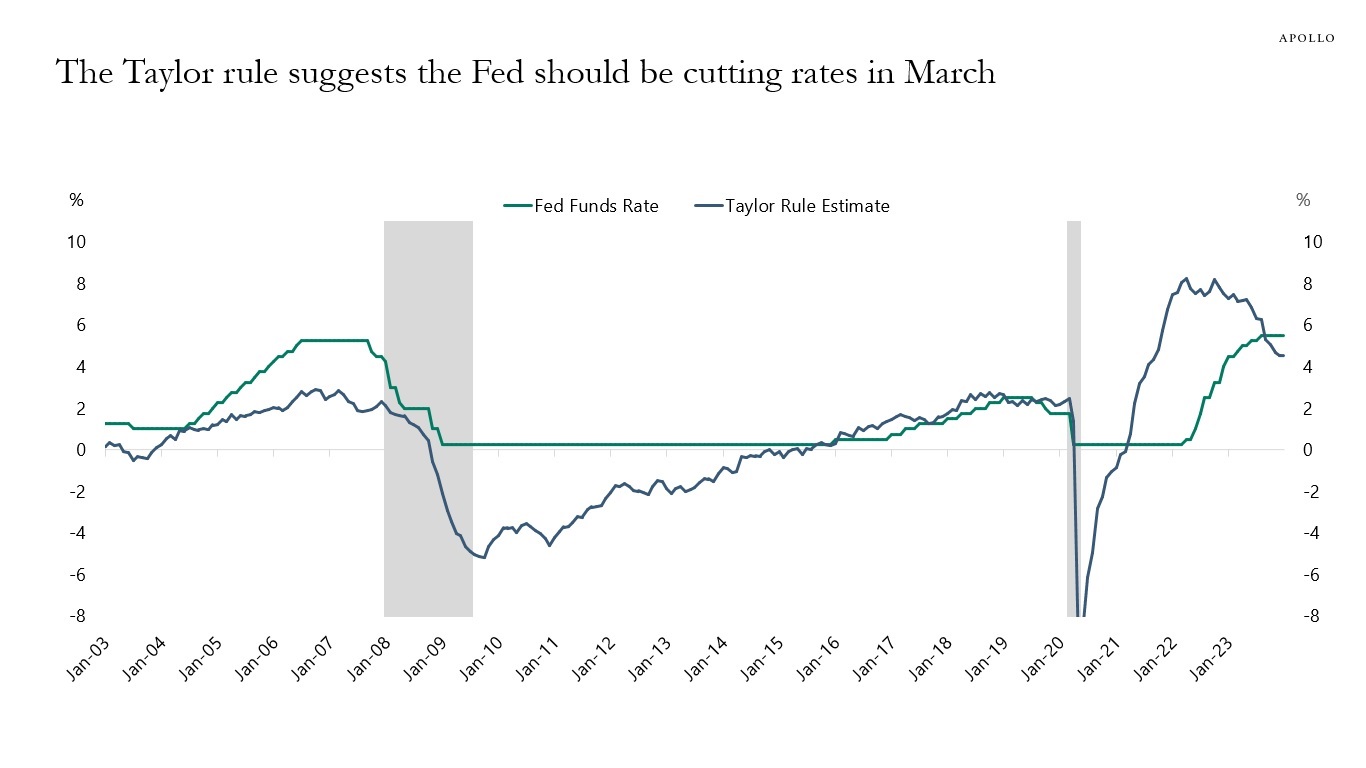
Source: Bloomberg, Apollo Chief Economist. Note: Neutral real rate = 0.5, inflation target rate = 2, and NAIRU = 4. See important disclaimers at the bottom of the page.
-
Since the middle of the pandemic, the population has been declining in New York and California, and growing in Florida and Texas, see map below.
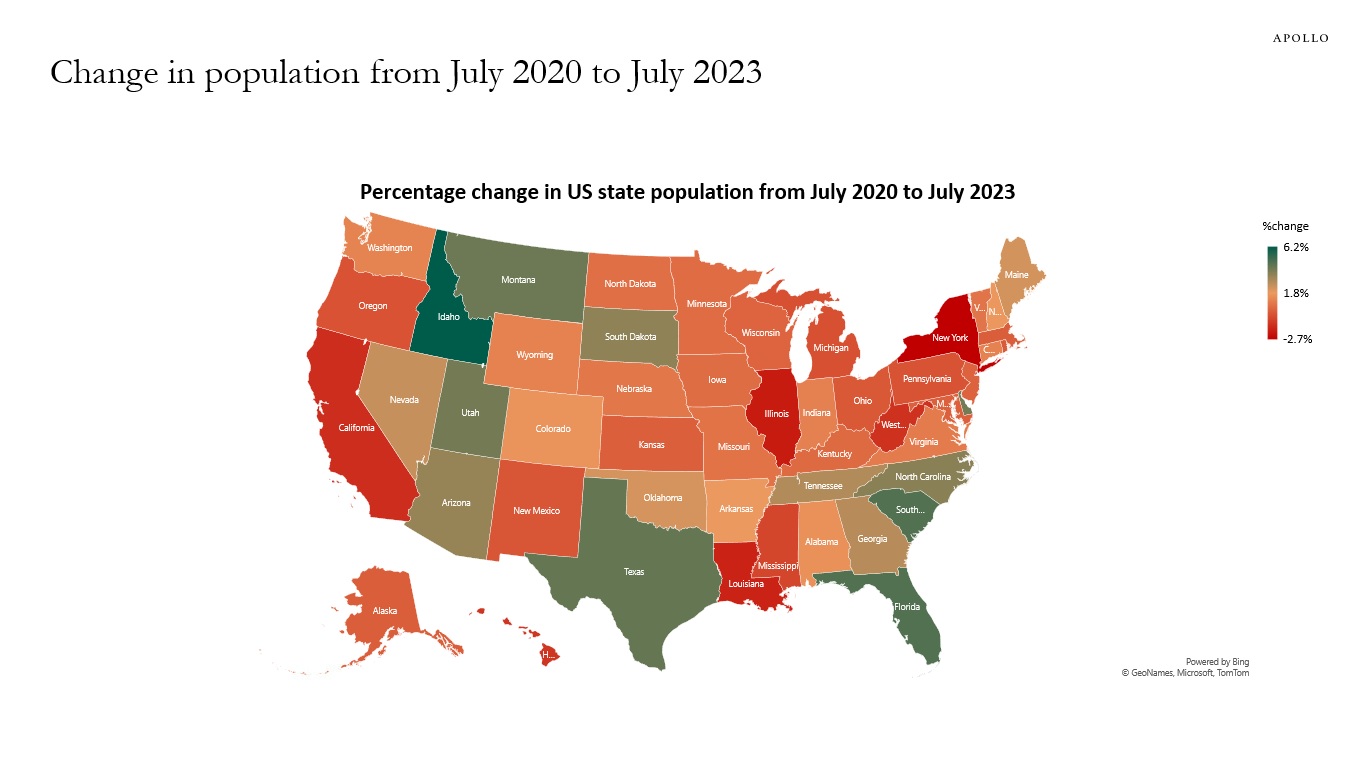
Source: Census Bureau, Apollo Chief Economist See important disclaimers at the bottom of the page.
-
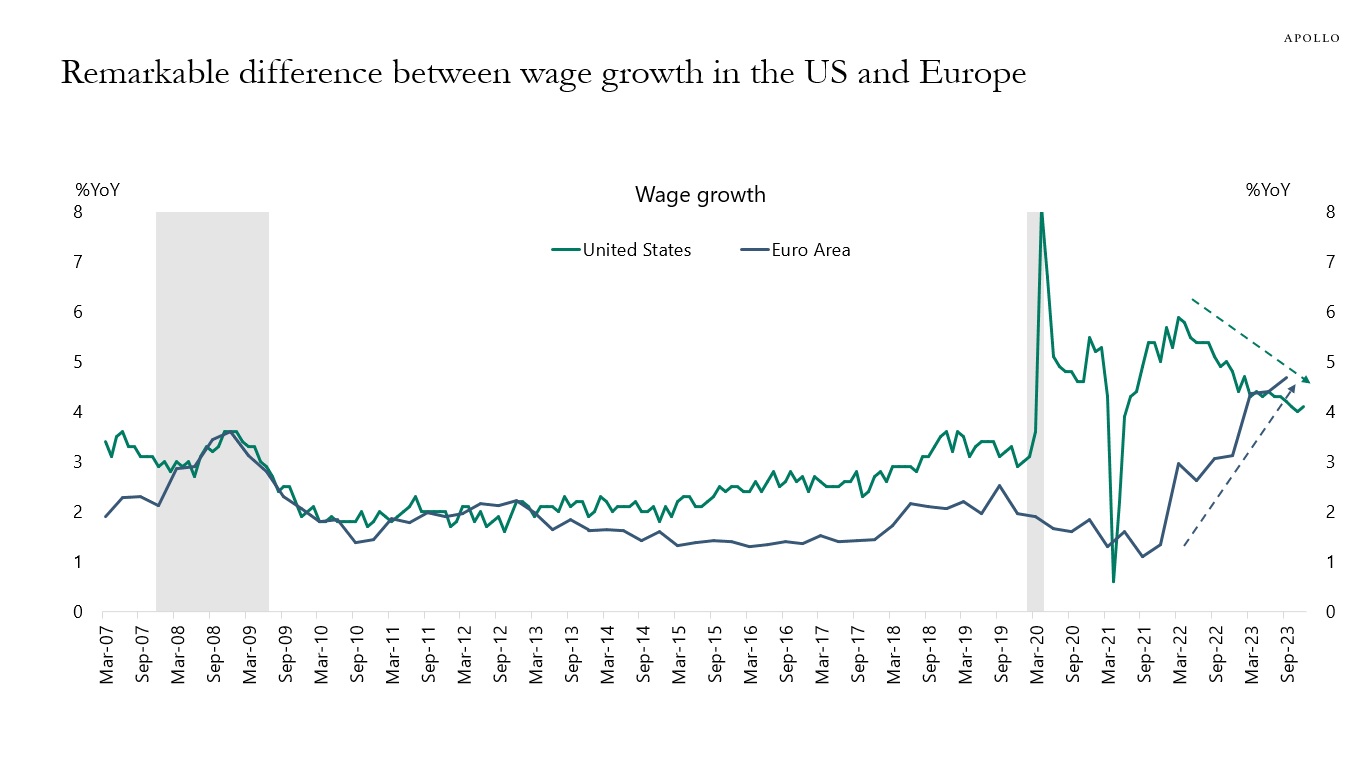
The difference between European and US wage inflation is remarkable.
Both economies have a strong labor market, but US wage inflation is falling and Euro area wage inflation is trending higher.
The source of this difference is European trade unions, which often look back at last year’s consumer price inflation when articulating wage demands for the next year.
This inertia in wage formation is making inflation in Europe more persistent and more difficult to control for the ECB.
As a result, the Fed will cut rates before the ECB.
Source: BLS, ECB, Bloomberg, Apollo Chief Economist See important disclaimers at the bottom of the page.
-
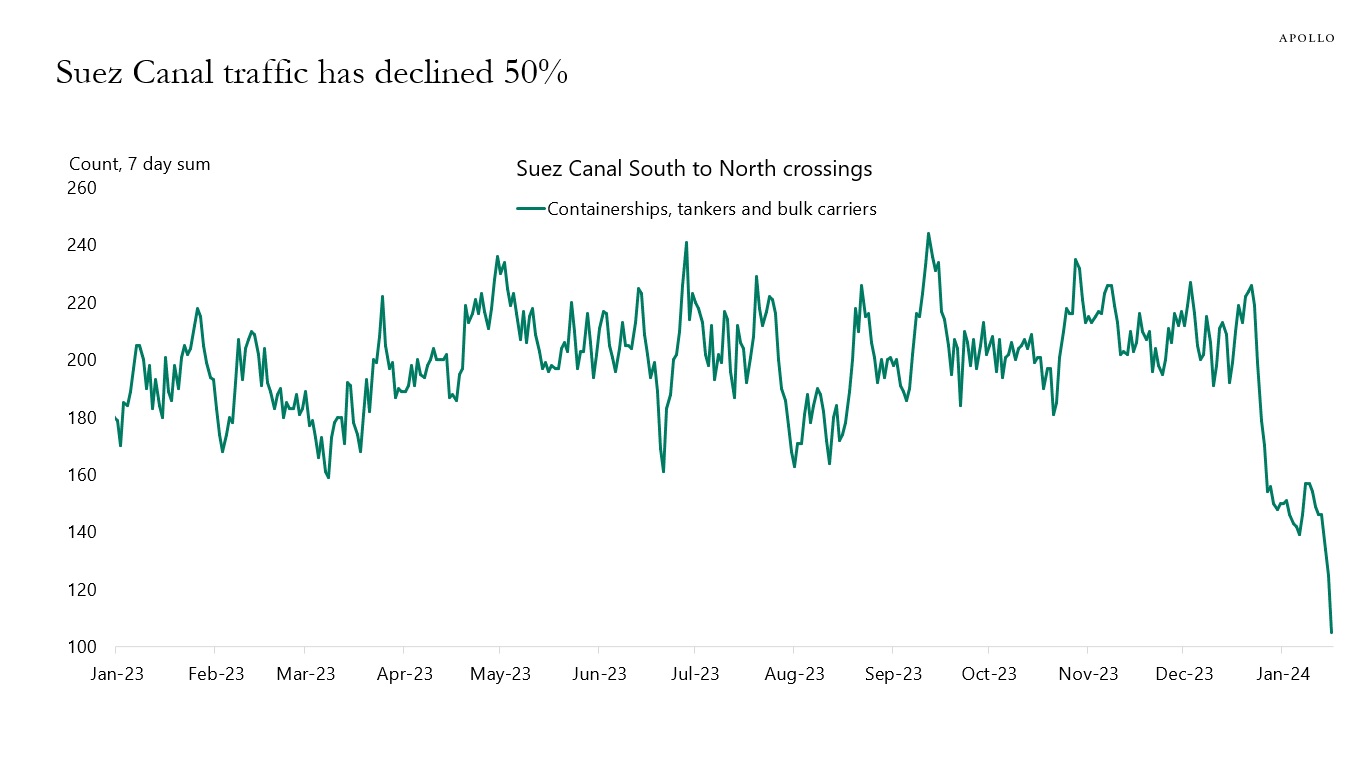
Normally, 200 ships travel through the Suez Canal from south to north over a week, but that number has recently declined to 100, see the first chart.
For the Panama Canal, northbound traffic has also declined 50%, from 90 ships per week to 45, see the second chart.
The third chart shows that the price of transporting a container from Shanghai to Rotterdam has tripled.
The bottom line is that higher transportation costs are putting upward pressure on goods inflation.
Source: Bloomberg, Apollo Chief Economist 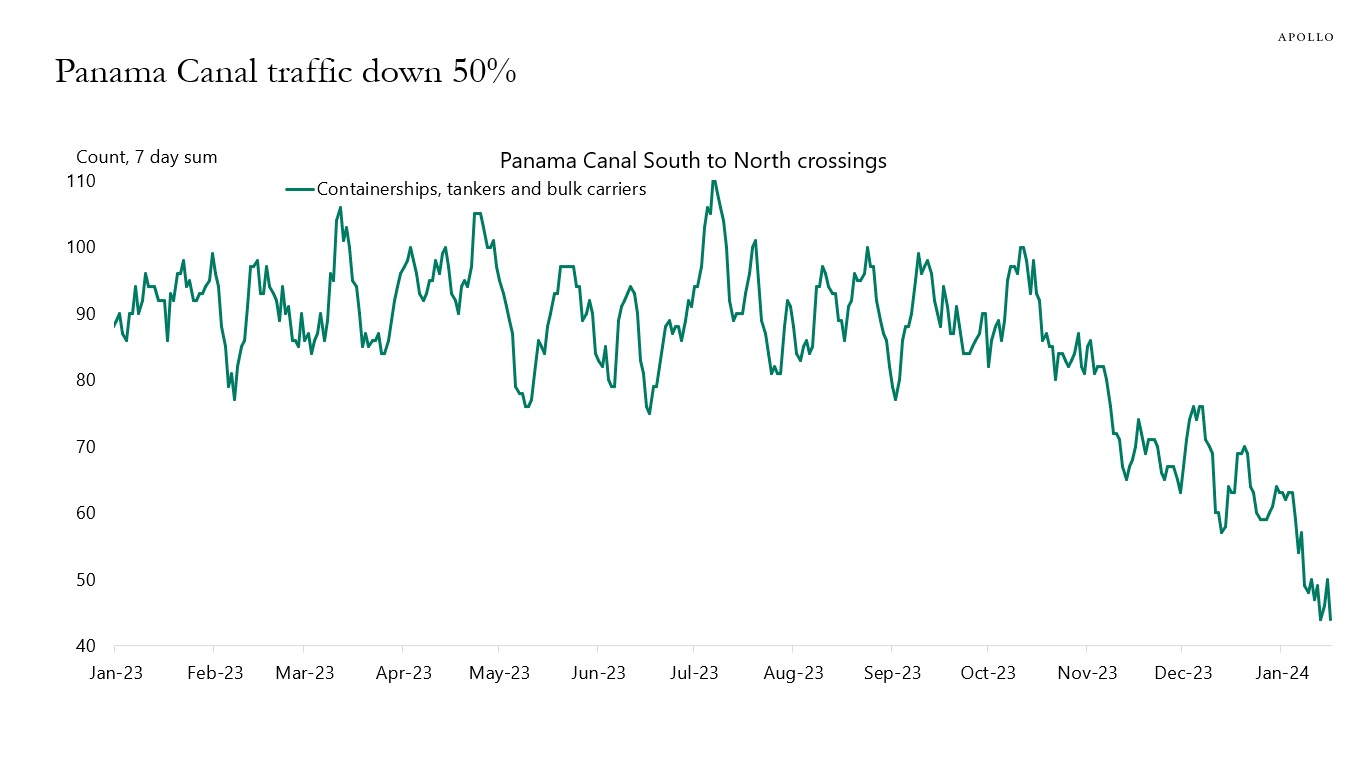
Source: Bloomberg, Apollo Chief Economist 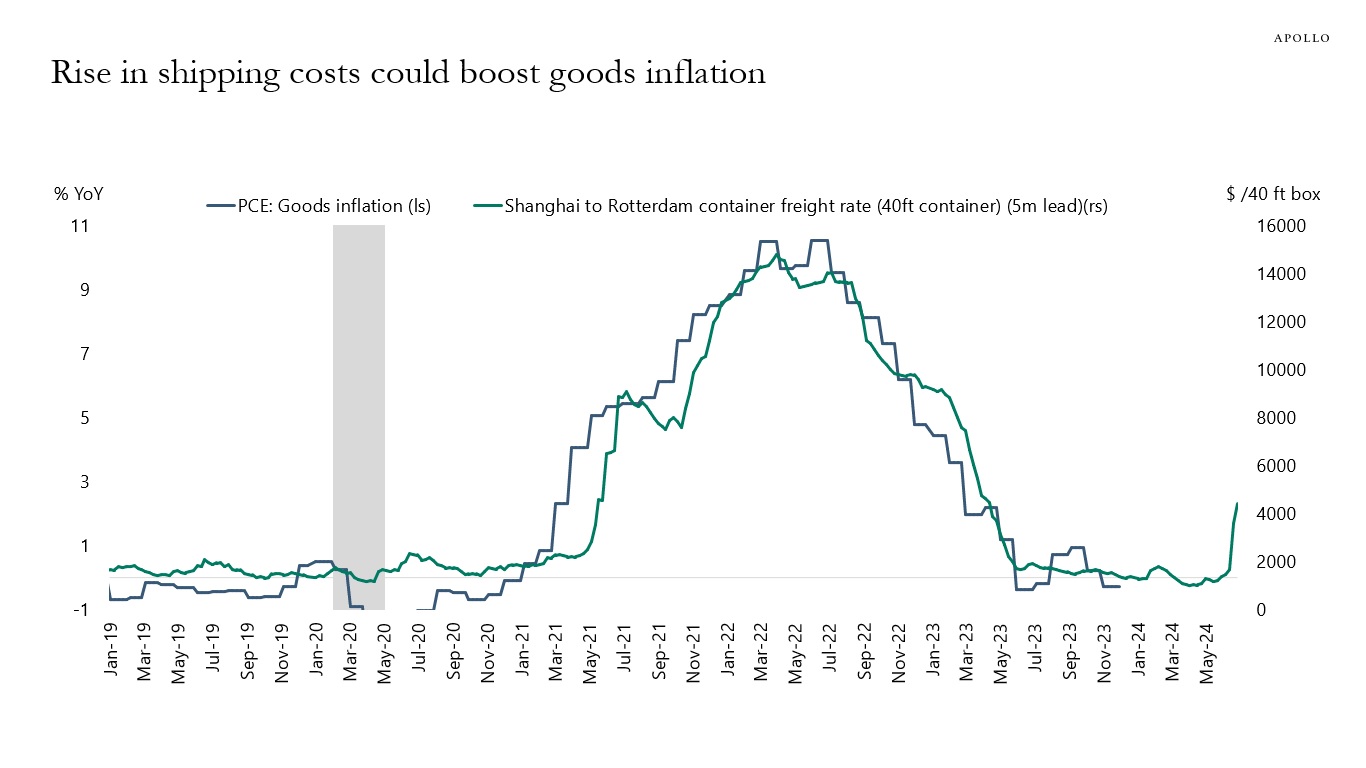
Source: BEA, Bloomberg, Apollo Chief Economist See important disclaimers at the bottom of the page.
-
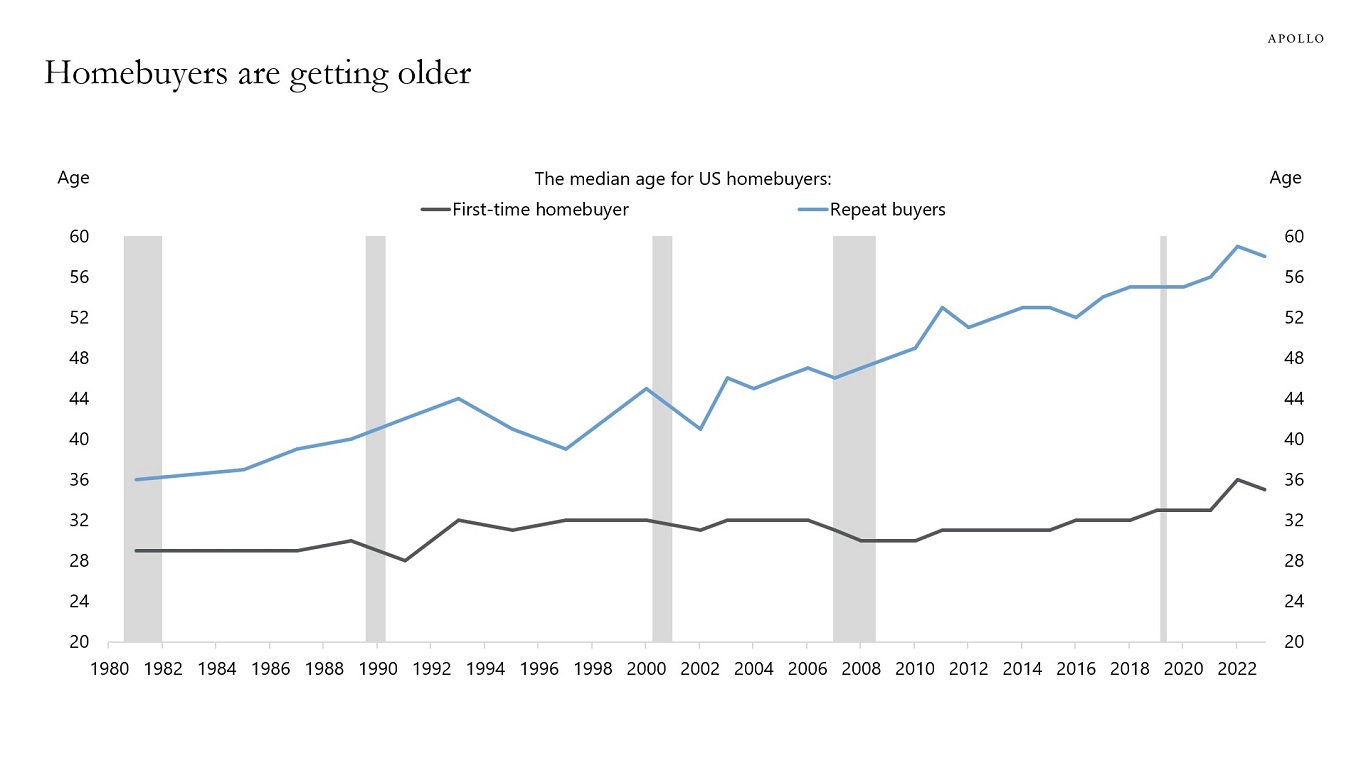
The median age of repeat homebuyers has increased from 36 years old in 1980 to 58 years old in 2023, see chart below.
And the median age of first-time homebuyers has increased from 29 to 35 over the same period.
Source: NAR, Apollo Chief Economist See important disclaimers at the bottom of the page.
-
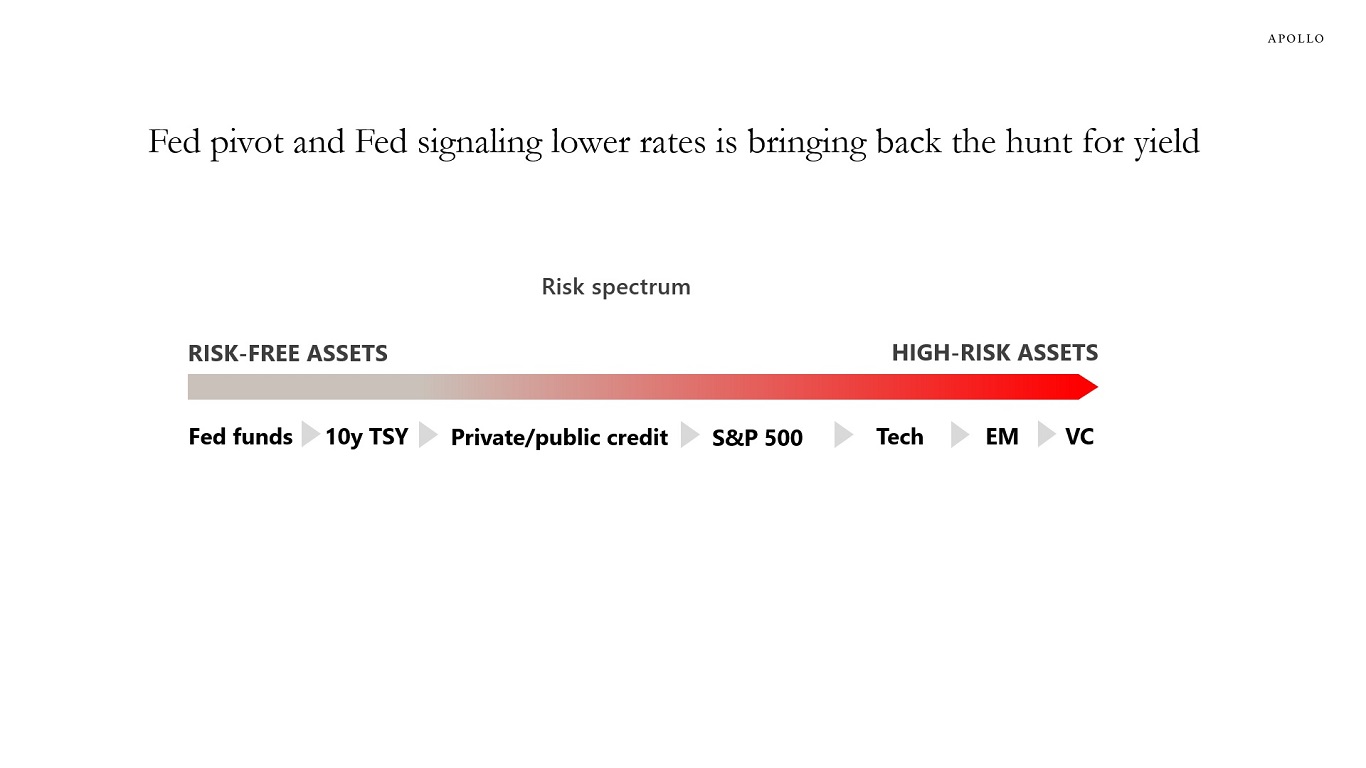
The Fed pivot has restarted the hunt for yield, see chart below. The question for markets is whether the associated rebound in housing, hiring, and capital markets activity will trigger a rebound in inflation.
Source: Apollo Chief Economist See important disclaimers at the bottom of the page.
-
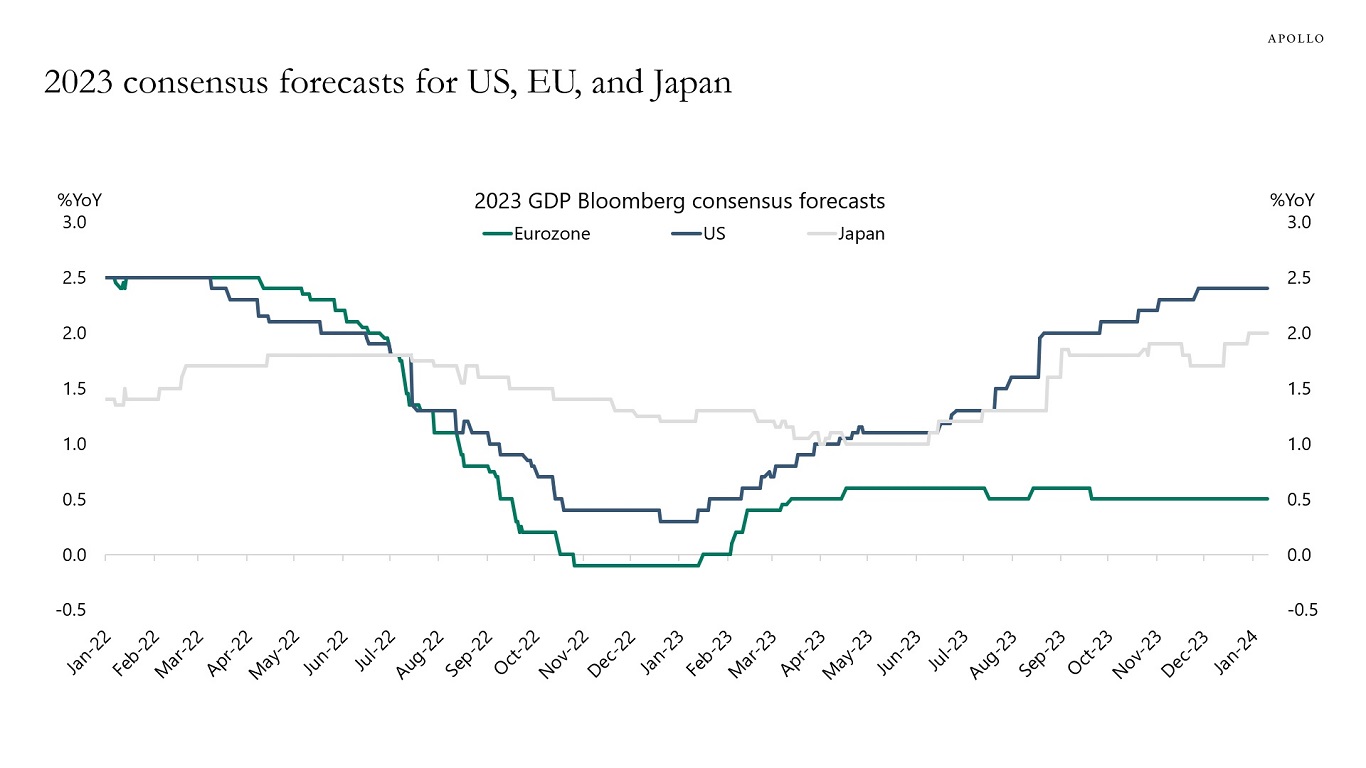
The story in markets in 2023 was that US growth expectations were first revised down and then revised up after the easing in financial conditions following SVB in March, see the first chart below.
With the significant easing in financial conditions since November, we are beginning to see the same pattern in 2024, see the second chart.
The performance has been different in Japan and Europe, where growth expectations have been steady in Japan and revised significantly lower in Europe.
In other words, the lack of a slowdown in 2023, which surprised the Fed, the consensus, and markets, was only a US story, and we are starting to see the same pattern play out again in 2024.
Source: Bloomberg, Apollo Chief Economist 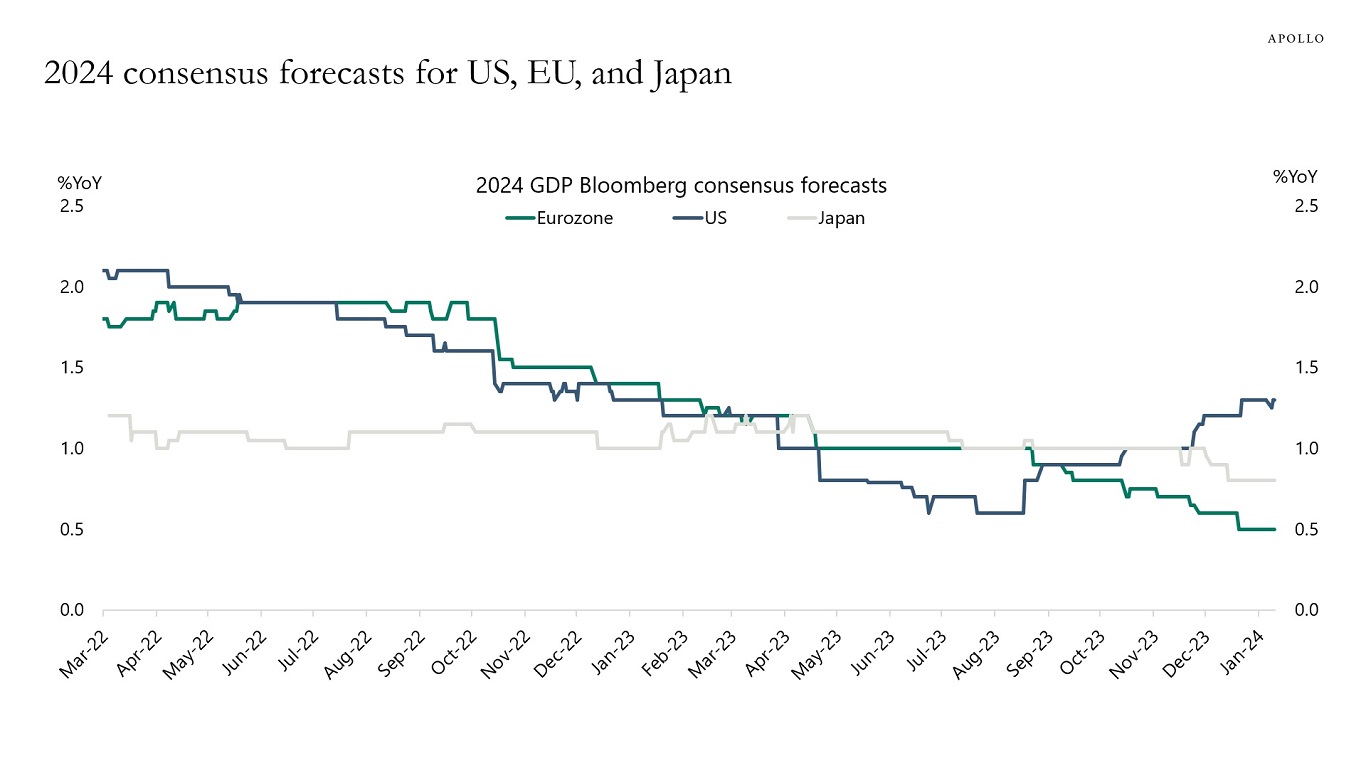
Source: Bloomberg, Apollo Chief Economist See important disclaimers at the bottom of the page.

This presentation may not be distributed, transmitted or otherwise communicated to others in whole or in part without the express consent of Apollo Global Management, Inc. (together with its subsidiaries, “Apollo”).
Apollo makes no representation or warranty, expressed or implied, with respect to the accuracy, reasonableness, or completeness of any of the statements made during this presentation, including, but not limited to, statements obtained from third parties. Opinions, estimates and projections constitute the current judgment of the speaker as of the date indicated. They do not necessarily reflect the views and opinions of Apollo and are subject to change at any time without notice. Apollo does not have any responsibility to update this presentation to account for such changes. There can be no assurance that any trends discussed during this presentation will continue.
Statements made throughout this presentation are not intended to provide, and should not be relied upon for, accounting, legal or tax advice and do not constitute an investment recommendation or investment advice. Investors should make an independent investigation of the information discussed during this presentation, including consulting their tax, legal, accounting or other advisors about such information. Apollo does not act for you and is not responsible for providing you with the protections afforded to its clients. This presentation does not constitute an offer to sell, or the solicitation of an offer to buy, any security, product or service, including interest in any investment product or fund or account managed or advised by Apollo.
Certain statements made throughout this presentation may be “forward-looking” in nature. Due to various risks and uncertainties, actual events or results may differ materially from those reflected or contemplated in such forward-looking information. As such, undue reliance should not be placed on such statements. Forward-looking statements may be identified by the use of terminology including, but not limited to, “may”, “will”, “should”, “expect”, “anticipate”, “target”, “project”, “estimate”, “intend”, “continue” or “believe” or the negatives thereof or other variations thereon or comparable terminology.