


Want it delivered daily to your inbox?
-
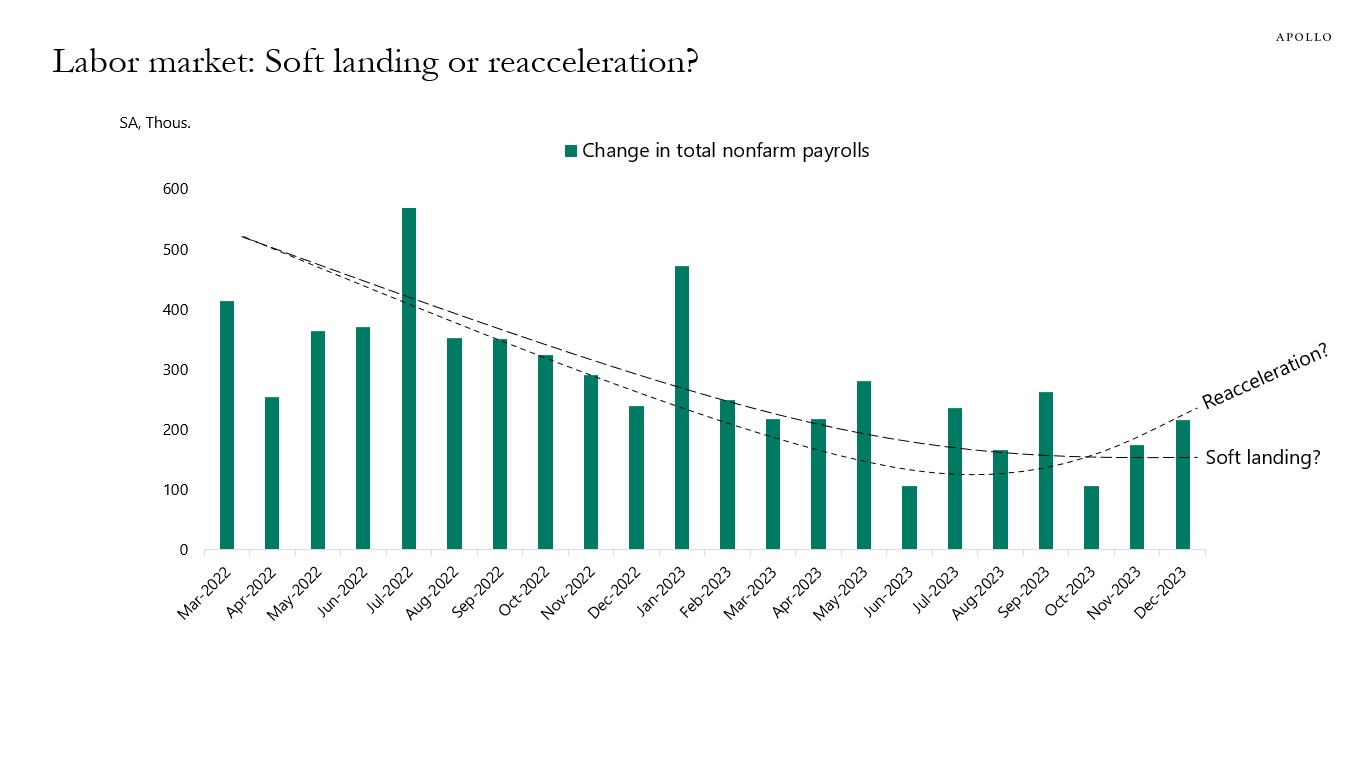
Looking at job growth since the Fed began to hike raises questions about whether the labor market is undergoing a soft landing or reacceleration, see the first chart below.
The split between the goods sector and the private service sector shows what looks like a soft landing in the goods sector and a reacceleration in the private service sector, see the second and third charts.
The no landing in services is consistent with ongoing strong demand for airlines, hotels, restaurants, concerts, and sporting events.
With the service sector making up 72% of total employment and generally less sensitive to Fed hikes, and with jobless claims still at very low levels, the upside risks to employment over the coming months are significant.
Source: BLS, Haver Analytics, Apollo Chief Economist 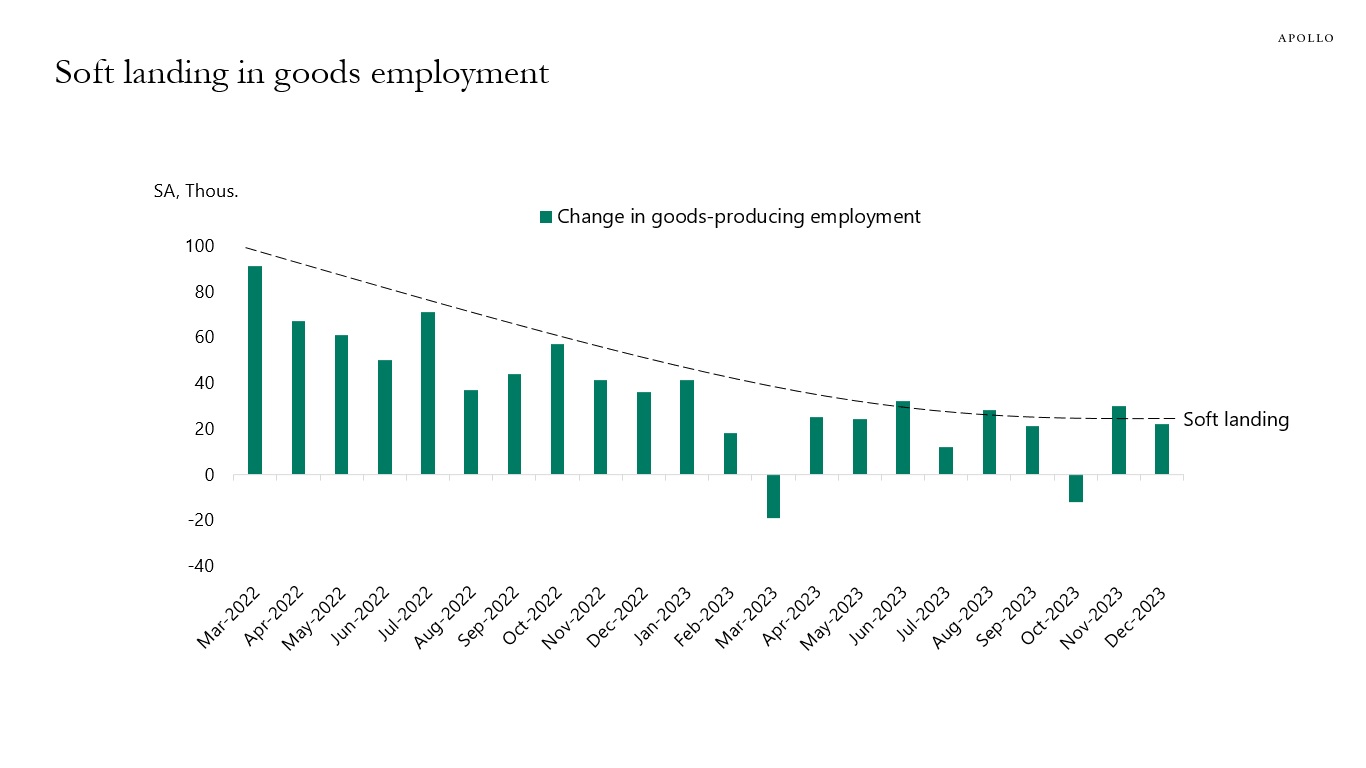
Source: BLS, Haver Analytics, Apollo Chief Economist 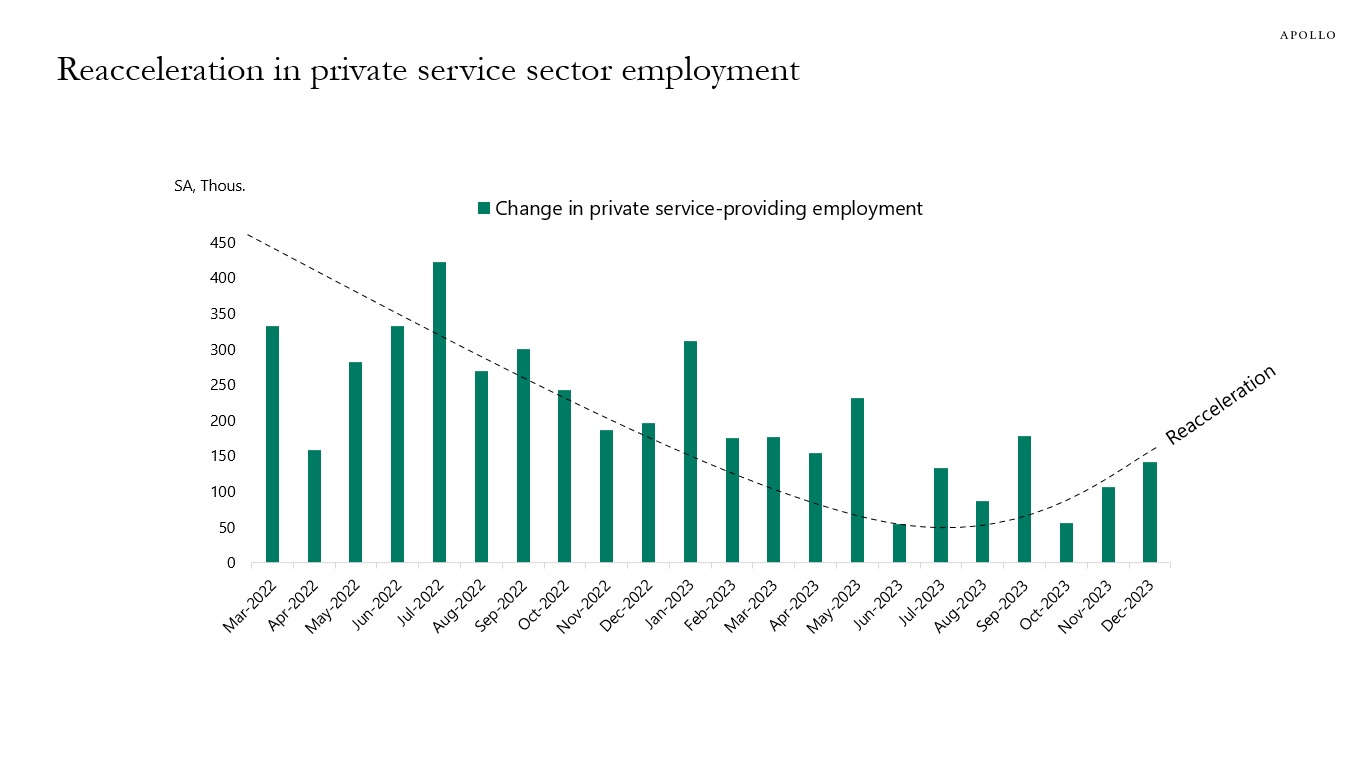
Source: BLS, Haver Analytics, Apollo Chief Economist See important disclaimers at the bottom of the page.
-
There is an ongoing debate about how core PCE inflation could come down from 5.5% to 3.2% without a slowdown in the economy, but this debate ignores that the cyclical components of GDP, including housing, have slowed sharply as a result of Fed hikes, and the non-cyclical components have continued to see strong growth in particular with strong post-Covid tailwinds to restaurants, hotels, and airlines.
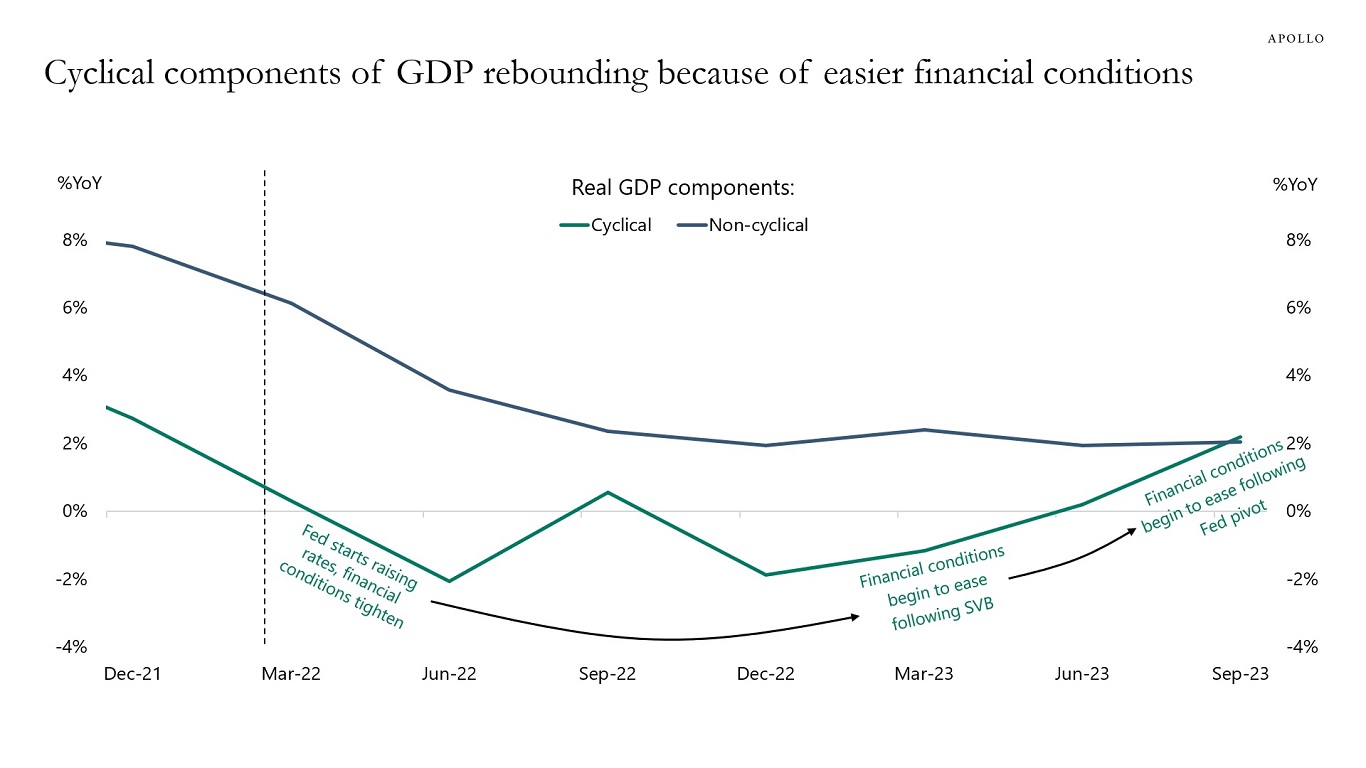
The cyclical components of GDP are the interest rate-sensitive components such as housing, capex, and durable goods, and these parts of the economy slowed significantly when the Fed started raising rates, see chart below.
Put differently, it is misleading to say that Fed hikes have not had any negative impact on the economy. Fed hikes had a very negative effect on the interest rate-sensitive parts of the economy, most notably housing, and the result was a decline in housing inflation. With housing having a 40% weight in the CPI basket, the result was a decline in headline and core inflation for both CPI and PCE.
So why did the economy not slow down more, and why did Fed hikes not result in a rise in unemployment? There are two reasons.
First, the post-Covid economy saw surprising strength in the non-cyclical components of the economy, such as eating at restaurants, staying at hotels, and flying on airplanes, etc. Consumers wanted to travel, go to concerts and sporting events after Covid, and this has kept consumer spending strong.
Second, financial conditions eased significantly following SVB, and this boosted GDP growth to 4.9% in the third quarter of 2023. Similarly, the rally in the stock market, credit markets, and Treasury markets since October and after the Fed pivot in December have also eased financial conditions significantly, likely boosting the cyclical components of GDP over the coming months.
As the chart below shows, the bottom line is that the non-cyclical components continue to grow steadily because of post-Covid strong demand for consumer services, and the cyclical components are rebounding because of easier financial conditions.
The likely scenario is that the economy will reaccelerate over the coming months, which will put renewed upward pressure on inflation and, hence, bring back a more hawkish Fed.
In short, the Fed is not done fighting inflation, and, as a result, it is too early to argue that this is a soft landing because both the cyclical and non-cyclical components of GDP are likely to be solid over the coming months, see again the chart below.
Source: BEA, Haver Analytics, Apollo Chief Economist. Note: Cyclical components include interest-sensitive components, i.e., durable goods consumption, nonresidential structures, equipment investment, and residential investment. Non-cyclical components include non-durable goods consumption, services consumption, and nonresidential investment in intellectual property products. See important disclaimers at the bottom of the page.
-
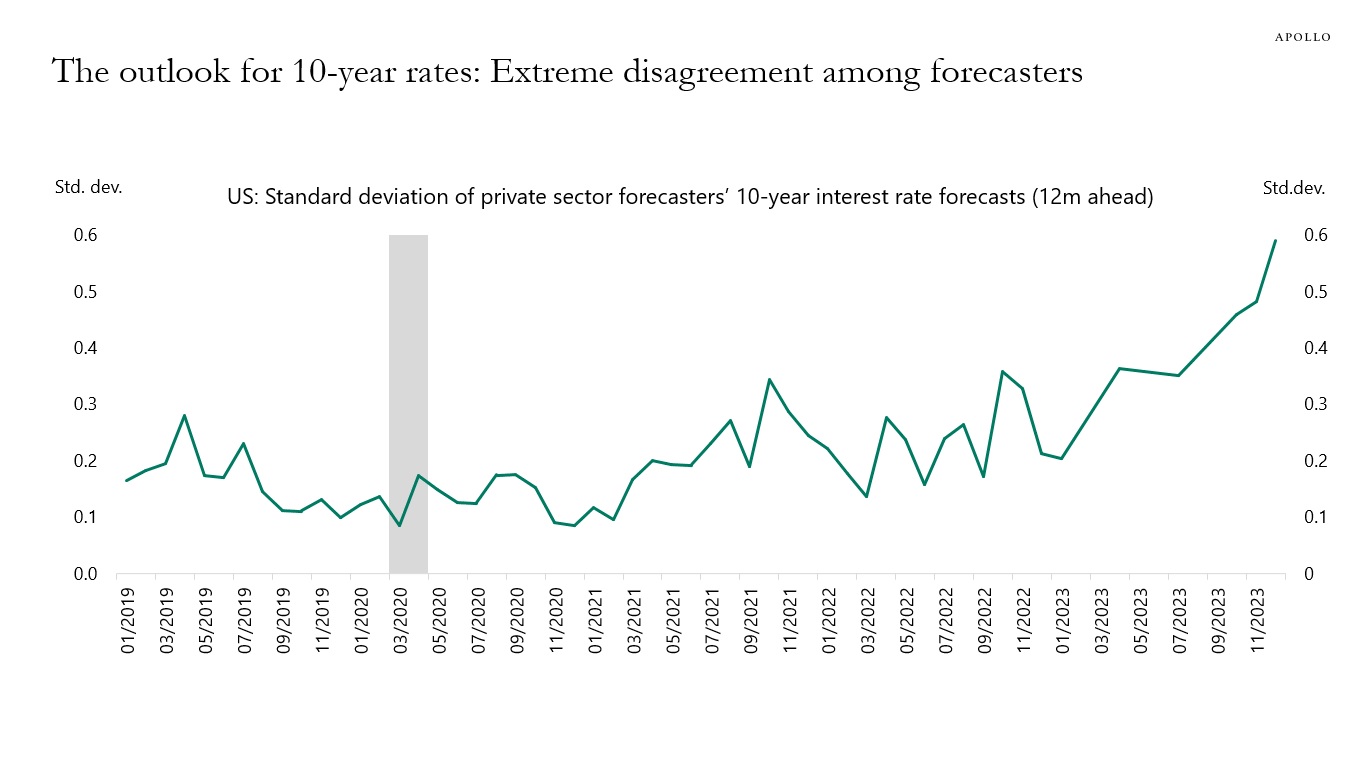
Some forecasters are currently predicting that 10-year rates will end the year above 5%, others are predicting a level below 3%, and the chart below shows the standard deviation of the 12-month ahead forecast for 10-year Treasury yields for 26 private sector forecasters since 2019.
The rising trend in the standard deviation of forecasts shows a very high level of disagreement among forecasters about what will happen to long-term interest rates in 2024.
This is not surprising because some would argue that a soft landing with Fed cuts and lower inflation would result in lower long-term interest rates.
Others would argue that a soft landing with no recession and the risk of reacceleration will push rates higher.
On a different note, others would argue that the key driver of rates in 2024 will be a higher term premium, driven by the coming massive increase in the supply of Treasuries.
What is most remarkable about the high level of disagreement among forecasters is that the same elevated level of uncertainty is entirely absent in the MOVE Index and the VIX Index.
The bottom line is that we have a busy year ahead of us in markets with extreme disagreement about the forces driving longer-term interest rates.
Source: Bloomberg, Apollo Chief Economist. (Note: We calculated standard deviation of individual analyst’s forecast for 12 months ahead for every month starting January 2019. The list of contributors in our calculation: UBS, Citigroup, HSBC holdings, Wells Fargo & Co, University Of Texas At El Paso, RBC Financial Group, Natixis SA, Naroff Economic Advisors, Mortgage Bankers Association, MacroFin Analytics LLC, Kasikornbank PCL, ING Groep NV, First Trust Advisors LP, Fannie Mae, Desjardins Securities Inc, Dai-ichi Life Research Institute Inc, Commerzbank, Action Economics, ABN Amro, Bank of Montreal, TD securities, Nomura, Barclays, Goldman Sachs, Bank of America, and Hamburg Commercial Bank AG.) See important disclaimers at the bottom of the page.
-
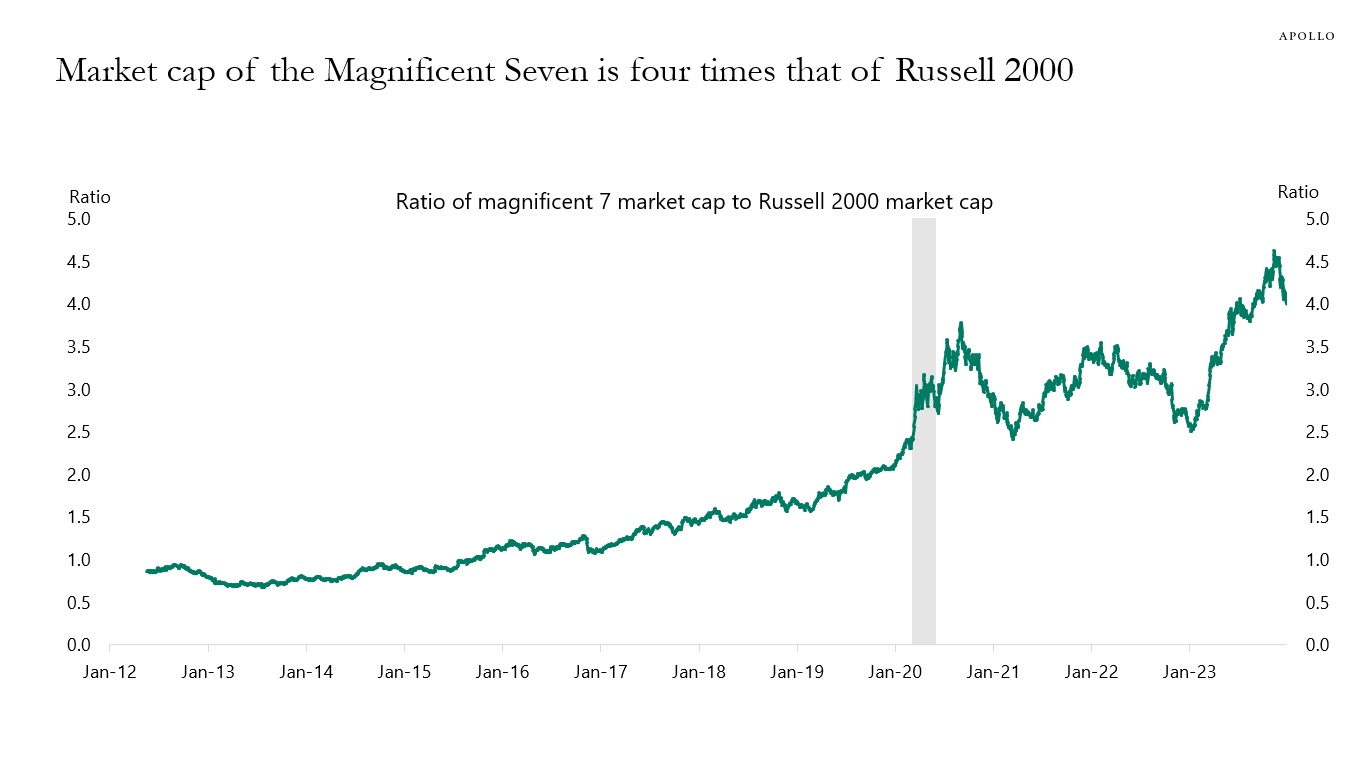
The market cap of the Magnificent Seven is now four times the market cap of the entire Russell 2000, see the first chart below.
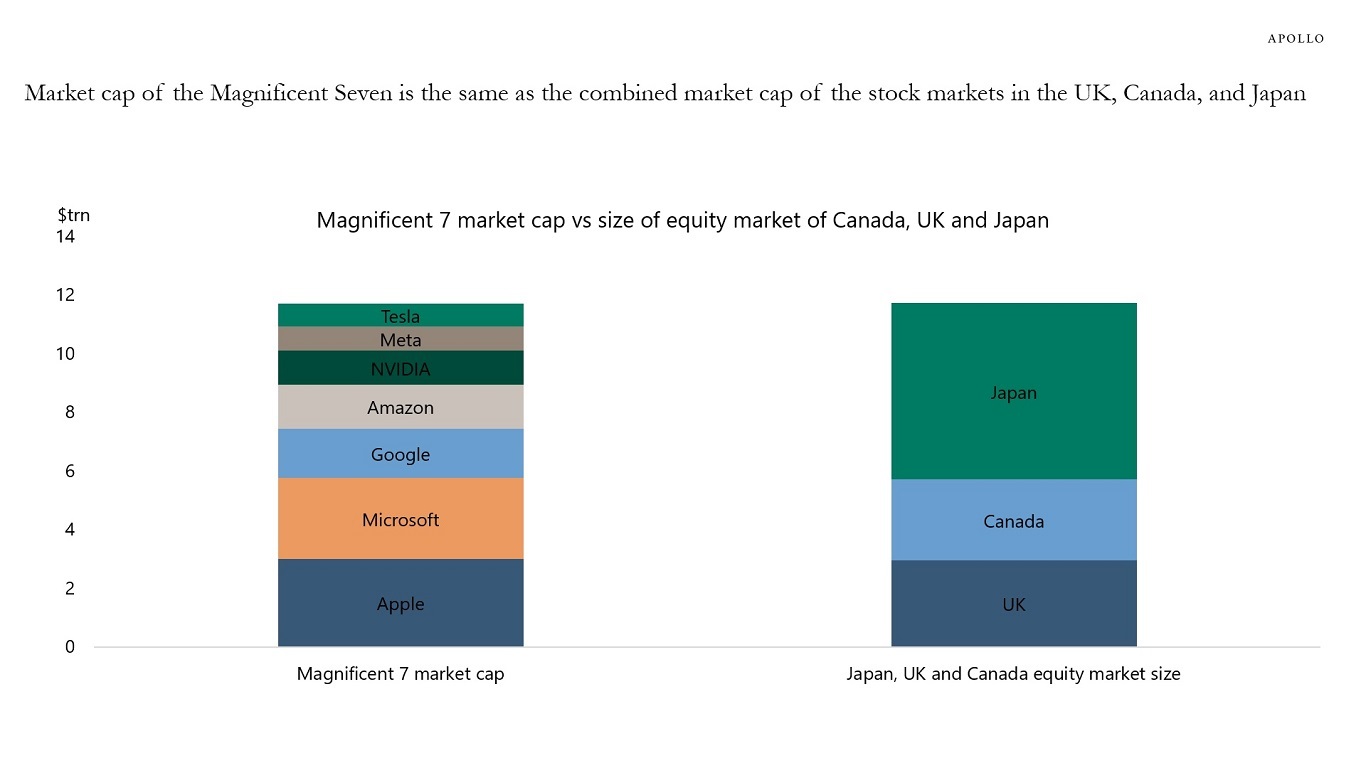
And the market cap of the Magnificent Seven is the same size as the market cap of the stock markets in the UK, Canada, and Japan combined, see the second chart below.
Microsoft alone is the size of the entire stock market in Canada.
Source: Bloomberg, Apollo Chief Economist 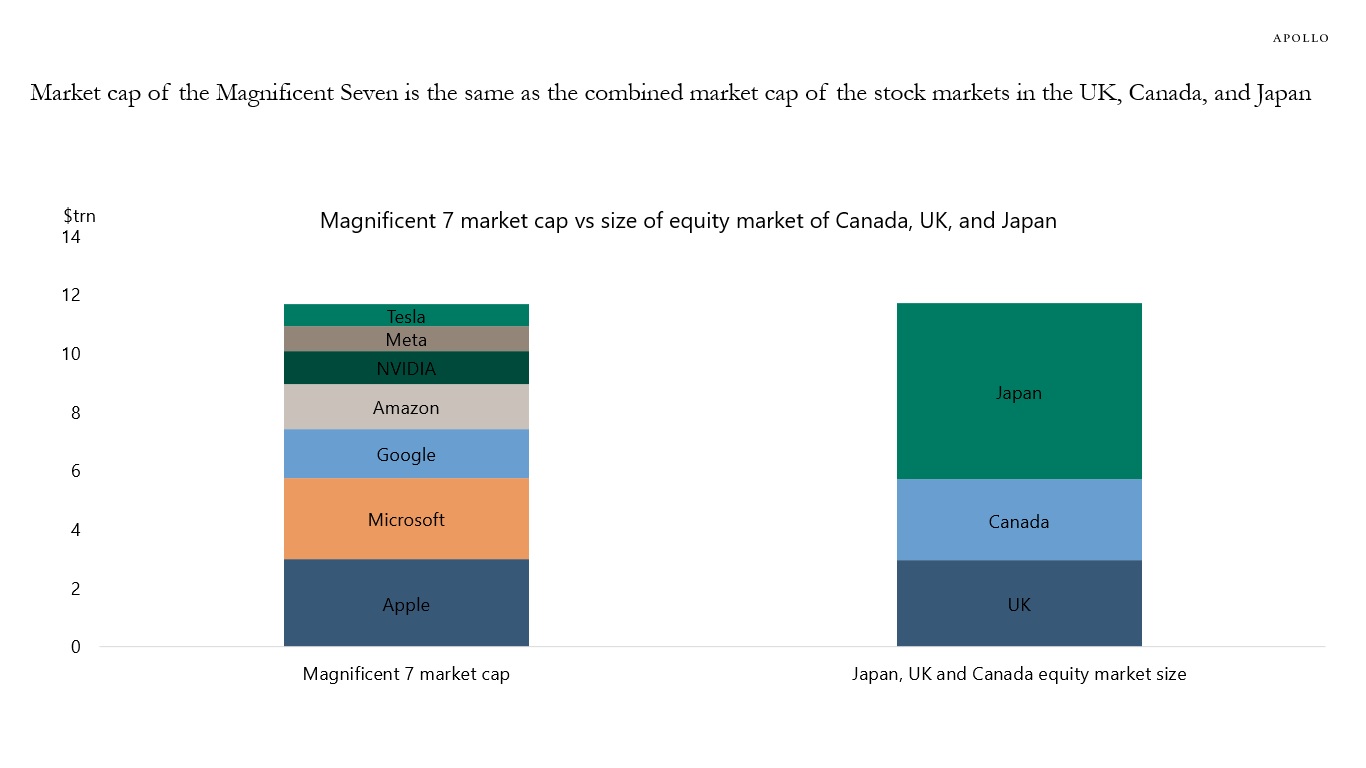
Source: Bloomberg, Apollo Chief Economist See important disclaimers at the bottom of the page.
-
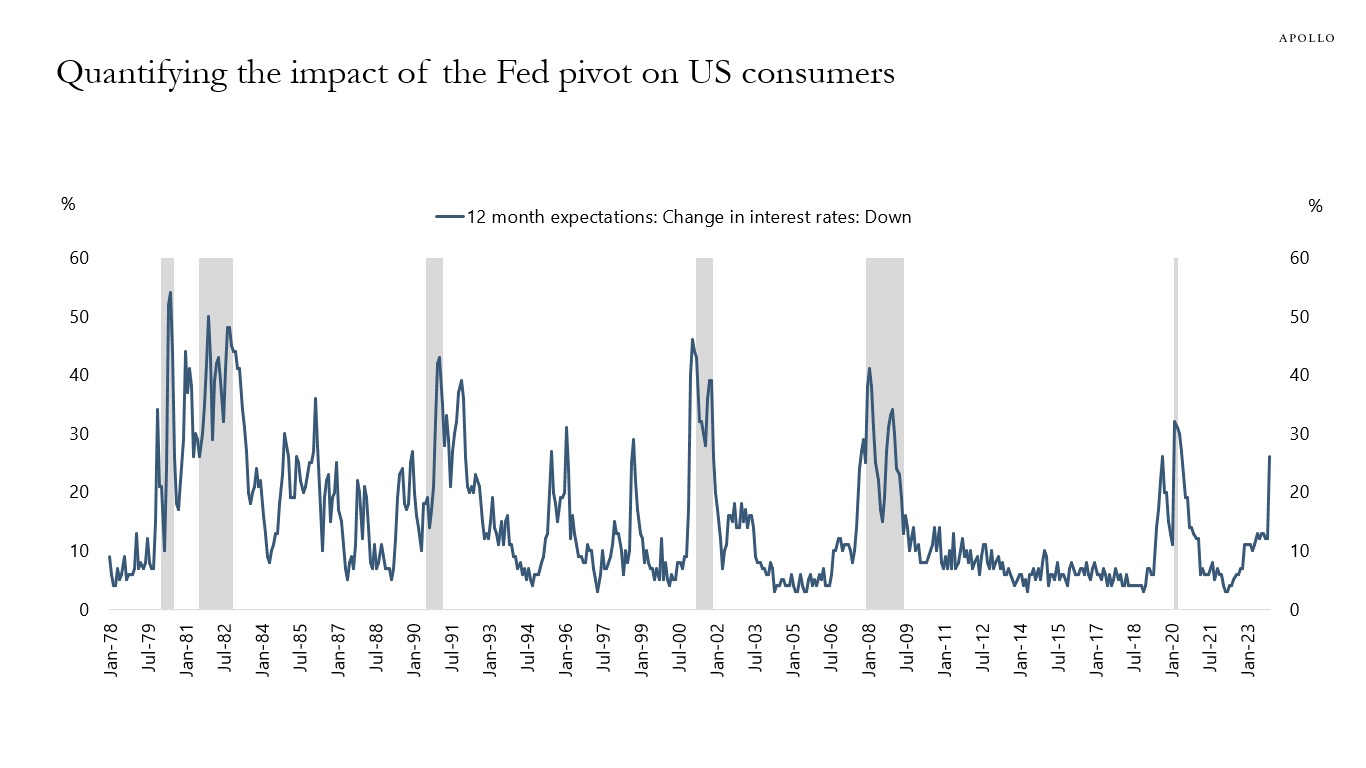
Data covering the period after the Fed pivot shows that US consumers significantly changed their expectations to interest rates after the December FOMC meeting. Specifically, the share of consumers expecting interest rates to go down jumped to levels last seen during the pandemic and during the financial crisis in 2008, see chart below. With almost 30% of households expecting interest rates to go down, it would make sense if consumers now start borrowing and spending at a faster pace.
Source: U. of Michigan Survey, Haver Analytics, Apollo Chief Economist See important disclaimers at the bottom of the page.
-
Fed cuts and lower costs of capital could boost private markets in 2024. Our latest chart book is available here.
See important disclaimers at the bottom of the page.
-
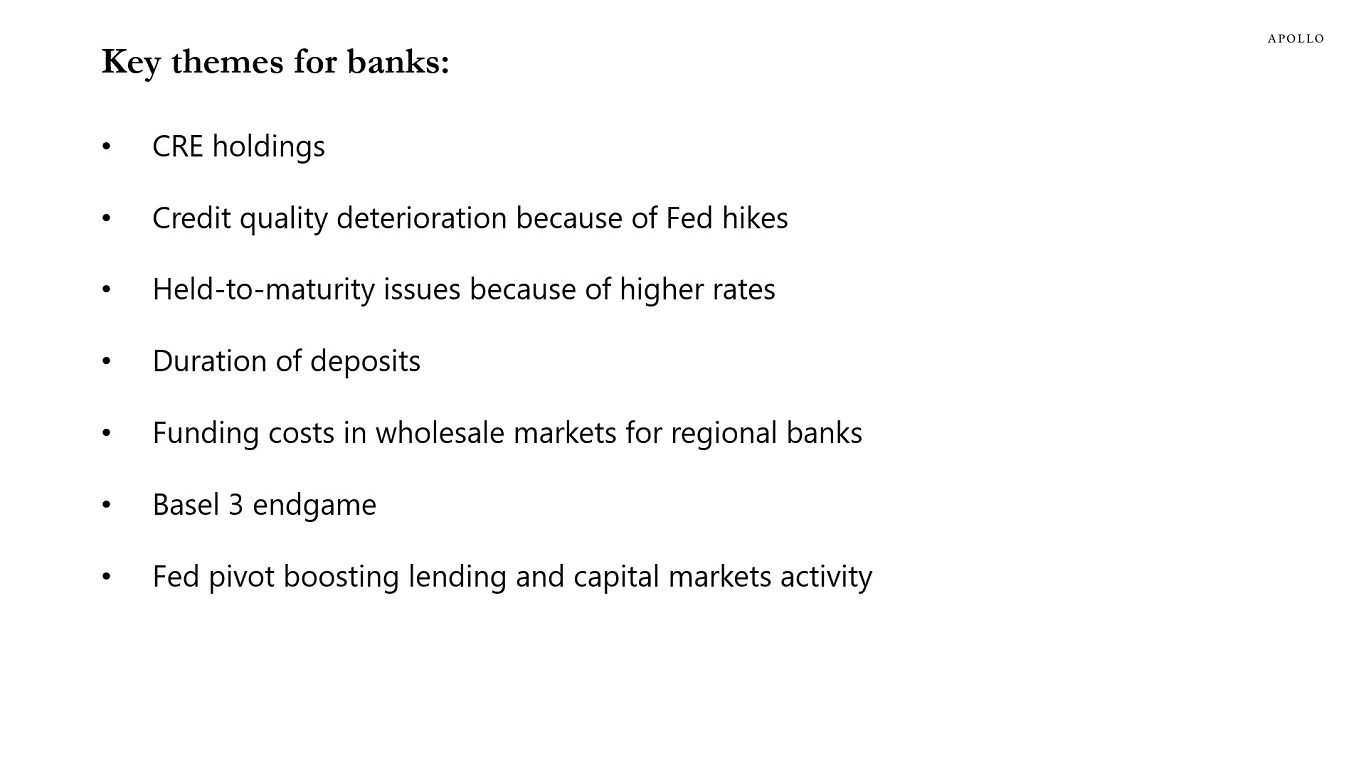
The banking sector is facing a number of headwinds from a 40% decline in the price per square foot for office because of higher interest rates and more people working from home, $3 trillion in CRE holdings, and $684 billion in unrealized losses on Treasuries and mortgages, see charts below. The net result is a continued decline in the weekly data for bank lending, see the last chart below.
Our latest banking sector chart book is available here.

Source: Apollo Chief Economist 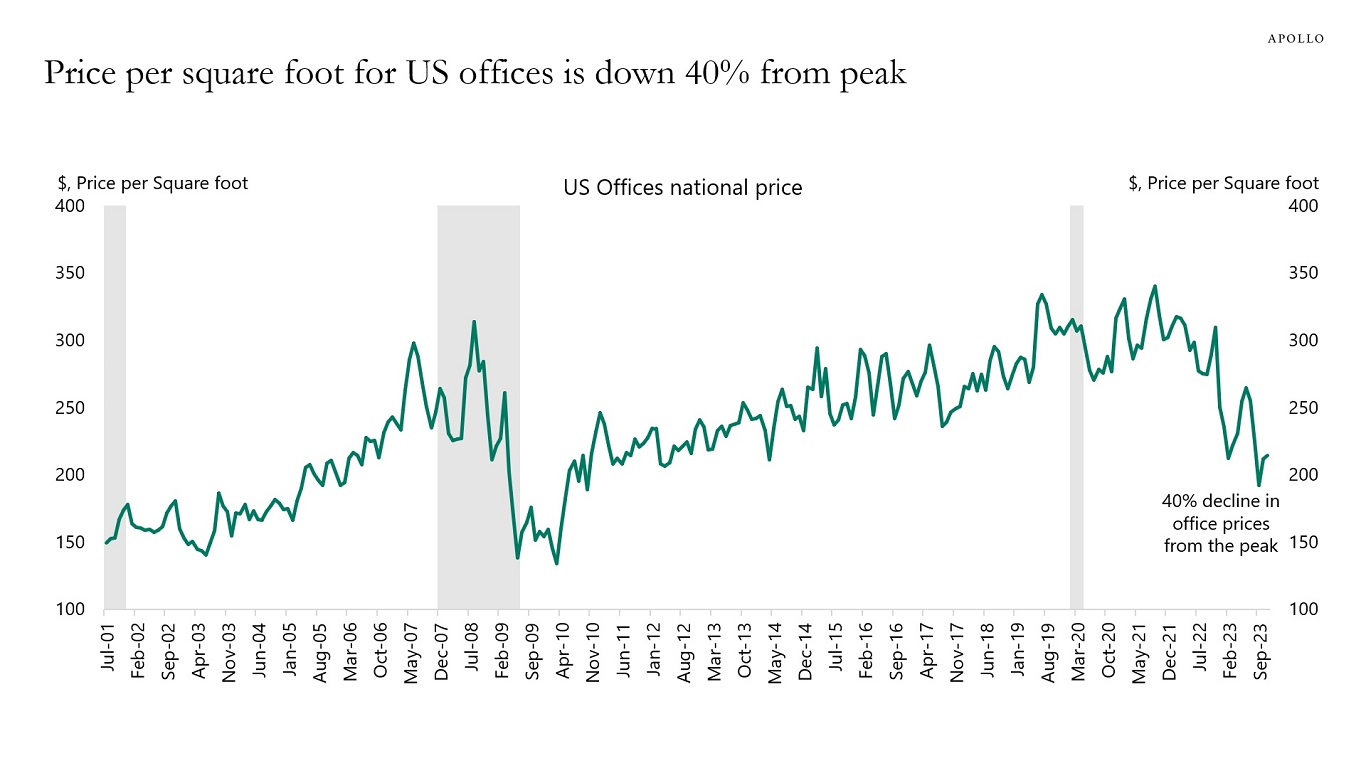
Source: RCA, Bloomberg, Apollo Chief Economist 
Source: REITS, BLS, Bloomberg, Apollo Chief Economist (Note: Office using employment includes professional and business services, Information and Financial activities) 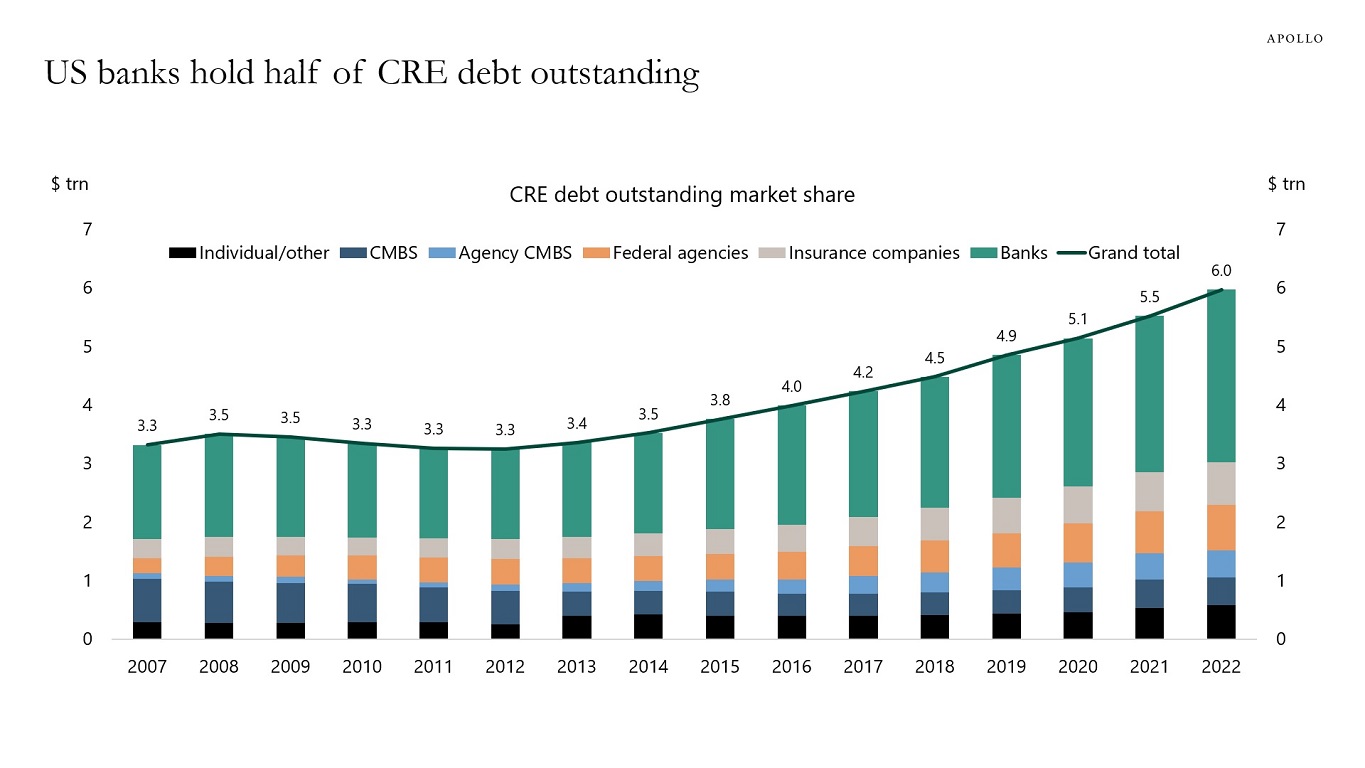
Source: S&P Capital IQ, Apollo Chief Economist 
Source: FDIC, Apollo Chief Economist 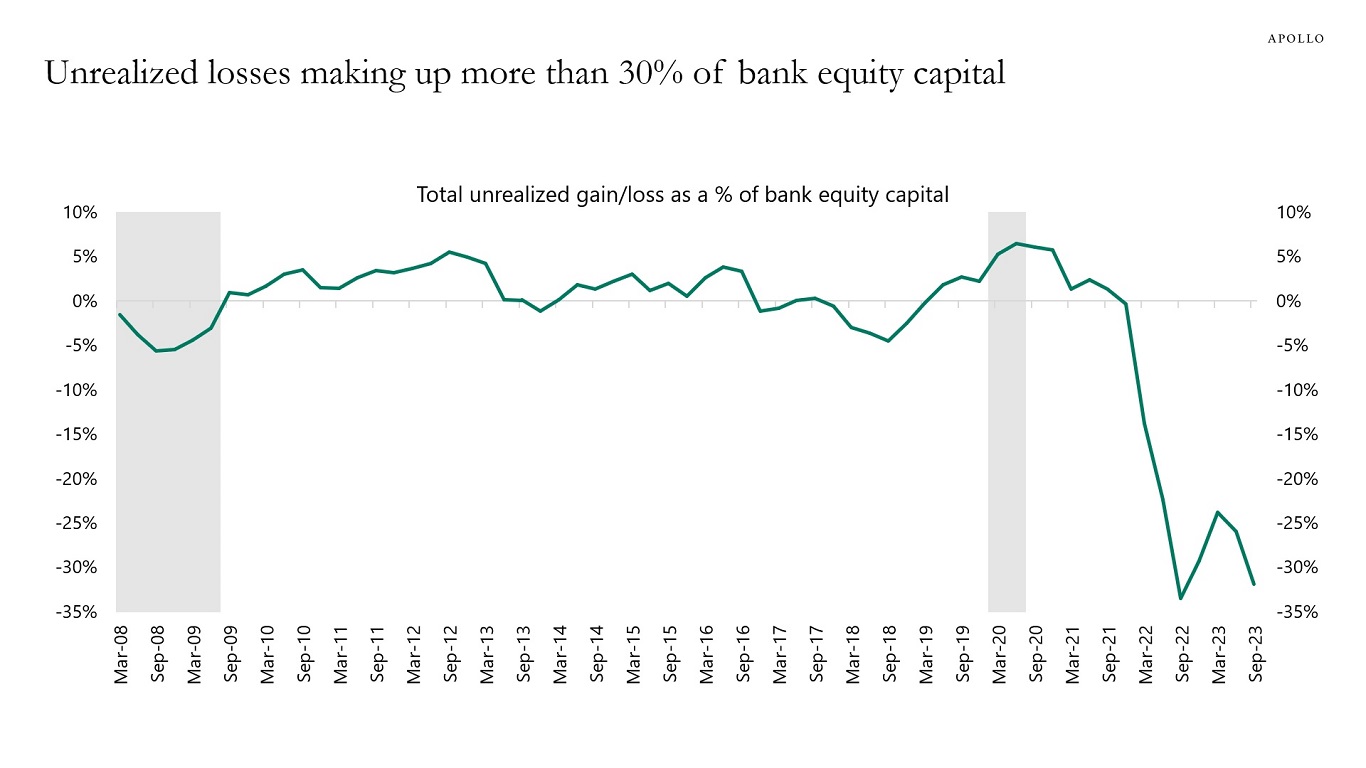
Source: FDIC, Haver Analytics, Apollo Chief Economist 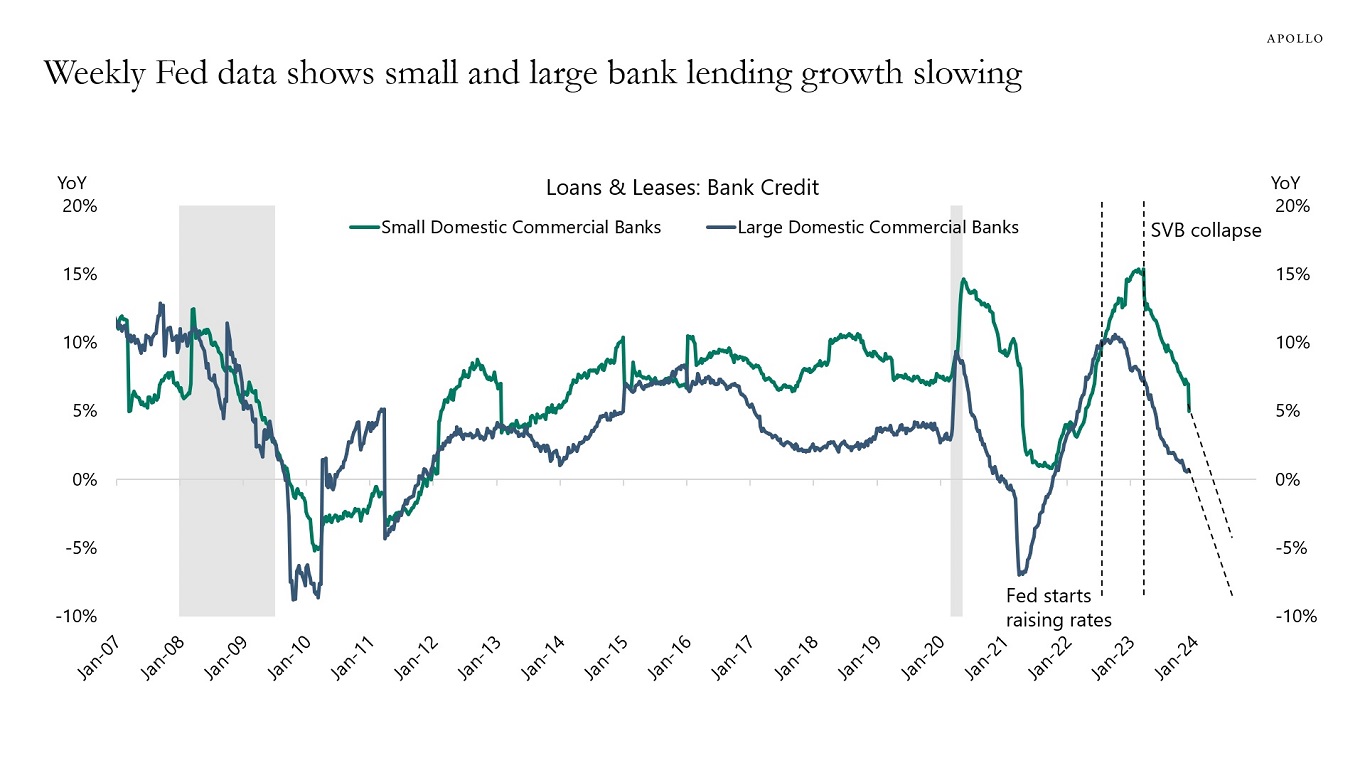
Source: Federal Reserve Board, Haver Analytics, Apollo Chief Economist See important disclaimers at the bottom of the page.
-
Recent issuance in IG, HY, and loans has focused on refinancing and general corporate purpose (GCP), but after the Fed pivot, we are likely to see an increase in M&A activity in 2024 driven by lower cost of capital and pent-up M&A, see charts below. Our latest credit market outlook is available here.
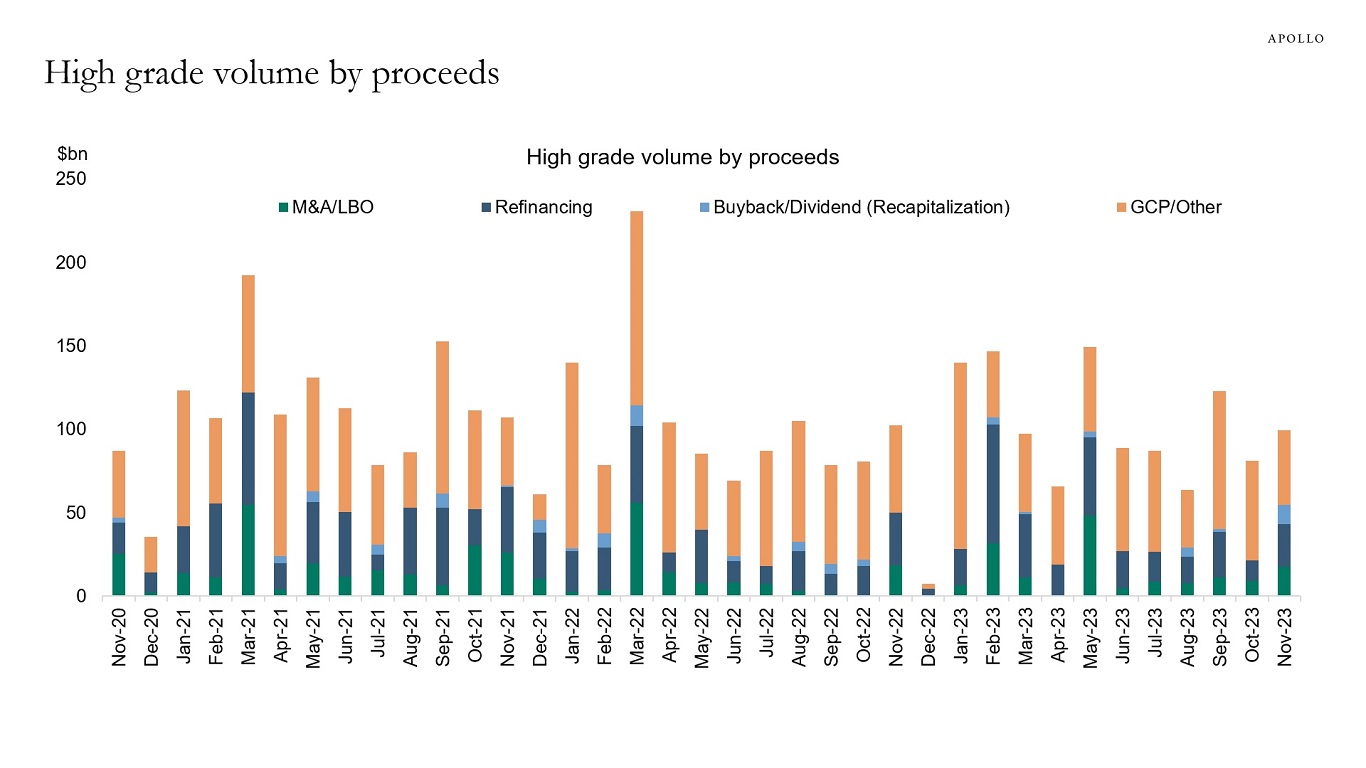
Source: Pitchbook LCD, Apollo Chief Economist. Note: GCP means General Corporate Purpose, which means making or financing any payment for working capital, capital expenditures, or any other general corporate purpose. 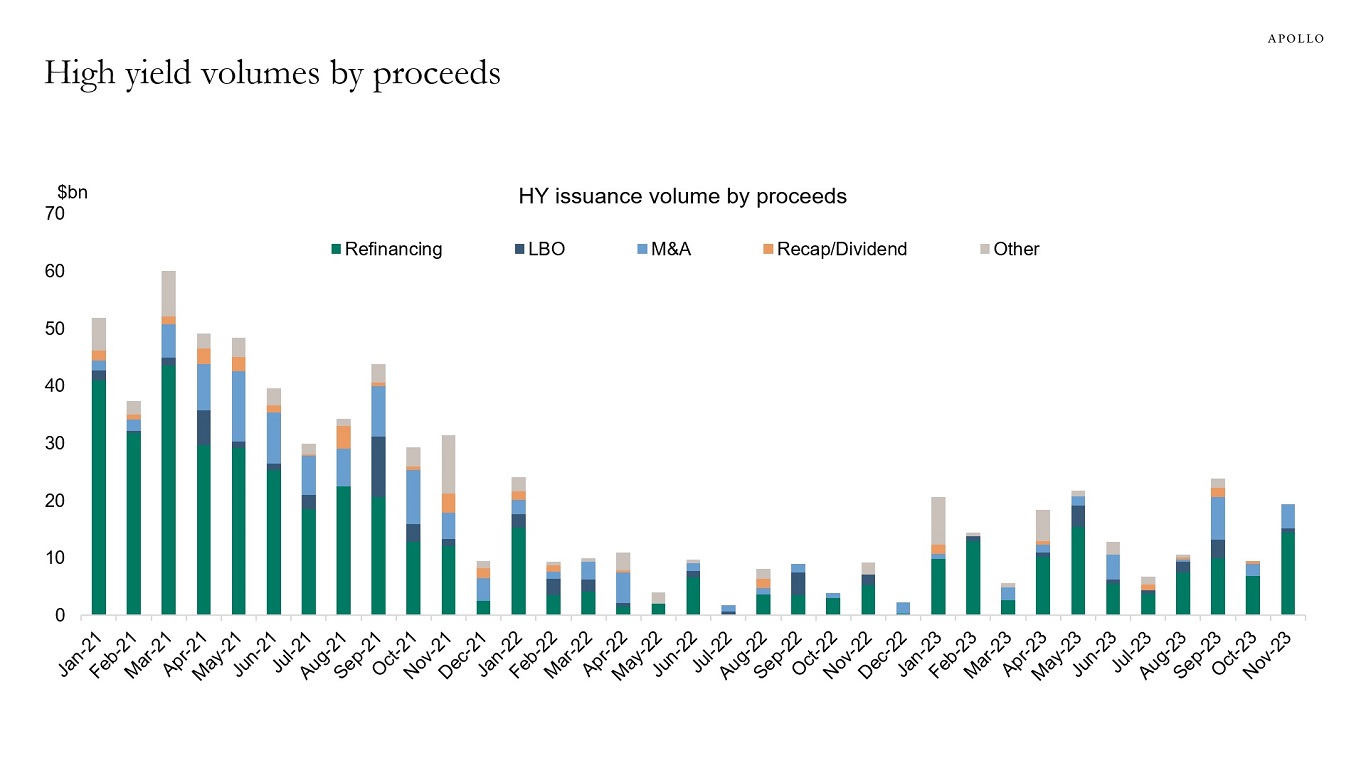
Source: Pitchbook LCD, Apollo Chief Economist 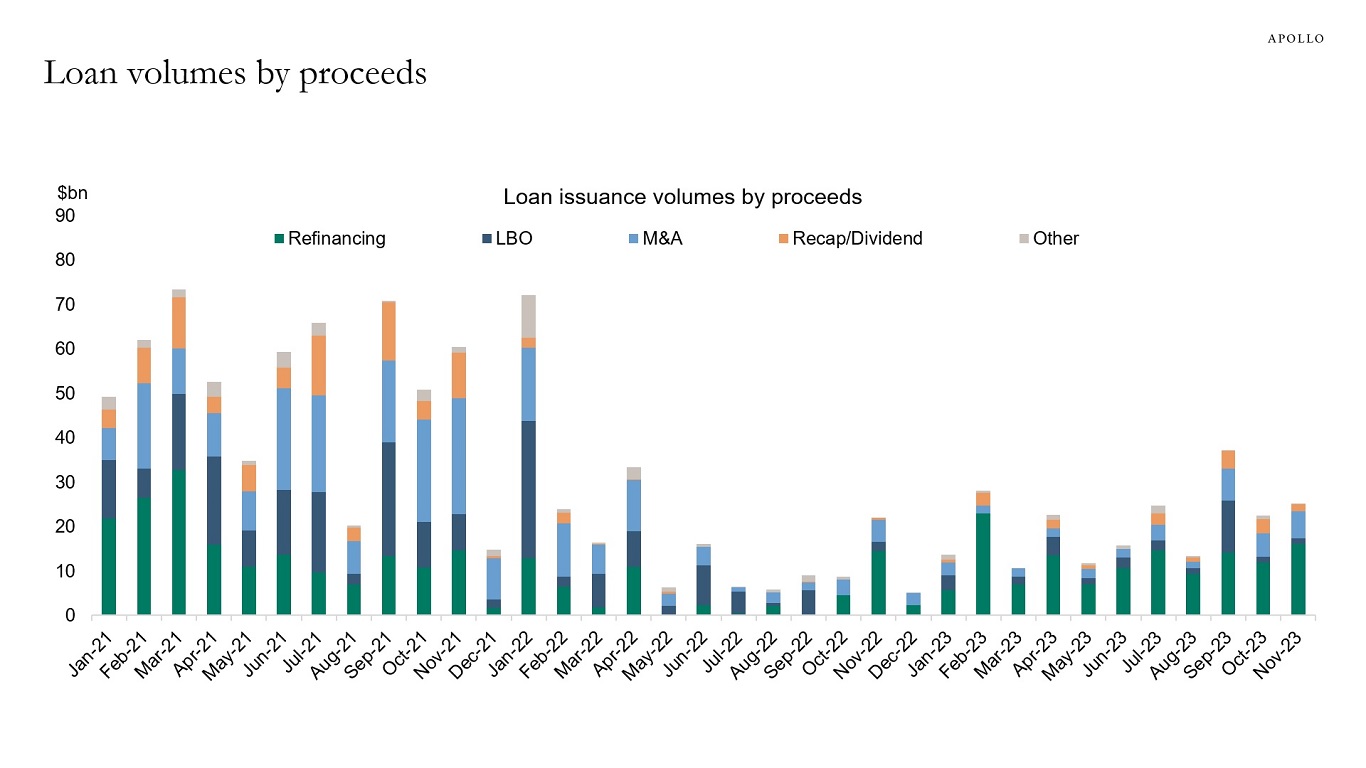
Source: Pitchbook LCD, Apollo Chief Economist See important disclaimers at the bottom of the page.
-
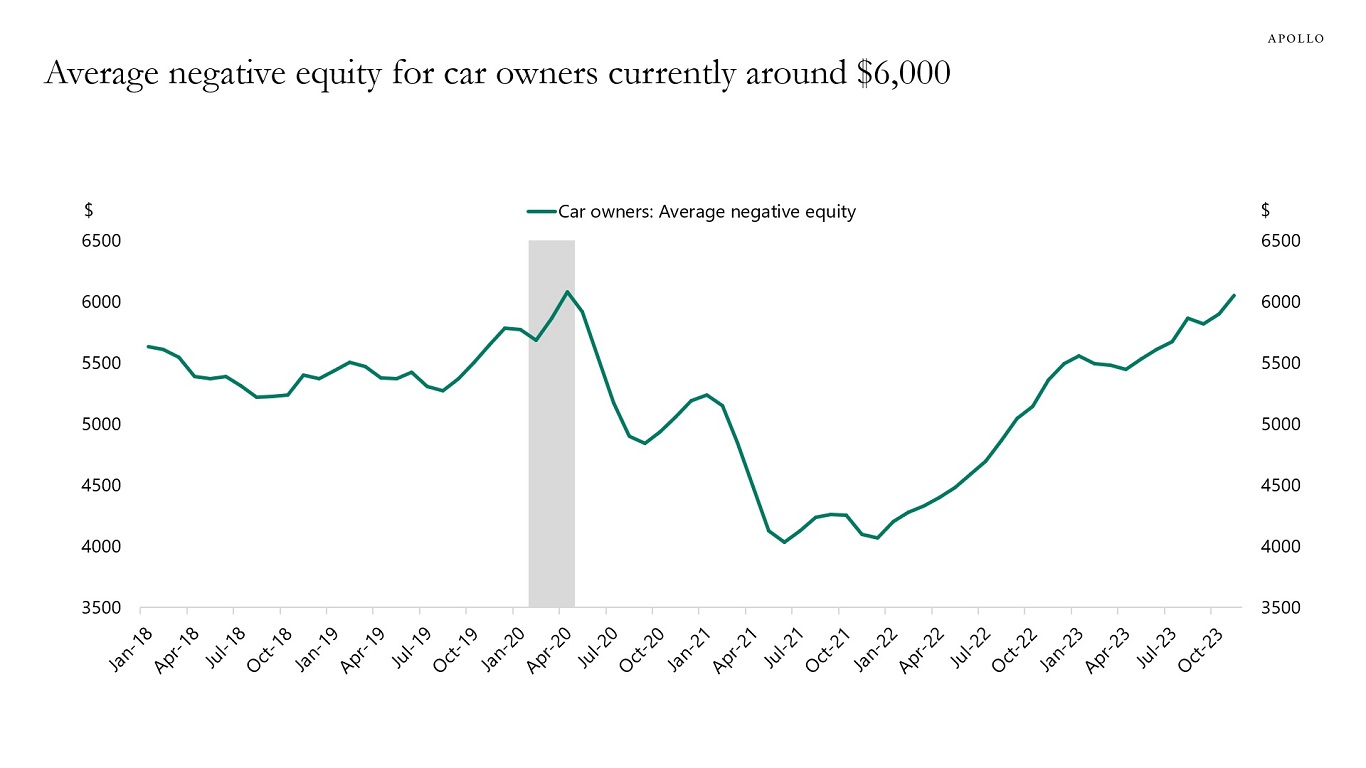
The average negative equity for car owners has continued to increase and is now higher than in 2019, see chart below.
Source: Bloomberg, Apollo Chief Economist See important disclaimers at the bottom of the page.
-
The market cap of the Magnificent Seven is now the same size as the combined market cap of the stock markets in Japan, Canada, and the UK, see chart below.
Source: Bloomberg, Apollo Chief Economist See important disclaimers at the bottom of the page.

This presentation may not be distributed, transmitted or otherwise communicated to others in whole or in part without the express consent of Apollo Global Management, Inc. (together with its subsidiaries, “Apollo”).
Apollo makes no representation or warranty, expressed or implied, with respect to the accuracy, reasonableness, or completeness of any of the statements made during this presentation, including, but not limited to, statements obtained from third parties. Opinions, estimates and projections constitute the current judgment of the speaker as of the date indicated. They do not necessarily reflect the views and opinions of Apollo and are subject to change at any time without notice. Apollo does not have any responsibility to update this presentation to account for such changes. There can be no assurance that any trends discussed during this presentation will continue.
Statements made throughout this presentation are not intended to provide, and should not be relied upon for, accounting, legal or tax advice and do not constitute an investment recommendation or investment advice. Investors should make an independent investigation of the information discussed during this presentation, including consulting their tax, legal, accounting or other advisors about such information. Apollo does not act for you and is not responsible for providing you with the protections afforded to its clients. This presentation does not constitute an offer to sell, or the solicitation of an offer to buy, any security, product or service, including interest in any investment product or fund or account managed or advised by Apollo.
Certain statements made throughout this presentation may be “forward-looking” in nature. Due to various risks and uncertainties, actual events or results may differ materially from those reflected or contemplated in such forward-looking information. As such, undue reliance should not be placed on such statements. Forward-looking statements may be identified by the use of terminology including, but not limited to, “may”, “will”, “should”, “expect”, “anticipate”, “target”, “project”, “estimate”, “intend”, “continue” or “believe” or the negatives thereof or other variations thereon or comparable terminology.