


Want it delivered daily to your inbox?
-
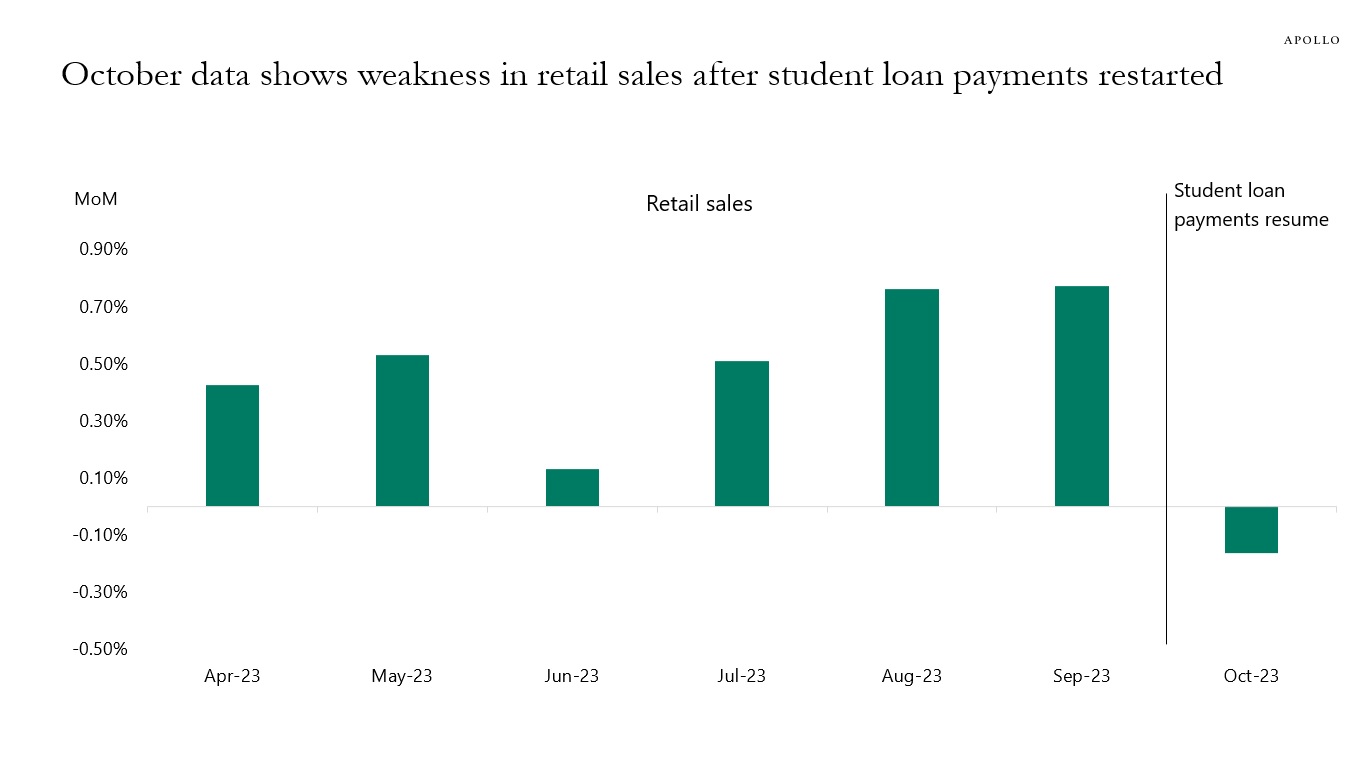
Our outlook for the US consumer is available here, there are two key conclusions:
1) The data for both retail sales and personal consumption expenditures for October have been weaker than expected, and the market is likely underestimating the negative impact of student loan payments resuming in October, see the first two charts below.
2) Since the Fed started raising interest rates, nominal consumer spending growth has continued to slow, see the third, fourth, and fifth charts. With the Fed in the process of getting inflation under control and job growth slowing, we should continue to see a steady slowdown in nominal growth rates in consumer spending and, therefore, in nominal GDP. The question for markets is whether we can get a soft landing in both nominal and real GDP. Nominal GDP will come down as inflation comes down, but the risk remains that real GDP (i.e., volumes) will come down faster than the consensus currently expects.
Source: Census Bureau, Haver Analytics, Apollo Chief Economist 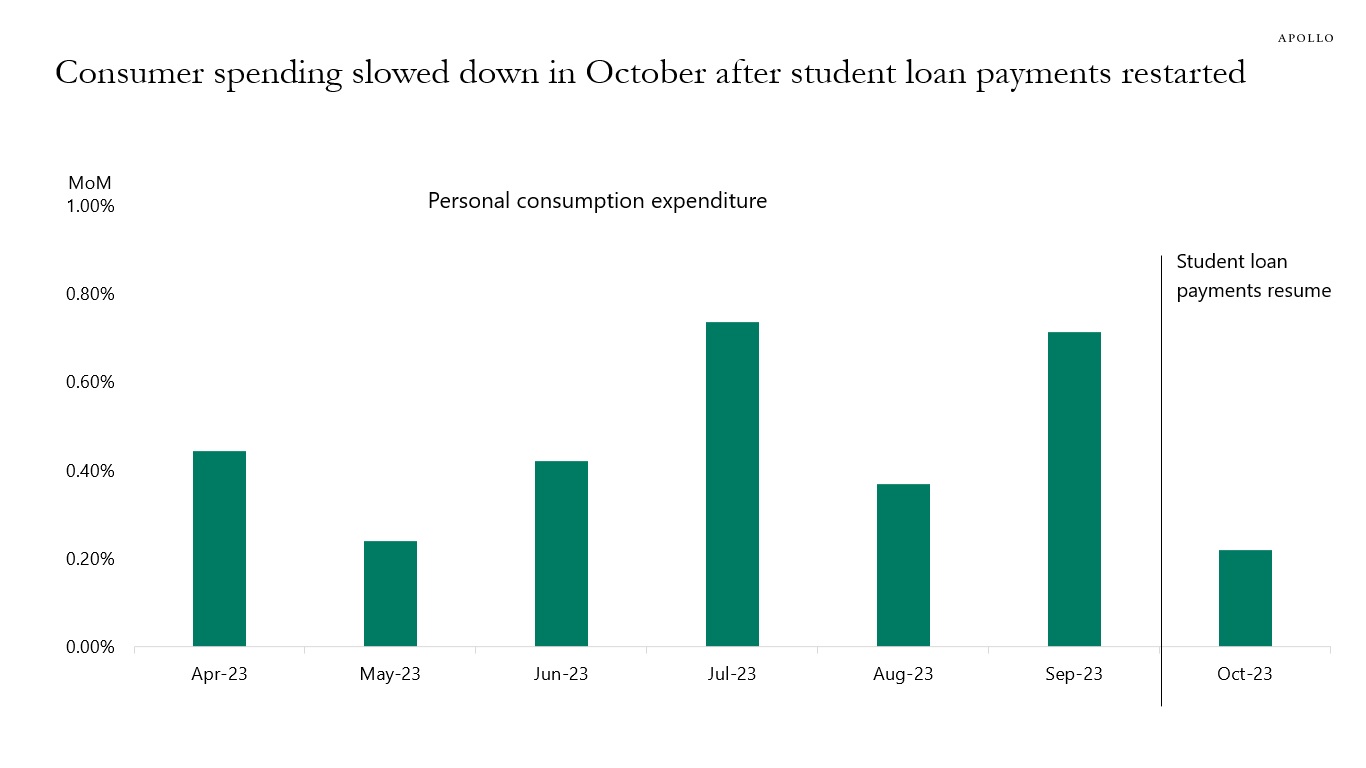
Source: BEA, Haver Analytics, Apollo Chief Economist 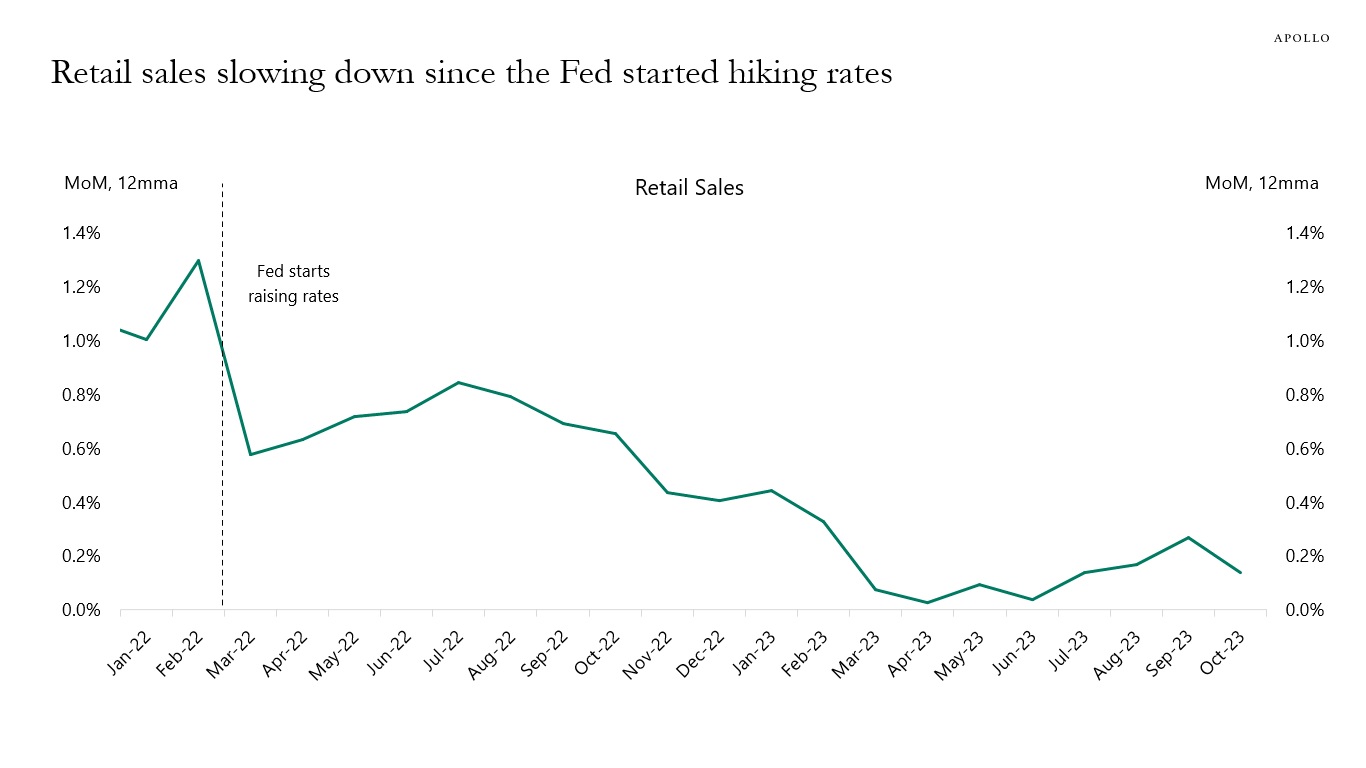
Source: Census Bureau, Haver Analytics, Apollo Chief Economist 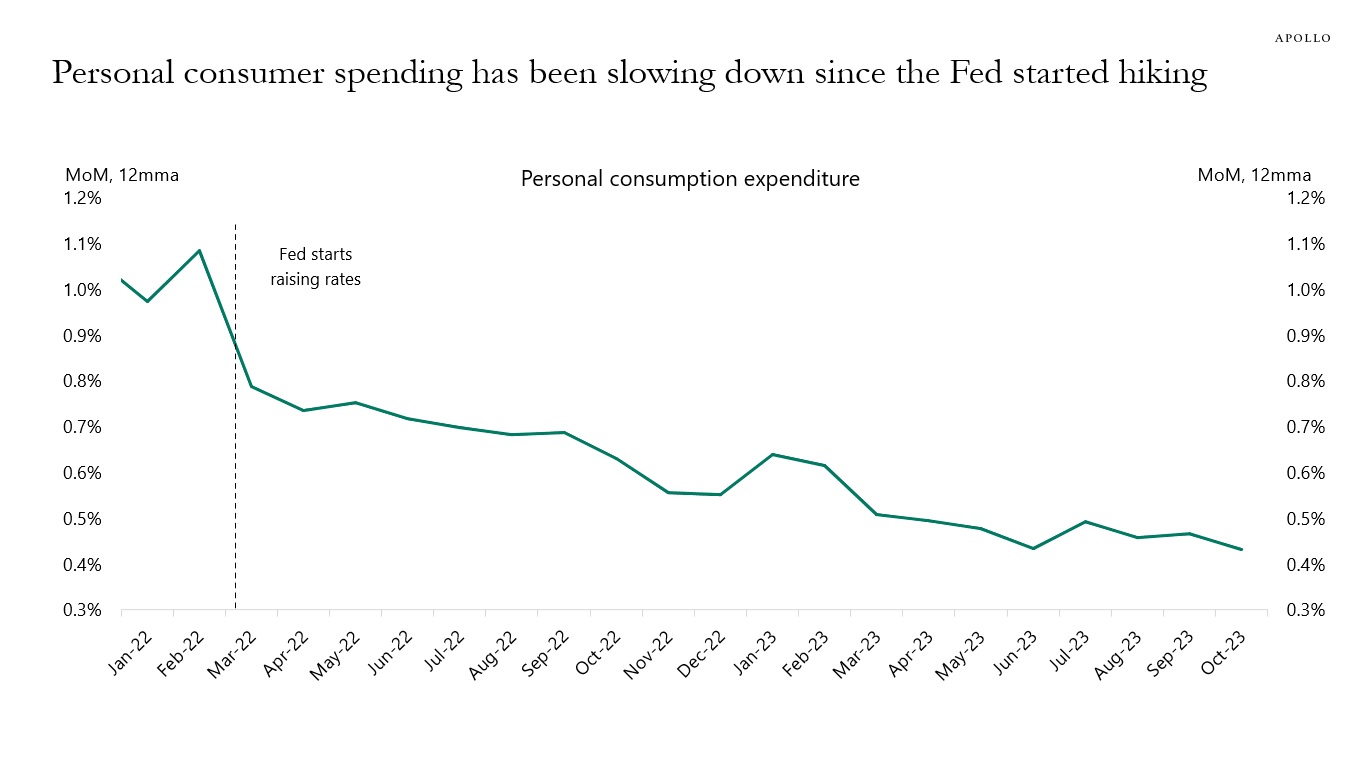
Source: BEA, Haver Analytics, Apollo Chief Economist 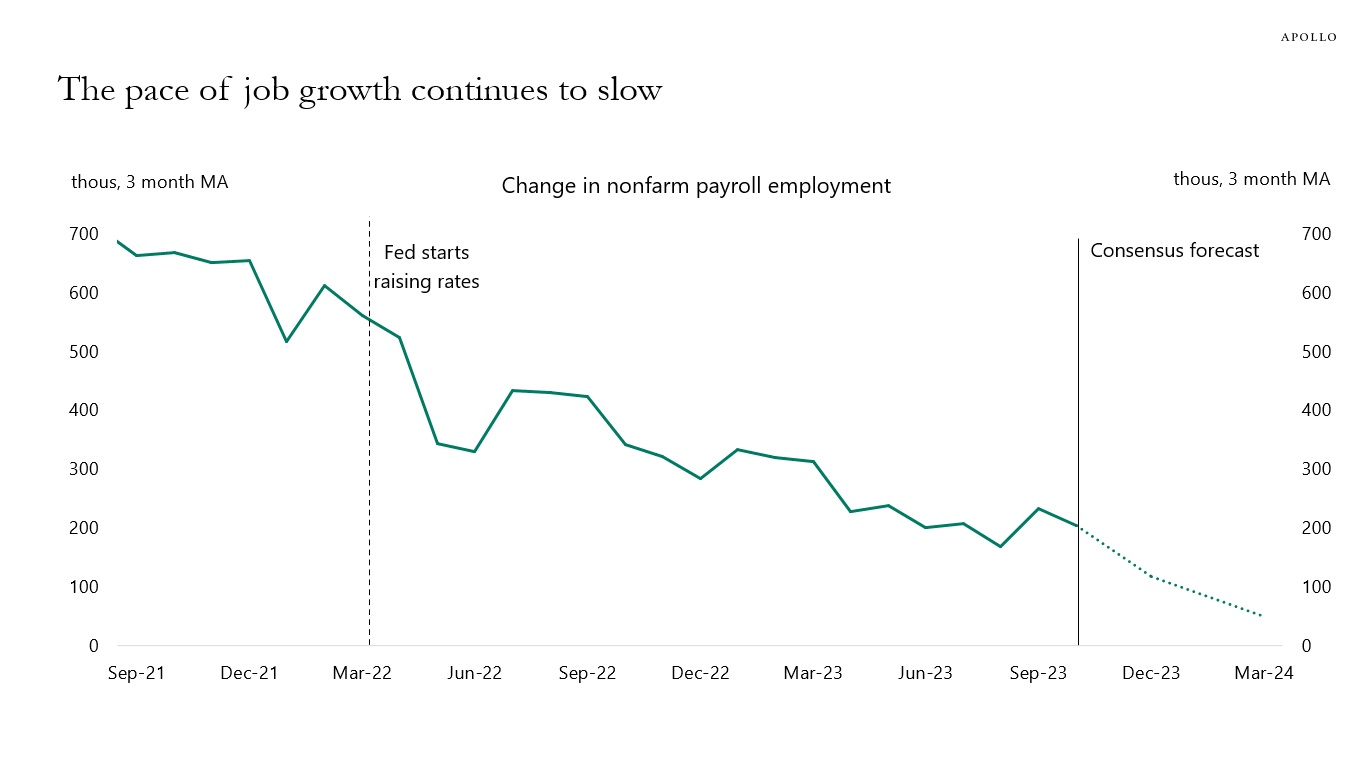
Source: BLS, Haver Analytics, Apollo Chief Economist See important disclaimers at the bottom of the page.
-
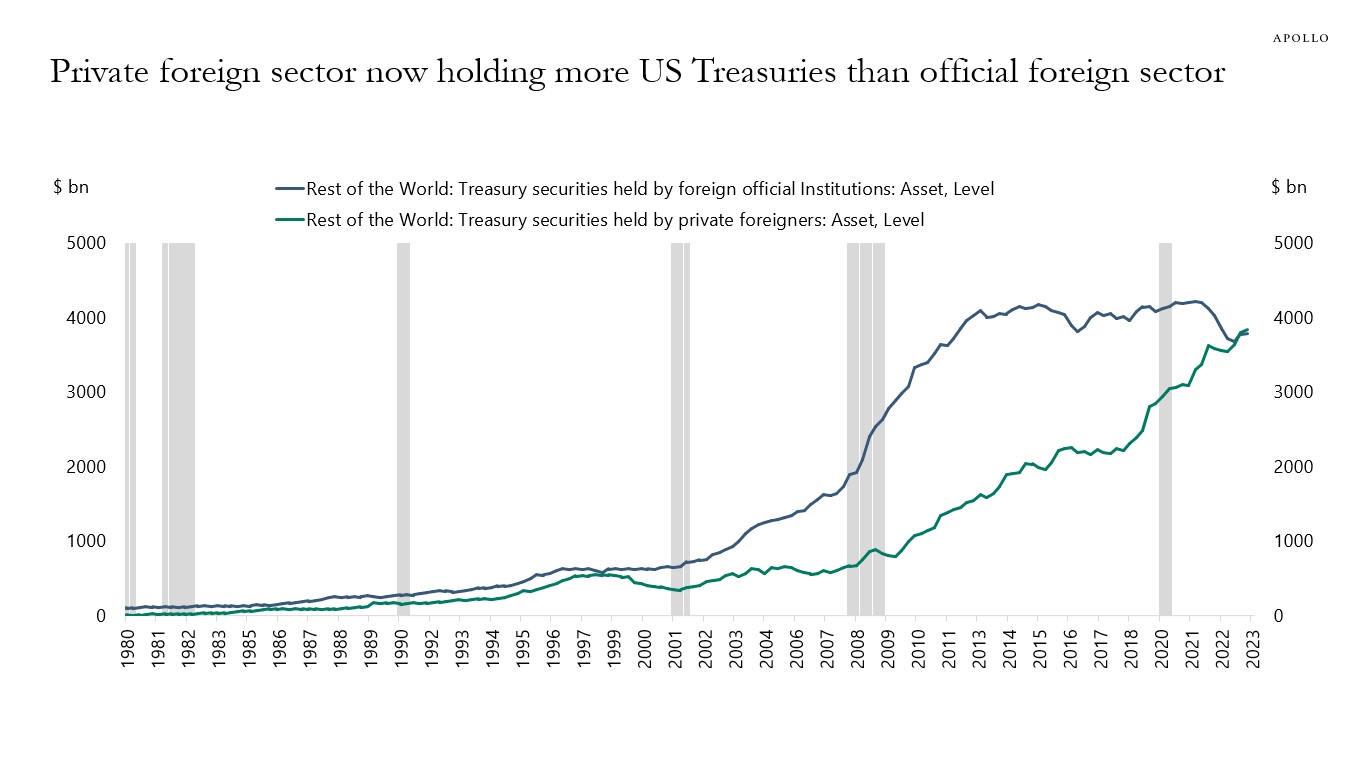
For decades, the biggest foreign holders of US Treasuries were central banks and sovereign wealth funds around the world, see chart below.
Foreign official institutions were buying Treasuries because many countries, in particular emerging markets, were intervening to limit the appreciation of their domestic currencies because a domestic currency that is too strong hurts exports.
In other words, the foreign official sector was not buying Treasuries for yield reasons but for FX reasons to support the US dollar and thereby domestic exports.
With the Fed raising rates and the dollar going up, that has now changed.
Foreign central banks no longer need to buy US Treasuries and US dollars to depreciate their currencies. And foreign private buyers find US yield levels attractive despite high hedging costs.
The bottom line is that with the Fed raising rates and the dollar going up, yield-insensitive central banks have been selling Treasuries to limit the weakening of their domestic currencies, and yield-sensitive foreign private investors have been buying Treasuries to benefit from both higher yields and a rising dollar.
With the Fed cutting rates in 2024, these trends may reverse again.
Source: FRB, Haver Analytics, Apollo Chief Economist See important disclaimers at the bottom of the page.
-
Since the Fed started raising rates, small businesses have seen a trend decline in earnings and sales, see chart below.
This is what the textbook would have predicted. Higher costs of capital weigh on small-cap companies with high leverage, low coverage ratios, and weak or no earnings.
With the Fed keeping rates high at least until the middle of 2024, we should expect these trends to continue.

Source: NFIB, Haver Analytics, Apollo Chief Economist See important disclaimers at the bottom of the page.
-
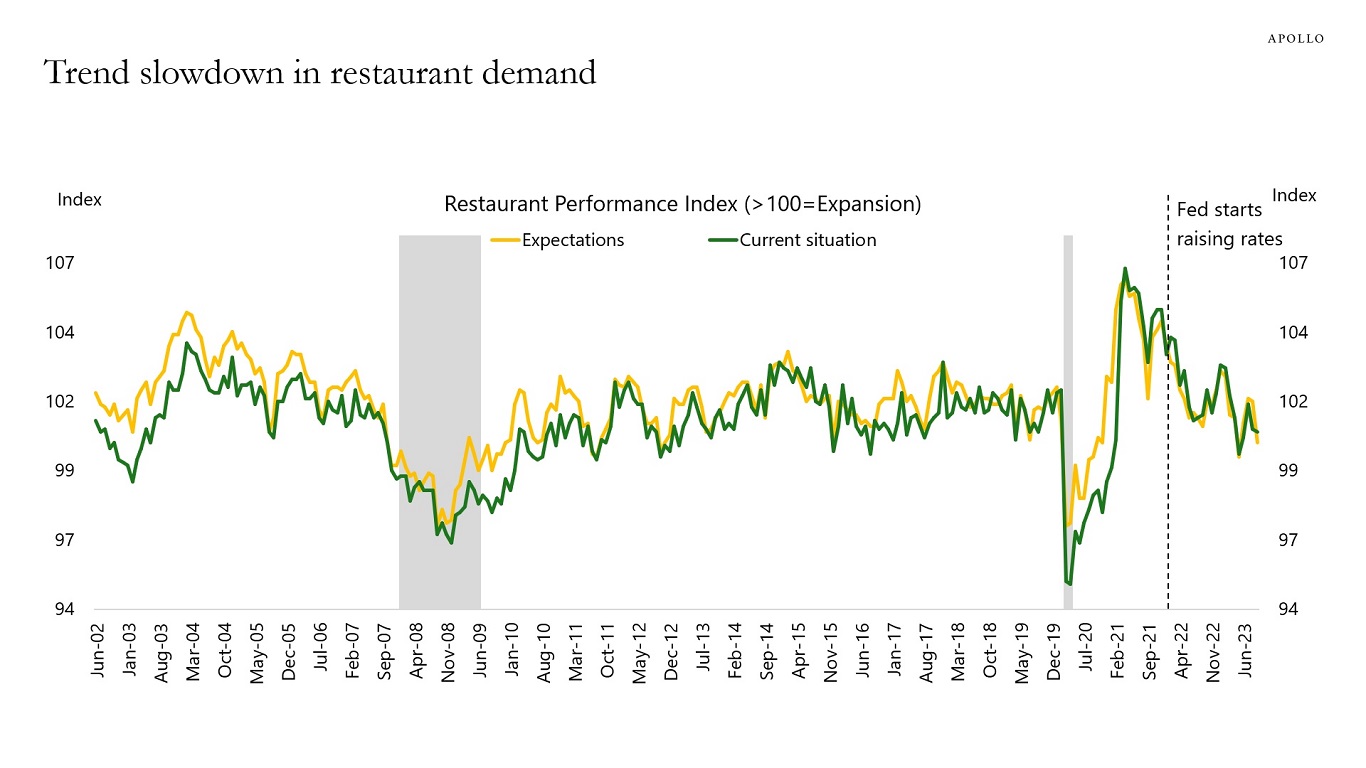
Indicators of restaurant activity continue to show signs of weakness, see chart below. This is not surprising. The Fed is trying to slow down the economy, and weakness is now starting to appear in consumer services.
Source: National Restaurant Association, Haver, Apollo Chief Economist See important disclaimers at the bottom of the page.
-
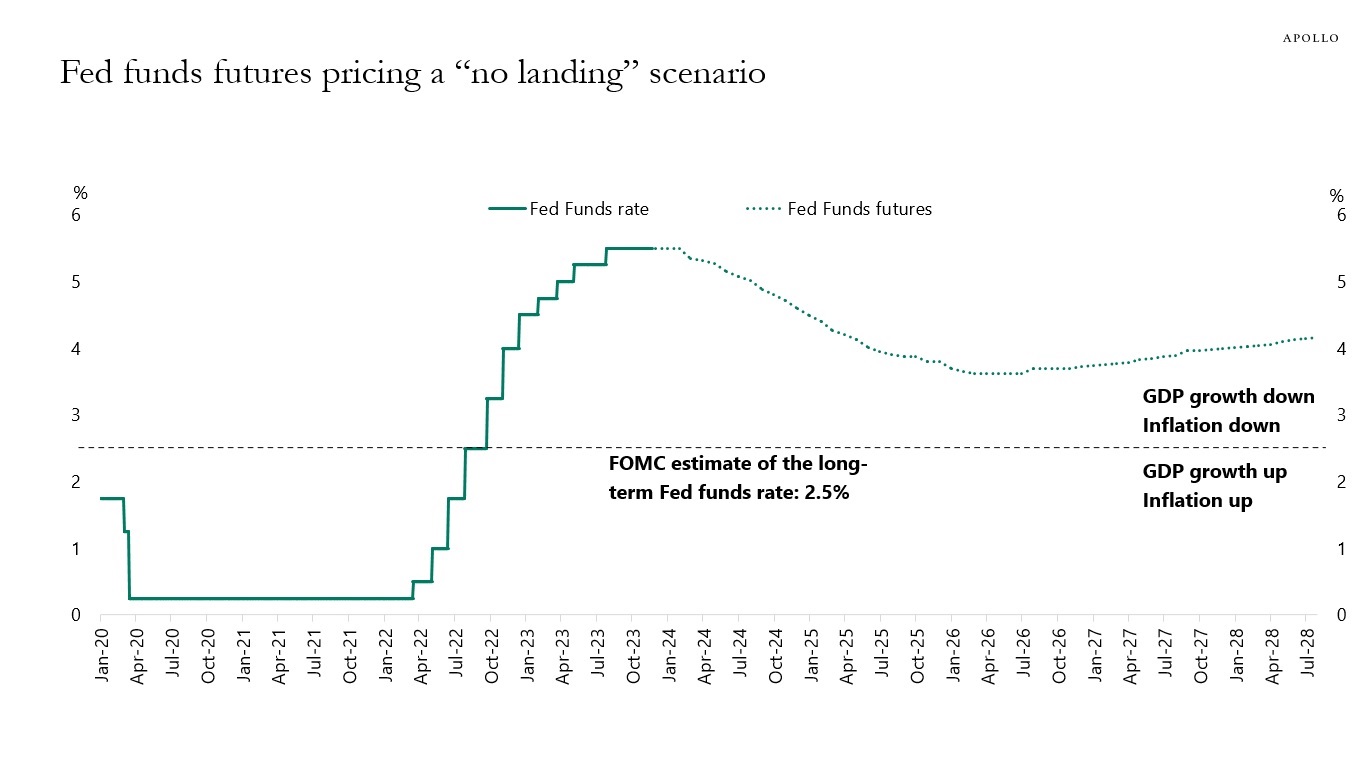
Fed funds futures show that the market is currently pricing that the Fed funds rate over the next five years will bottom at 4% and then slowly start to rise again, see chart below.
In other words, the market is pricing that monetary policy will remain restrictive and above r-star (2.5%) for the next five years. Put differently, the market is currently pricing a “no landing” scenario where monetary policy will have to put downward pressure on GDP growth and inflation for the next five years. In short, the market is extremely bullish on the economic outlook over the next five years.
A different way to look at current Fed pricing is to compare Fed funds futures to the longer-run dot in the Fed’s dot plot, which shows that the FOMC expects the Fed funds rate in the longer run to be 2.5%.
The bottom line is that the FOMC and Fed estimates of r-star are saying that the Fed funds rate will move down to 2.5%. But the market disagrees and says that rates will stay around 4% for the next five years, see again the chart below.
Source: Bloomberg, Apollo Chief Economist See important disclaimers at the bottom of the page.
-
The divergence between the S&P7 and the S&P493 continues, see the first chart below. Investors buying the S&P500 today are buying seven companies that are already up 80% this year and have an average P/E ratio above 50. In fact, S&P7 valuations are beginning to look similar to the Nifty Fifty and the tech bubble in March 2000, see the second chart below.
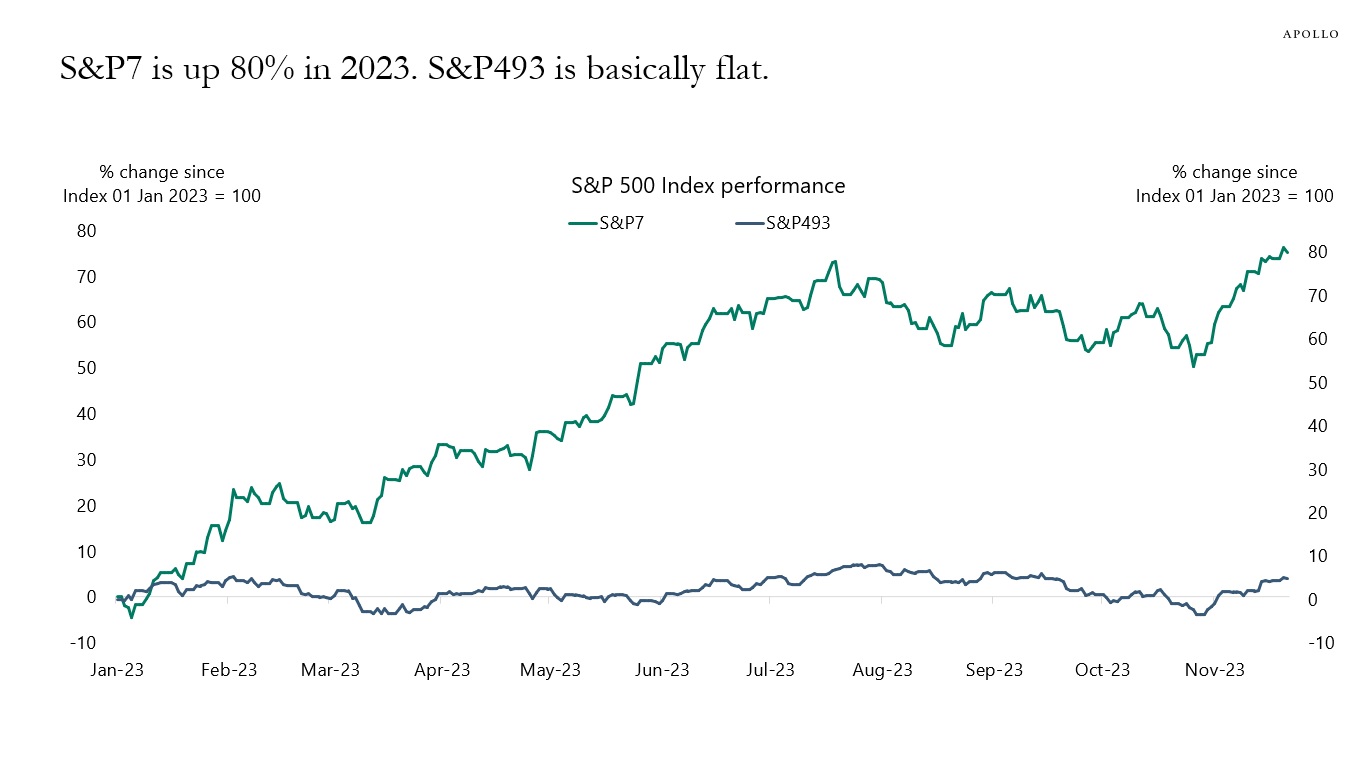
Source: Bloomberg, Apollo Chief Economist. Note: The S&P7 is the Magnificent 7: Apple, Microsoft, Alphabet, Amazon, NVIDIA, Meta, and Tesla. 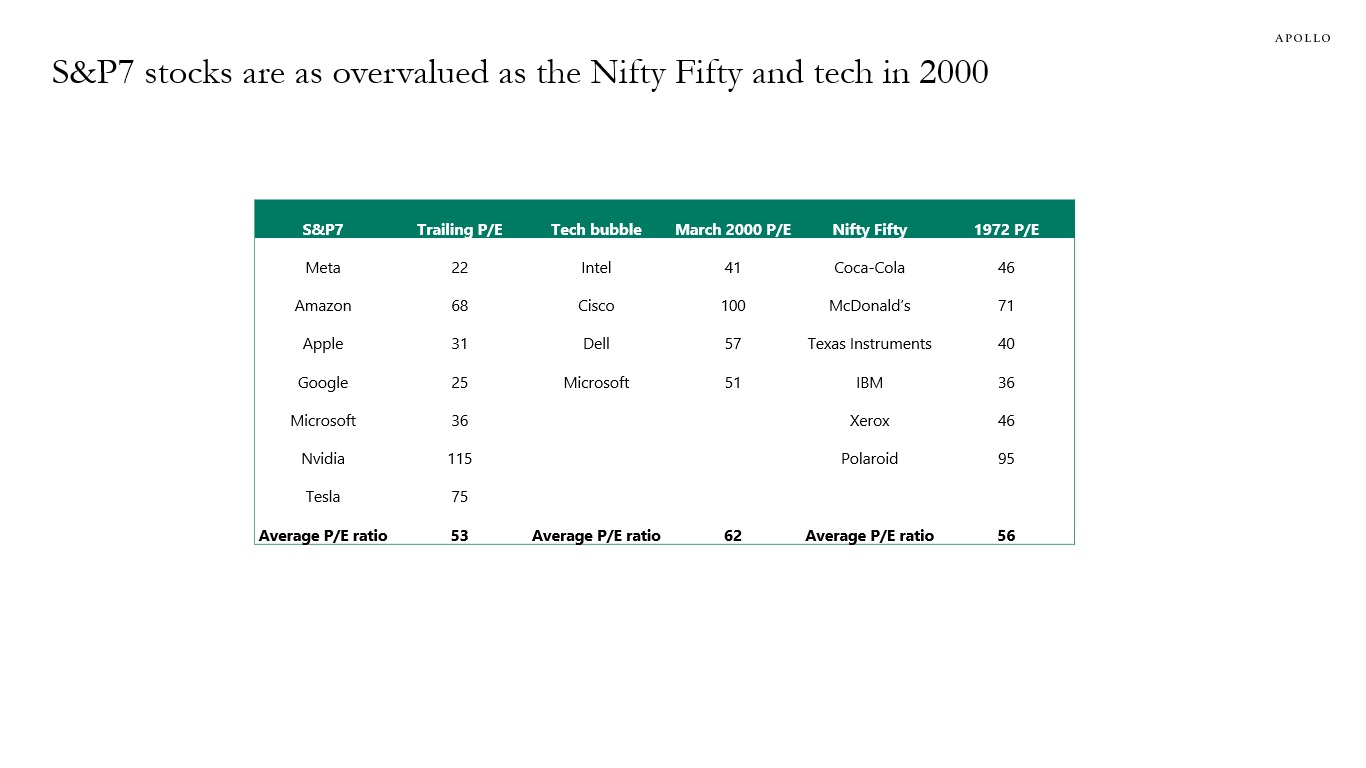
Source: Bloomberg, Apollo Chief Economist See important disclaimers at the bottom of the page.
-
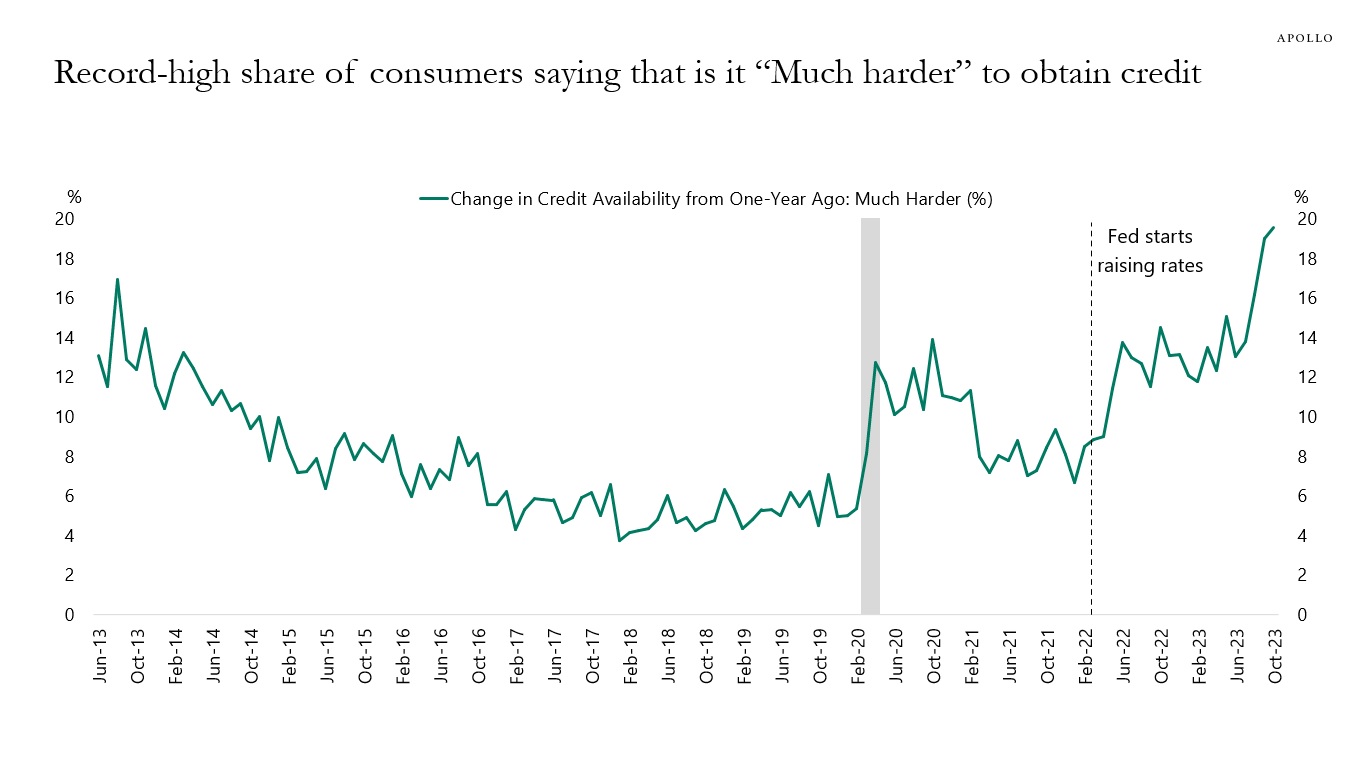
The New York Fed’s latest household survey shows that a record-high share of consumers are saying that it is much harder to obtain credit, see chart below.
This is what the textbook would have predicted. When the Fed raises interest rates, it becomes more difficult for consumers to borrow.
Source: FRBNY, Haver Analytics, Apollo Chief Economist See important disclaimers at the bottom of the page.
-
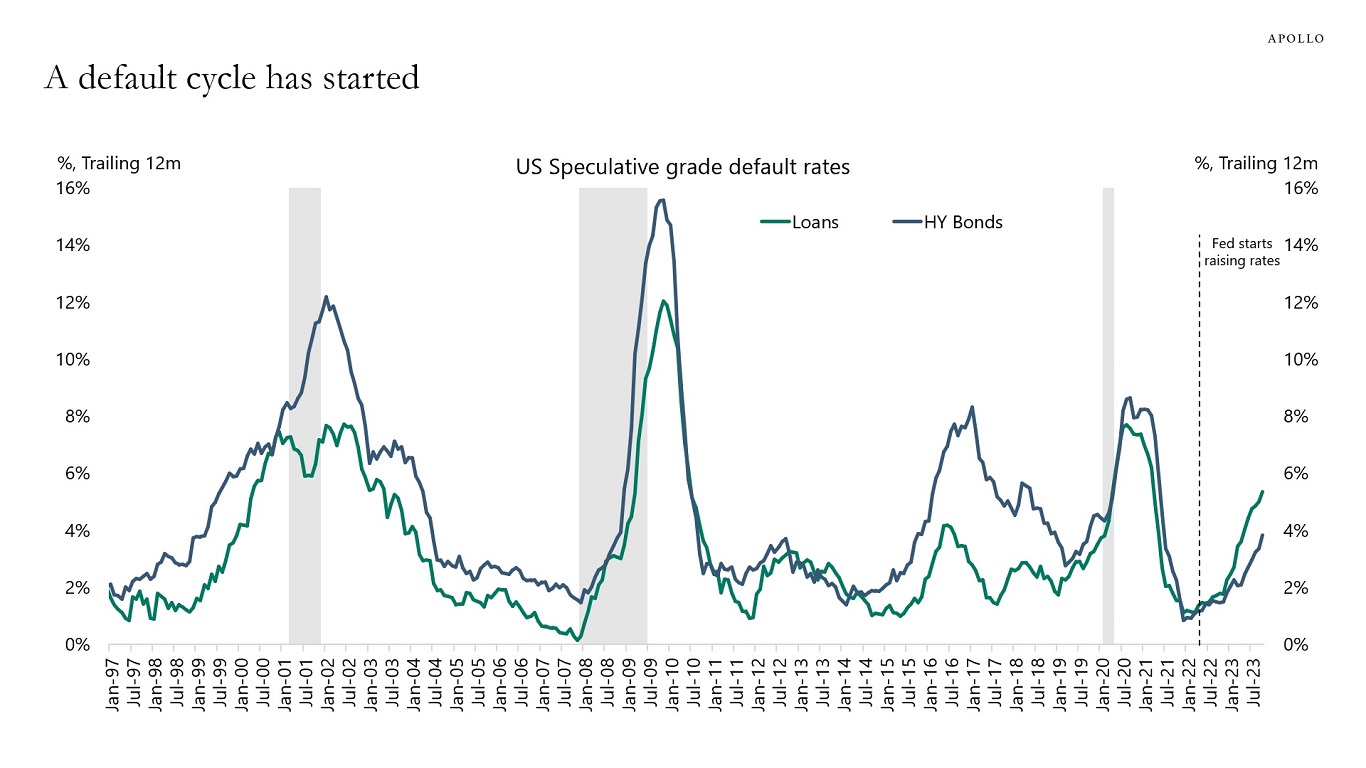
Moody’s data for October shows that default rates continue to increase, see the first chart below.
This is not surprising. Default rates will continue to trend higher. Why? Because the rise in default rates is engineered by the Fed. The Fed is in the process of slowing down the economy with the goal of getting inflation back to the FOMC’s 2% target.
In other words, the ongoing rise in default rates is not just a “normalization.” It is the direct consequence of Fed hikes. The Fed is trying to slow the economy down.
Total employment of companies in the high yield index is 11 million, and total employment of companies in the leveraged loans index is 8 million, see the second chart below.
With interest rates staying high at least until mid-2024, the downside risks to employment continue to be meaningful because the goal of the Fed is to soften the labor market and lower inflation. And the only tool they have is to keep interest rates high until they get what they want, namely inflation back at 2%.
Our latest credit market outlook is available here. Investors should be up in quality and stay away from small-cap highly leveraged companies with low coverage ratios and weak cash flows because those companies will be particularly vulnerable to high costs of capital and slowing earnings growth.
Source: Moody’s Analytics, Apollo Chief Economist 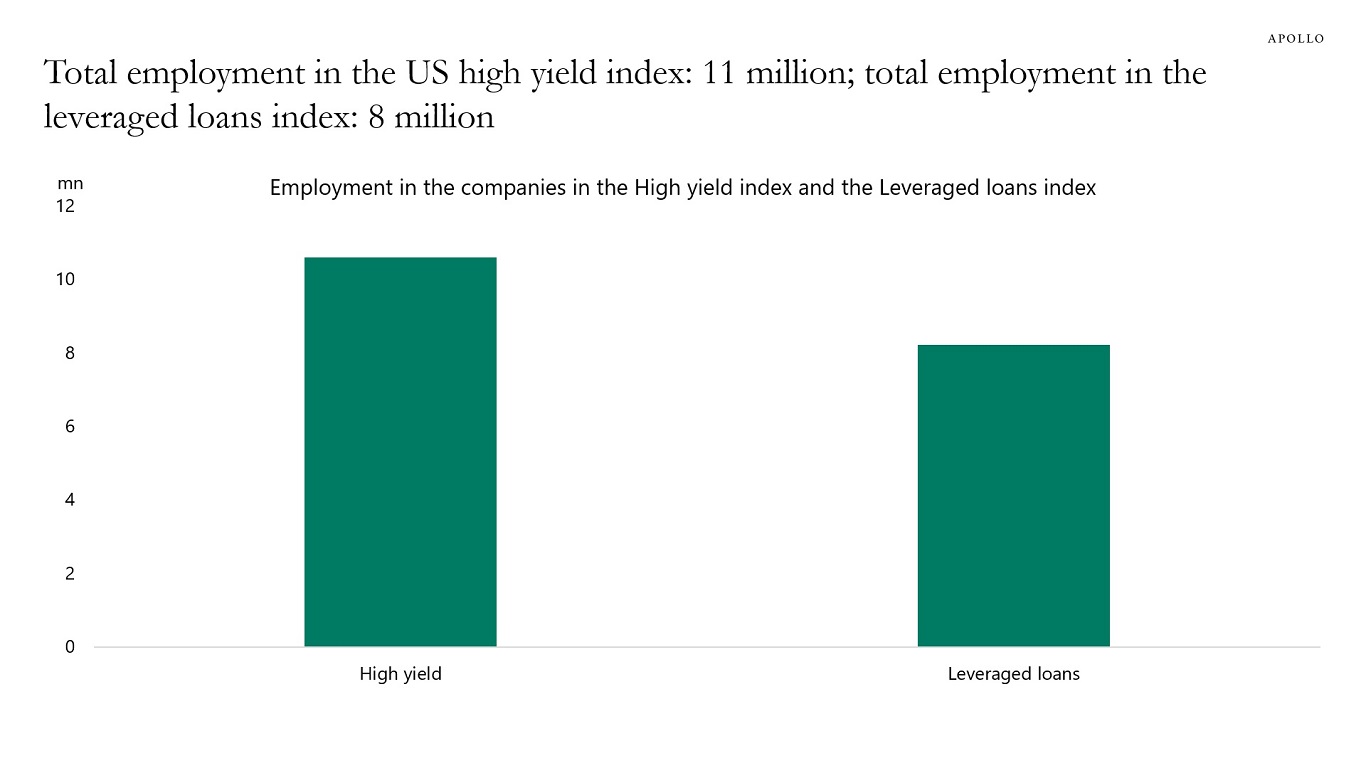
Source: Bloomberg, ICE BofA H0A0 Index, Morningstar LSTA Index, Apollo Chief Economist. Note: Data includes 842 companies in the HY index with employment data available for 584 companies and median employment assumed for the rest. Similarly, there are 1,073 companies in the leveraged loans index with employment data available for 450 companies and median employment assumed for the rest. 
See important disclaimers at the bottom of the page.
-
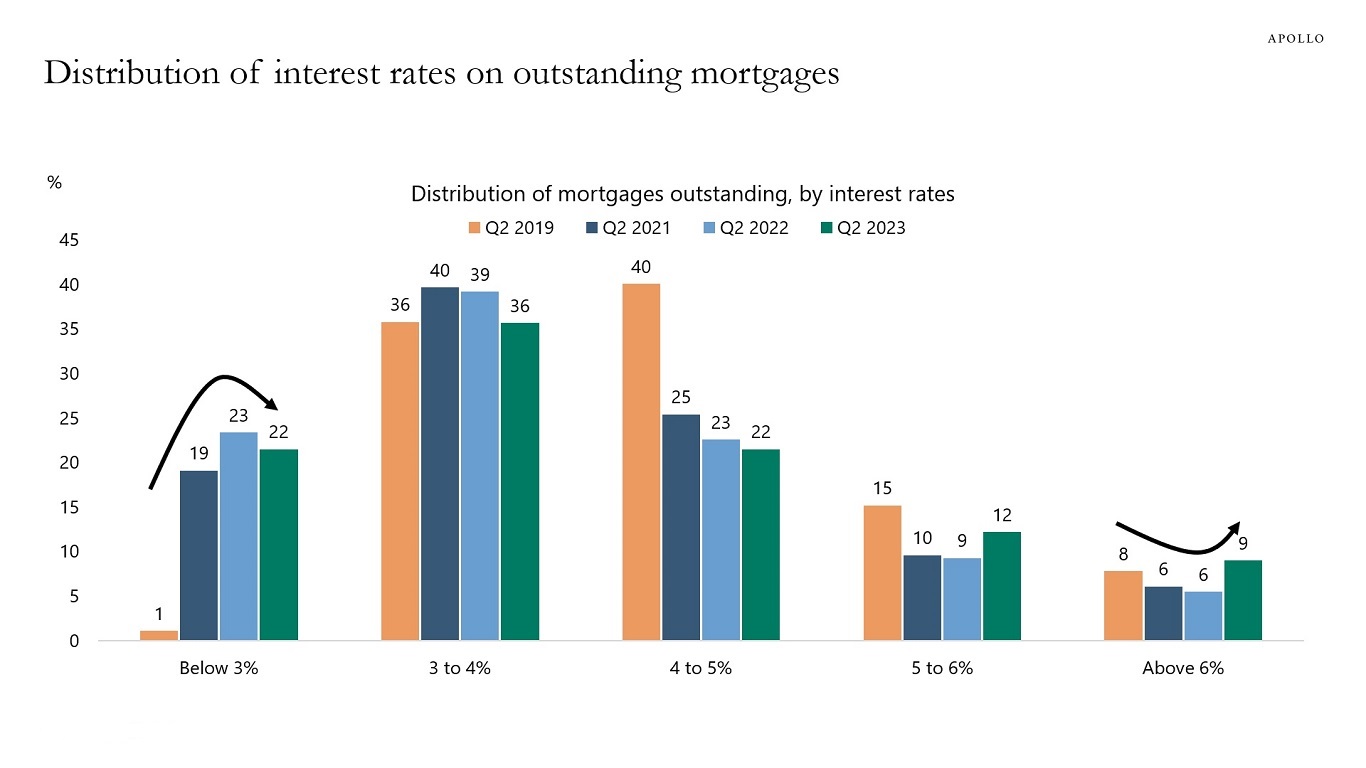
During the pandemic, many households refinanced their mortgages at lower interest rates. As a result, 22% of mortgages today have an interest rate below 3%, up from 1% of all mortgages in 2019, see chart below.
The locking in of lower mortgage rates has weakened the transmission mechanism of monetary policy, and it is the reason why Fed hikes have not had a more significant negative impact on the housing market.
The bottom line is that Fed hikes are not having the desired effect because households have locked in low levels of mortgage rates during the pandemic. As a result, the Fed will have to keep interest rates higher for longer to slow down the economy and get inflation back to 2%.
Our latest housing outlook is available here.
Source: FHFA, Apollo Chief Economist See important disclaimers at the bottom of the page.
-
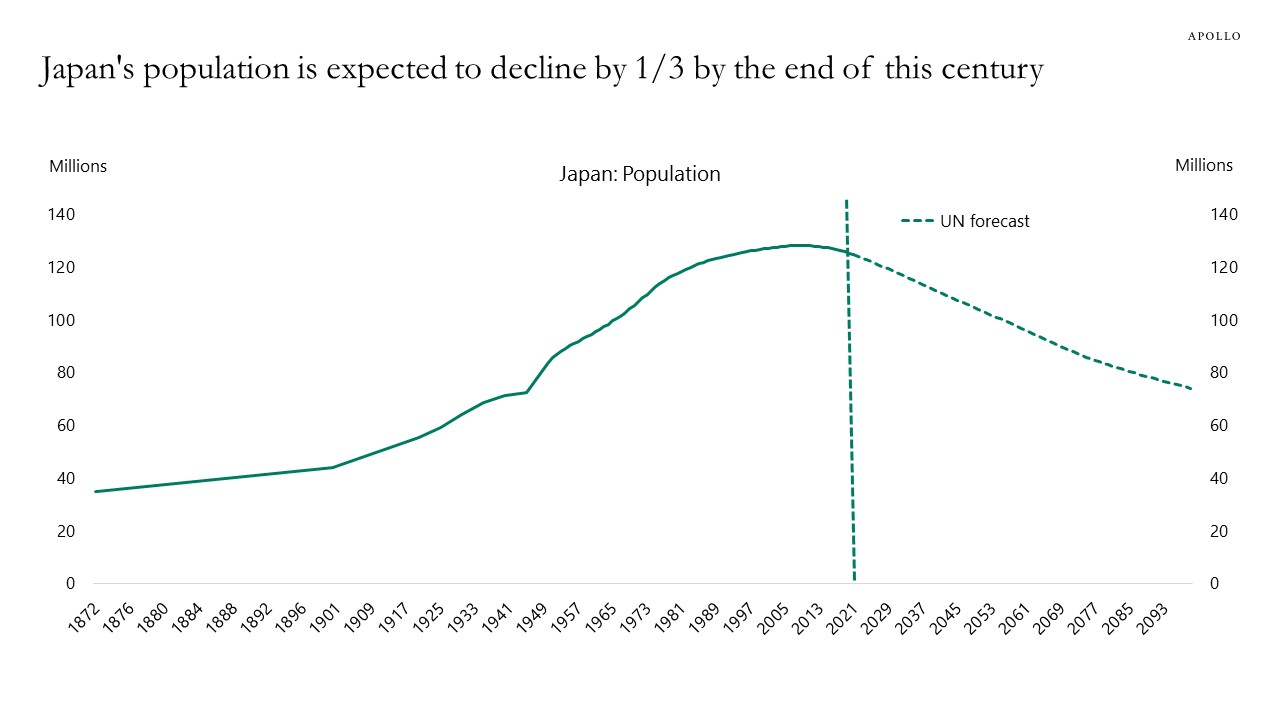
The United Nations forecasts that by the end of this century, Japan’s population will have declined from 120 million to 80 million, see chart below.
Source: Ministry of Health and Welfare, Japan; UN; Haver; Apollo Chief Economist See important disclaimers at the bottom of the page.

This presentation may not be distributed, transmitted or otherwise communicated to others in whole or in part without the express consent of Apollo Global Management, Inc. (together with its subsidiaries, “Apollo”).
Apollo makes no representation or warranty, expressed or implied, with respect to the accuracy, reasonableness, or completeness of any of the statements made during this presentation, including, but not limited to, statements obtained from third parties. Opinions, estimates and projections constitute the current judgment of the speaker as of the date indicated. They do not necessarily reflect the views and opinions of Apollo and are subject to change at any time without notice. Apollo does not have any responsibility to update this presentation to account for such changes. There can be no assurance that any trends discussed during this presentation will continue.
Statements made throughout this presentation are not intended to provide, and should not be relied upon for, accounting, legal or tax advice and do not constitute an investment recommendation or investment advice. Investors should make an independent investigation of the information discussed during this presentation, including consulting their tax, legal, accounting or other advisors about such information. Apollo does not act for you and is not responsible for providing you with the protections afforded to its clients. This presentation does not constitute an offer to sell, or the solicitation of an offer to buy, any security, product or service, including interest in any investment product or fund or account managed or advised by Apollo.
Certain statements made throughout this presentation may be “forward-looking” in nature. Due to various risks and uncertainties, actual events or results may differ materially from those reflected or contemplated in such forward-looking information. As such, undue reliance should not be placed on such statements. Forward-looking statements may be identified by the use of terminology including, but not limited to, “may”, “will”, “should”, “expect”, “anticipate”, “target”, “project”, “estimate”, “intend”, “continue” or “believe” or the negatives thereof or other variations thereon or comparable terminology.