


Want it delivered daily to your inbox?
-
In March 2021 the FOMC thought that the Fed funds rate by the end of 2023 would be zero, and today they think it will be 5.6%, see chart below. With this in mind, markets should be flexible when they think about where the Fed funds rate will be by the end of 2024.
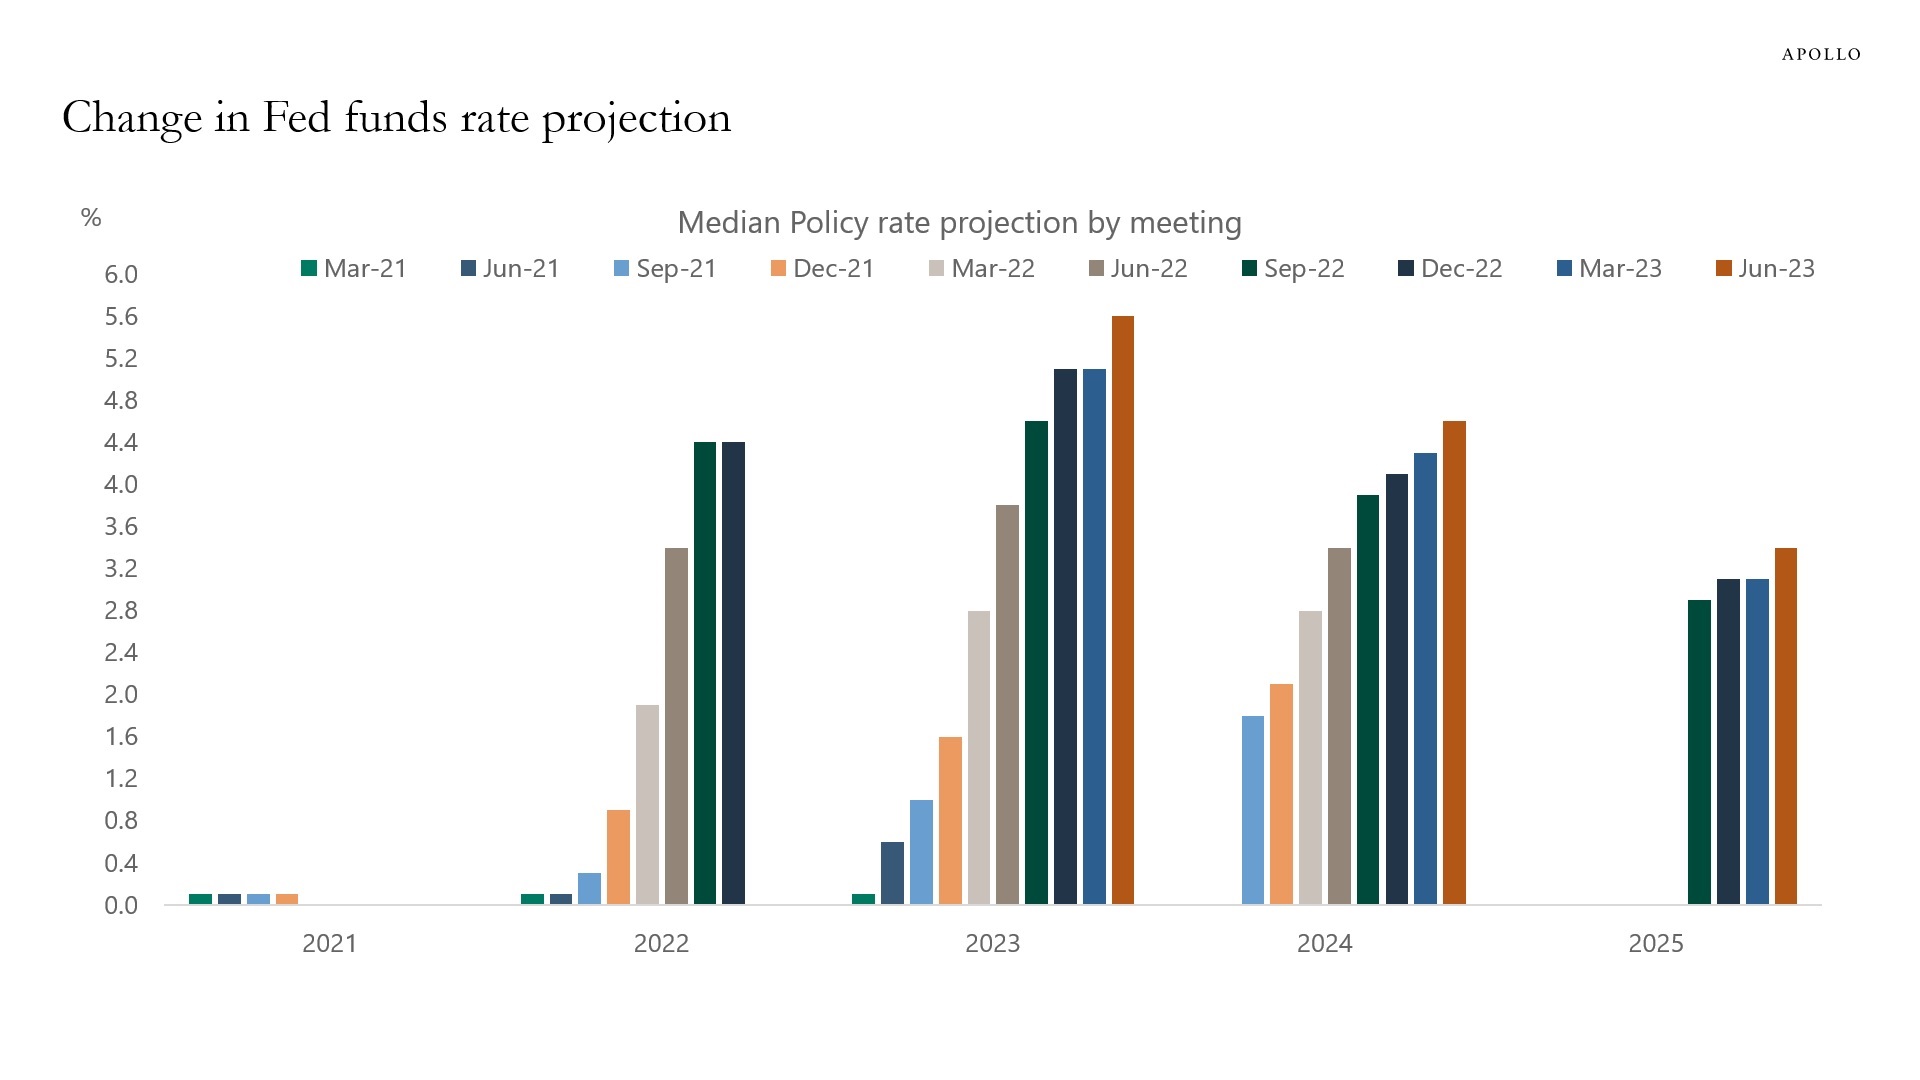
Source: FRB, Apollo Chief Economist See important disclaimers at the bottom of the page.
-
The charts below show how consumer spending on services and goods respond during Fed hiking cycles.
There are two conclusions:
1) The first chart shows that spending on consumer services is not very responsive to Fed hikes, and it can take up to 18 months after the first Fed hike before consumer spending on services starts slowing down.
2) The trajectory of consumer spending on goods during this Fed cycle has been very muted. This was likely driven by the strong growth in consumer spending on goods during the pandemic.
The bottom line is that looking at previous Fed hiking cycles, it always takes a long time before Fed hikes begin to slow down consumer spending on services.
With services making up 80% of spending, this argues for the Fed having to raise rates more than the market is currently pricing. And with more rate increases comes a higher risk of a harder landing.
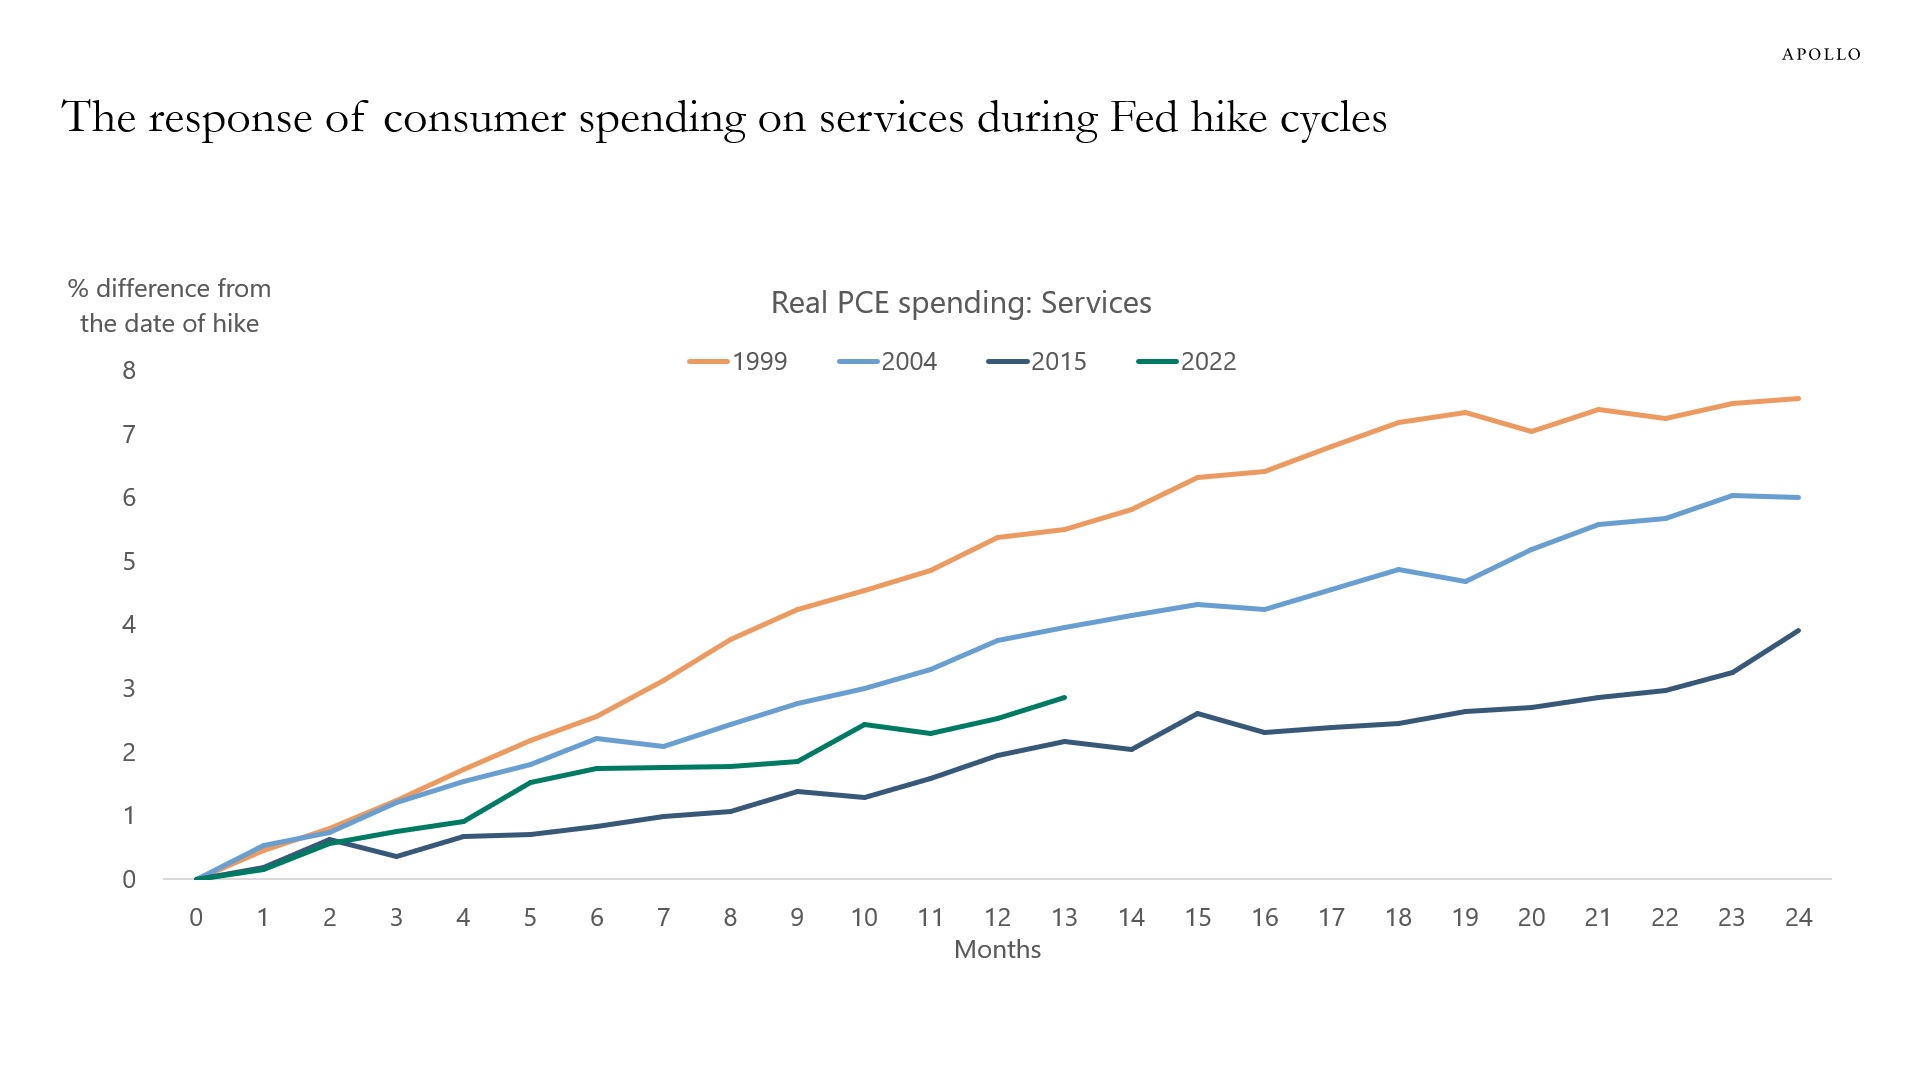
Source: BEA, FRB, Apollo Chief Economist 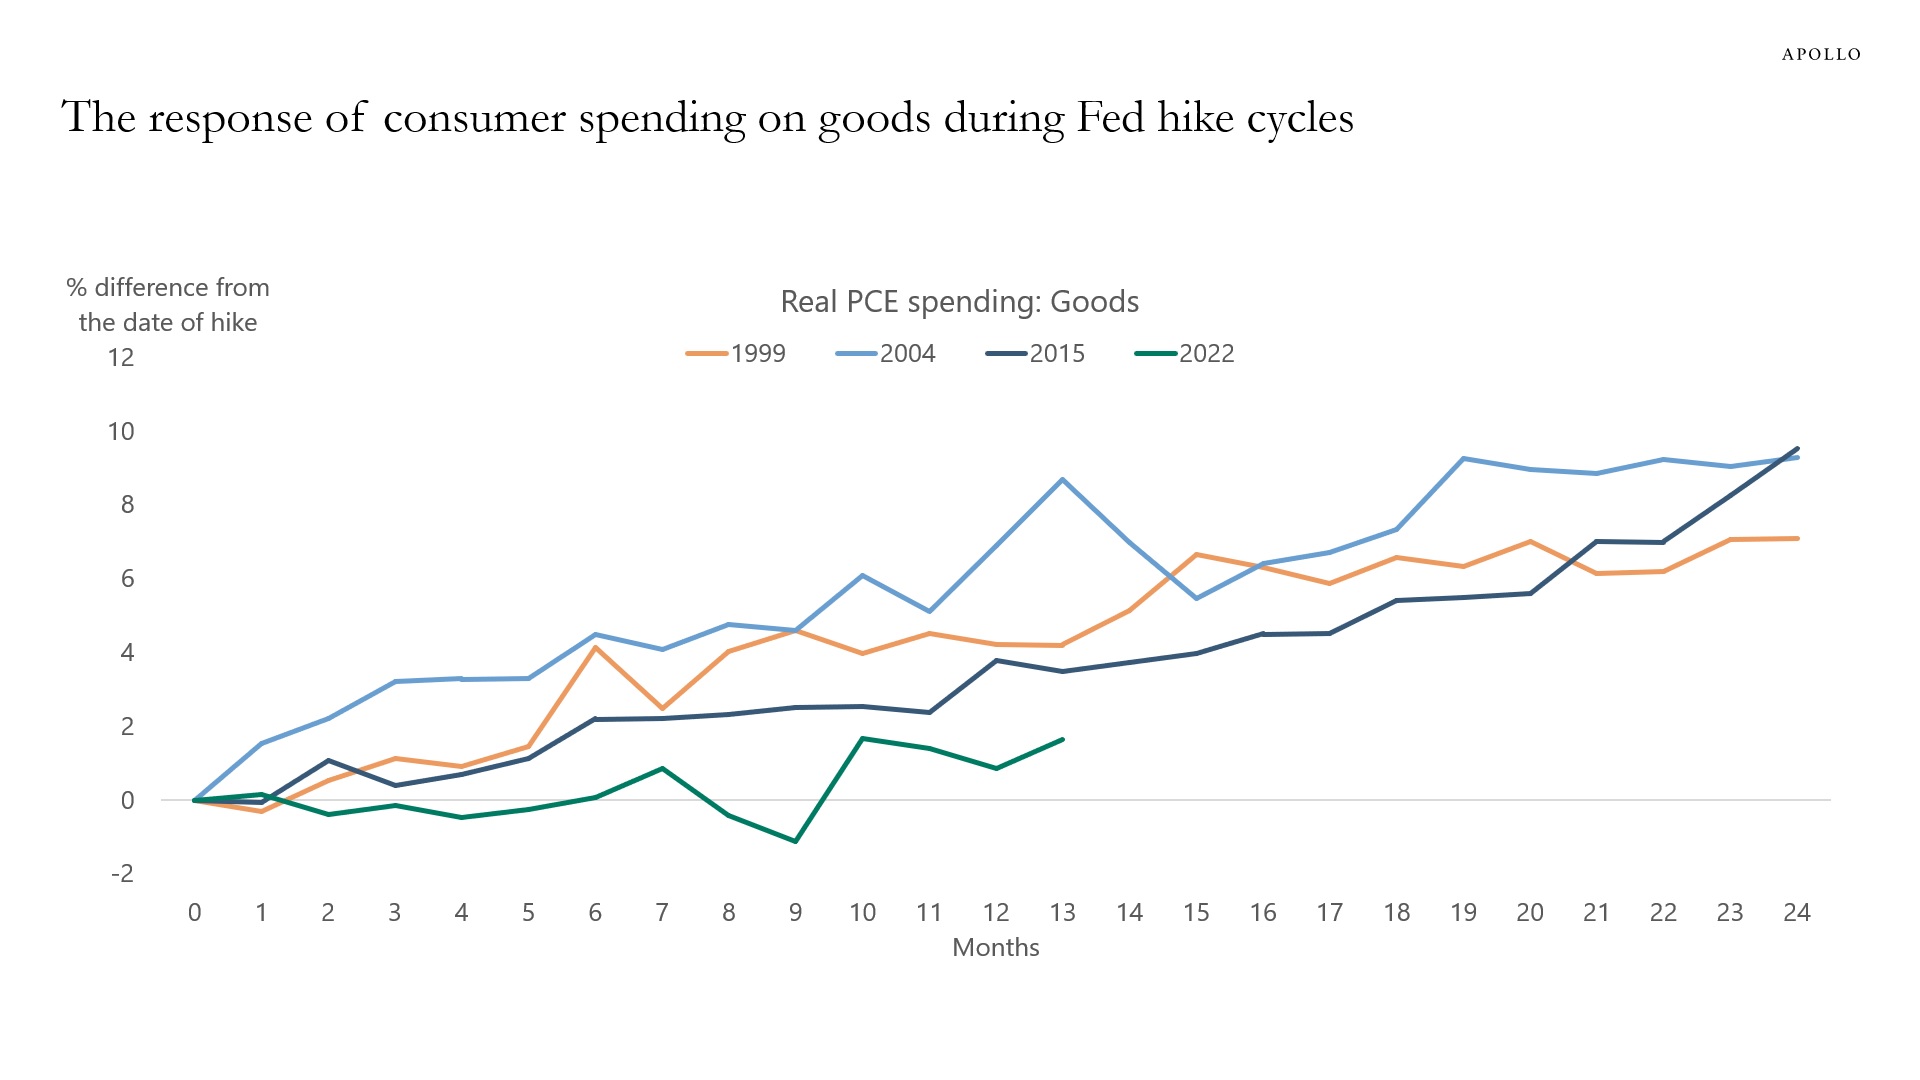
Source: BEA, FRB, Apollo Chief Economist See important disclaimers at the bottom of the page.
-
Since SVB collapsed, the Fed has been adding liquidity, and the S&P500 is up more than 10%. The high correlation between Fed net QE and the S&P500 seen in the chart below suggests that Fed liquidity is a crucial driver of the stock market. With the Fed turning more hawkish and continuing QT, the downside risks to equities are growing.
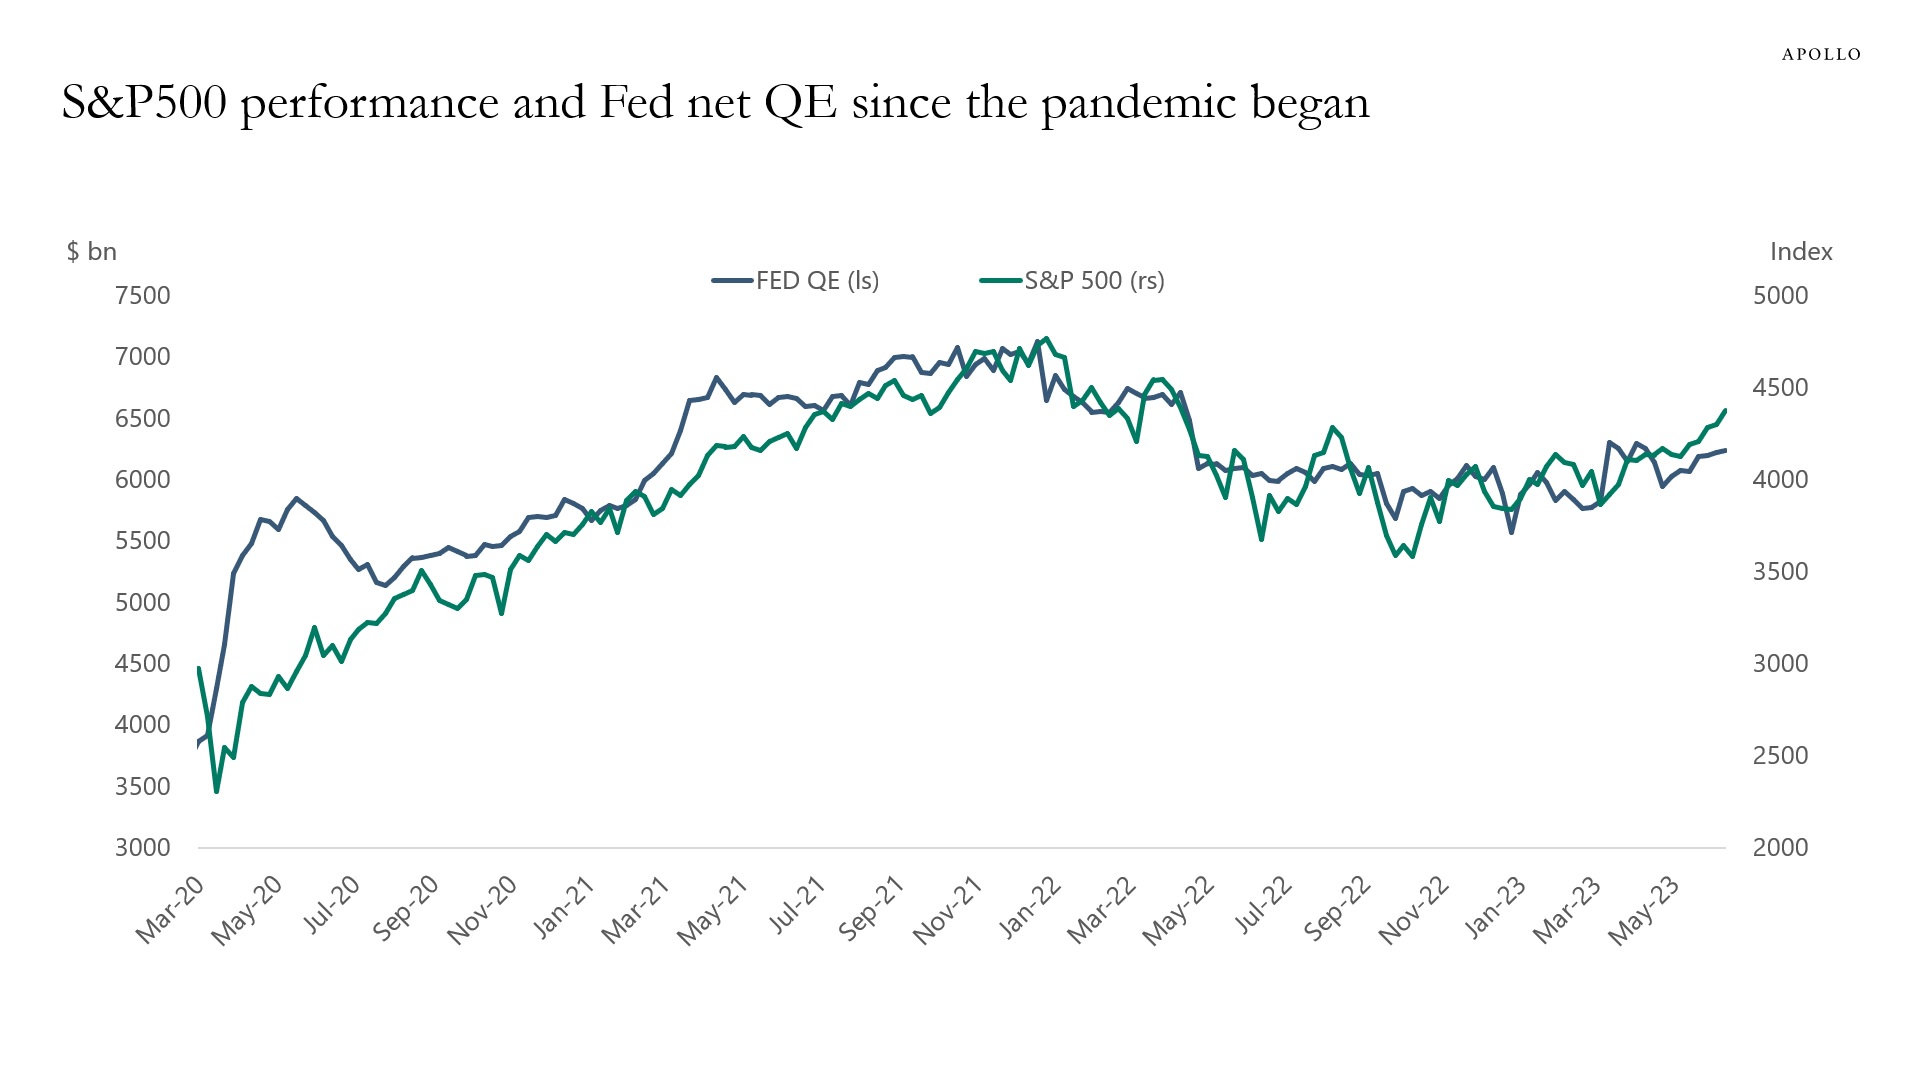
Source: Federal Reserve Board, Bloomberg, Apollo Chief Economist. (FED QE = Fed total assets – Balance of the Treasury General Account – Temporary cash added/drained through Overnight Reverse Repo). 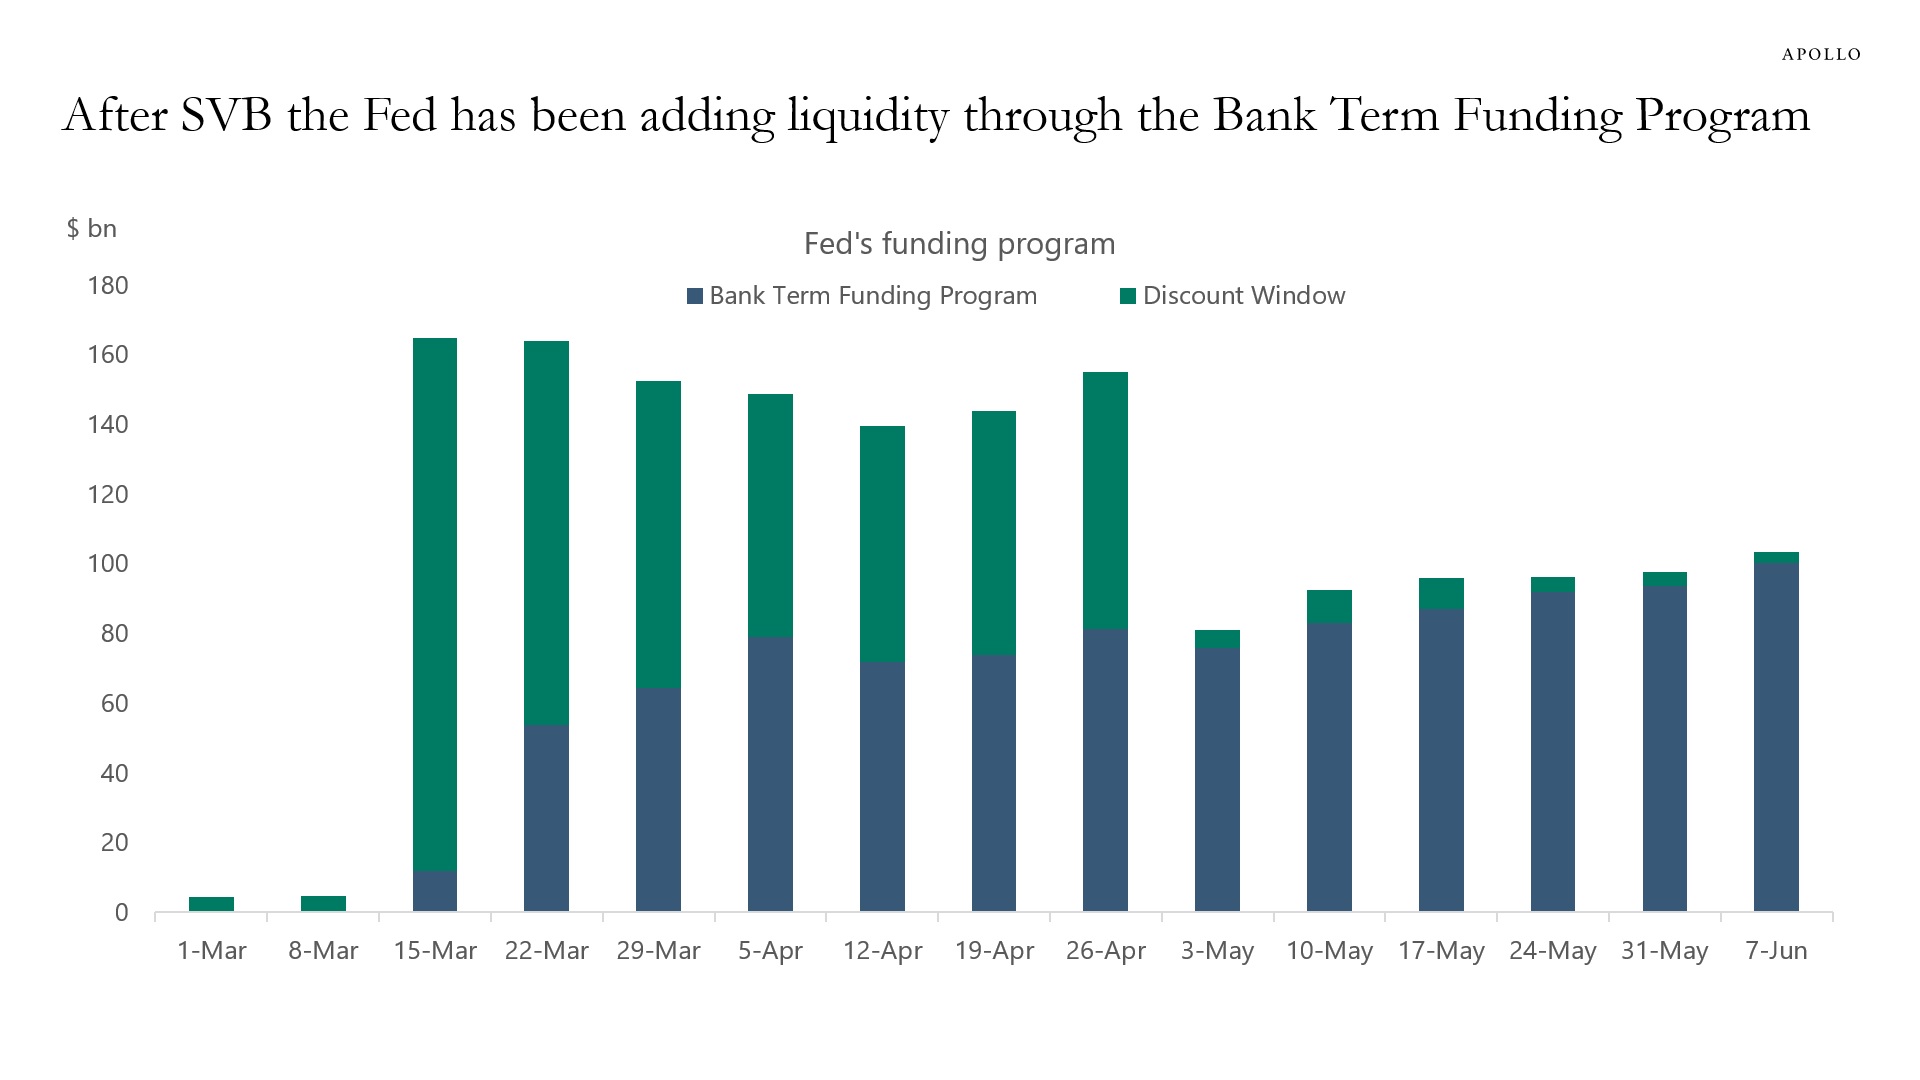
Source: Federal Reserve Board, Bloomberg, Apollo Chief Economist See important disclaimers at the bottom of the page.
-
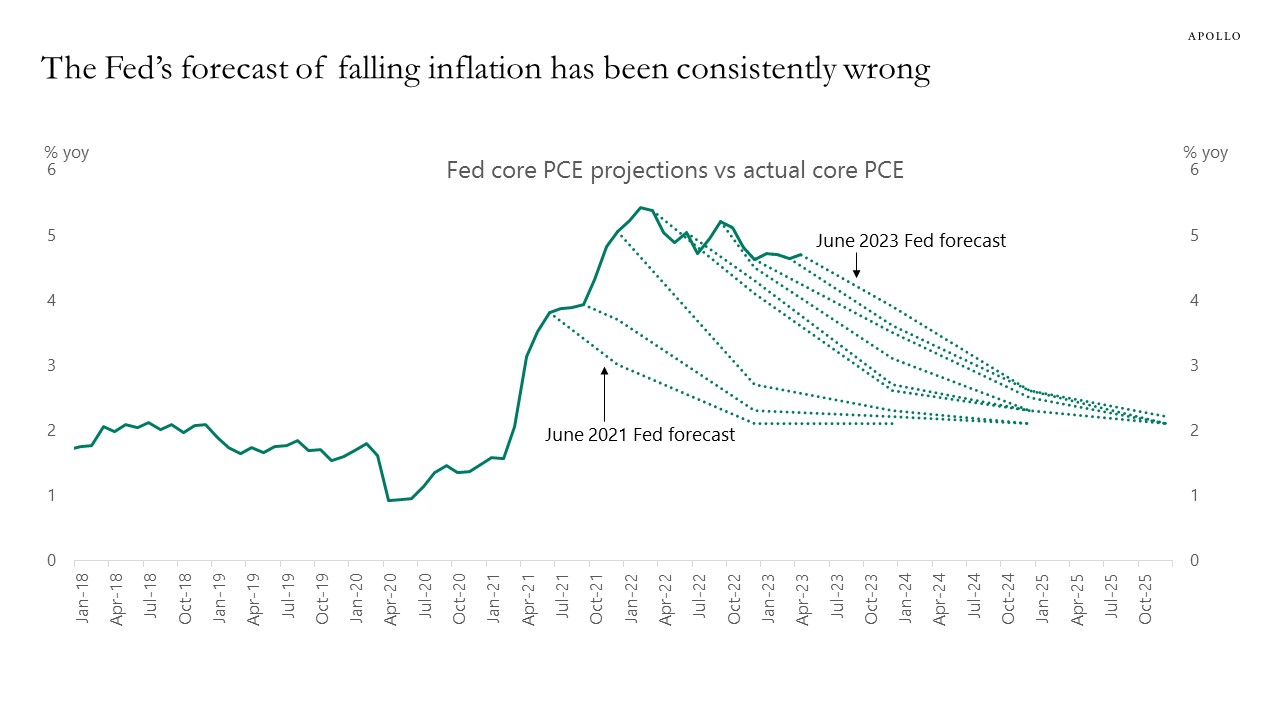
The latest FOMC forecast predicts that core inflation within a year will fall below 3%. This has been the forecast for every Fed meeting over the past two years. And this forecast has been consistently wrong, see chart below.
Earlier this week, the Fed took the consequence of this systematic forecast error and turned significantly more hawkish. Markets didn’t listen, and the change in tone from the Fed ended up having little negative impact on rates, credit, or equities.
The bottom line is that inflation at 5% remains too high, and it is clear that markets are underappreciating the Fed’s commitment to get inflation back to 2%.
Source: Federal Reserve Board, BEA, Bloomberg, Apollo Chief Economist See important disclaimers at the bottom of the page.
-
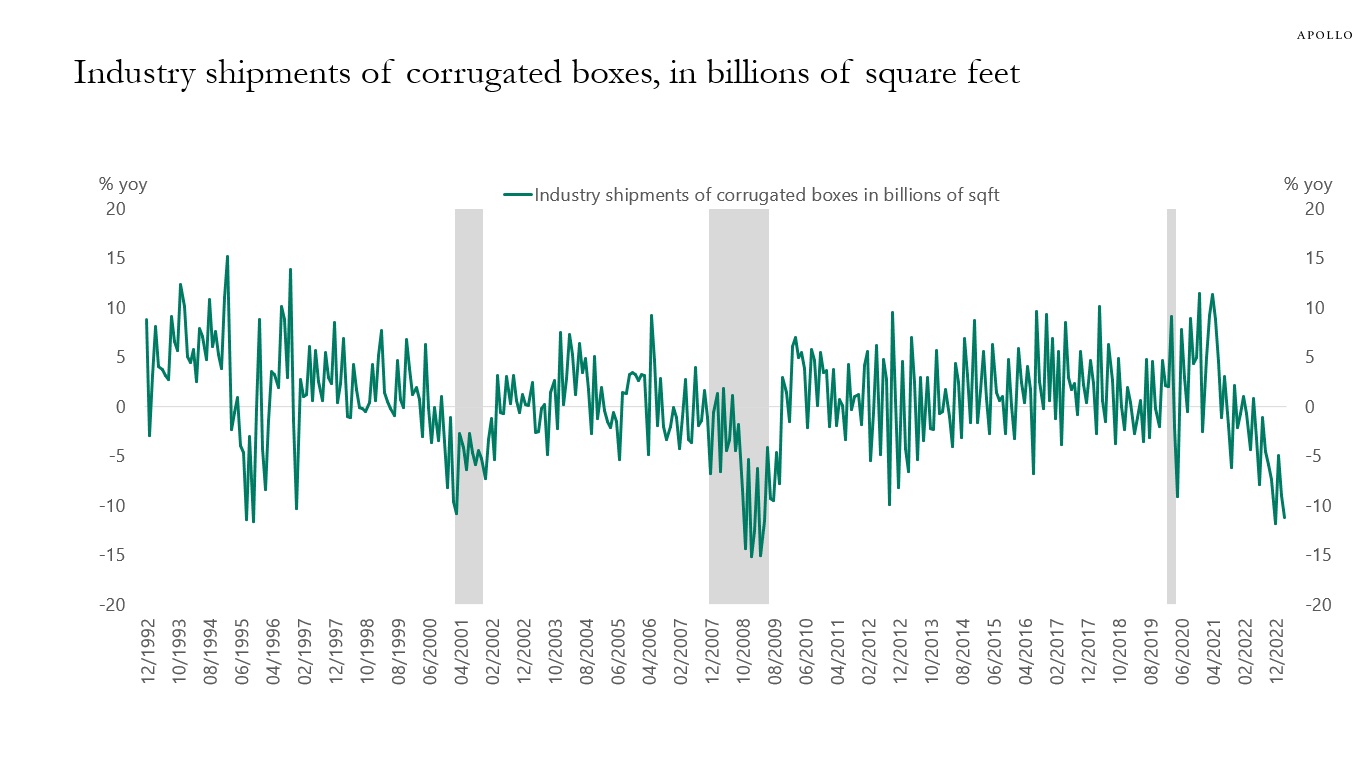
Sales of cardboard boxes have been declining over the past year, reflecting the ongoing weakness in the goods part of the economy, see chart below.
Source: Bloomberg, Apollo Chief Economist See important disclaimers at the bottom of the page.
-
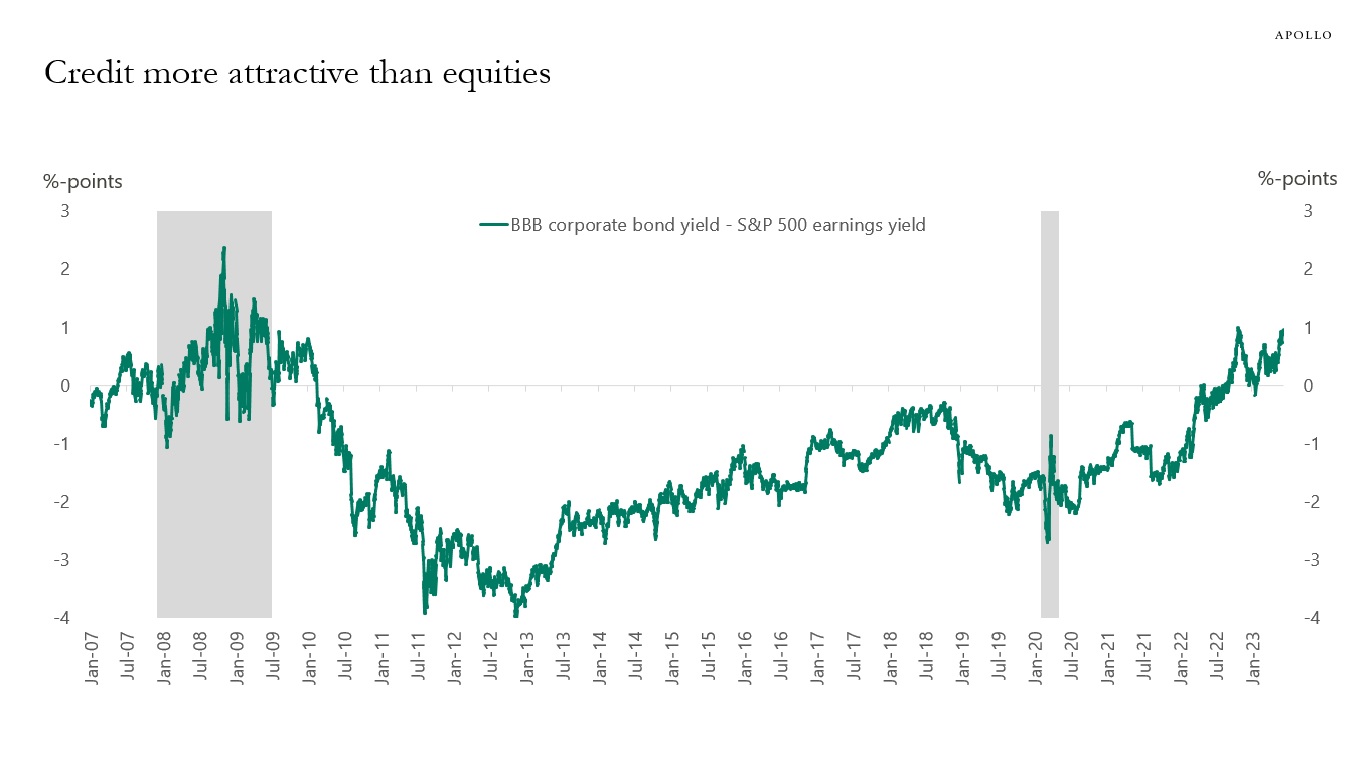
The yield on BBB credit is at the highest levels in 15 years relative to the earnings yield on the S&P500, see chart below.
Source: Bloomberg, Apollo Chief Economist See important disclaimers at the bottom of the page.
-
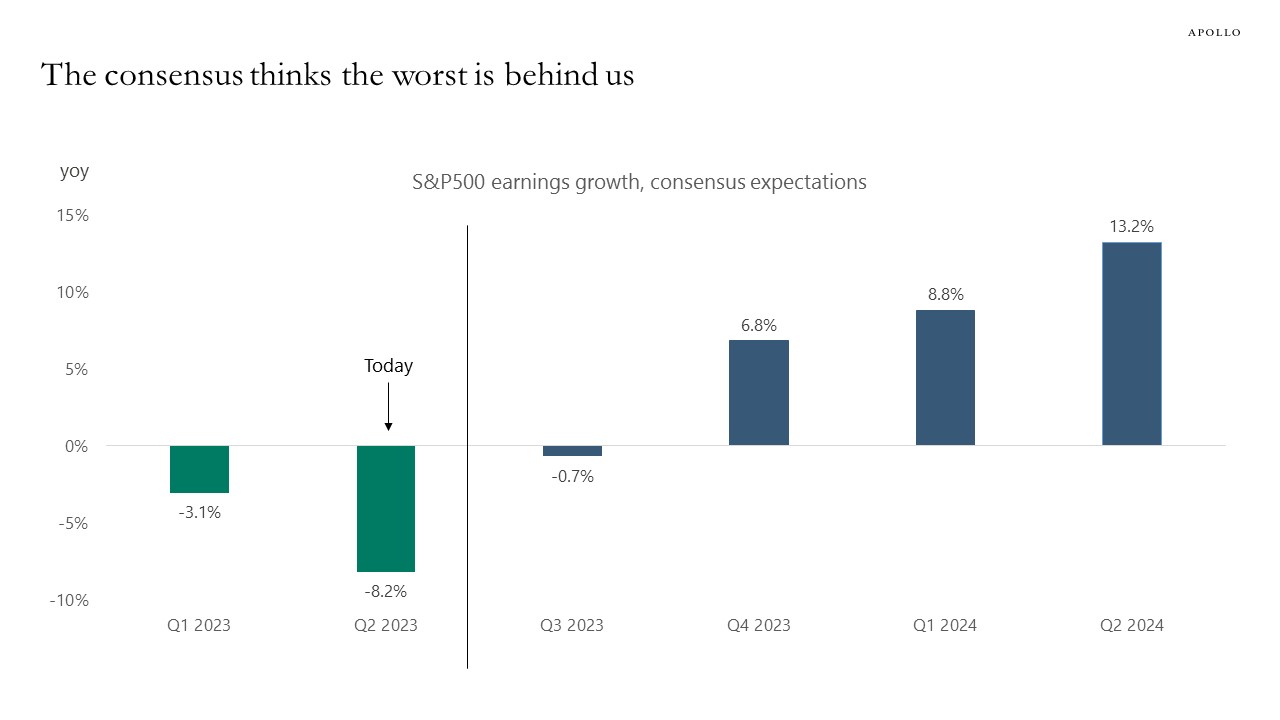
The stock market thinks we have the worst behind us, see chart below, which shows that earnings growth is expected to bottom this quarter and then improve quite rapidly over the coming four quarters.
This forecast will only be correct if core inflation moves quickly down towards 2%. If core inflation remains around 5%, then the Fed will have to put additional downward pressure on demand in the economy and ultimately earnings.
If core inflation remains sticky around 5%, we will likely remain longer in a period with high capital costs and low earnings growth.
Source: Bloomberg (forecast as of June 9), Apollo Chief Economist See important disclaimers at the bottom of the page.
-
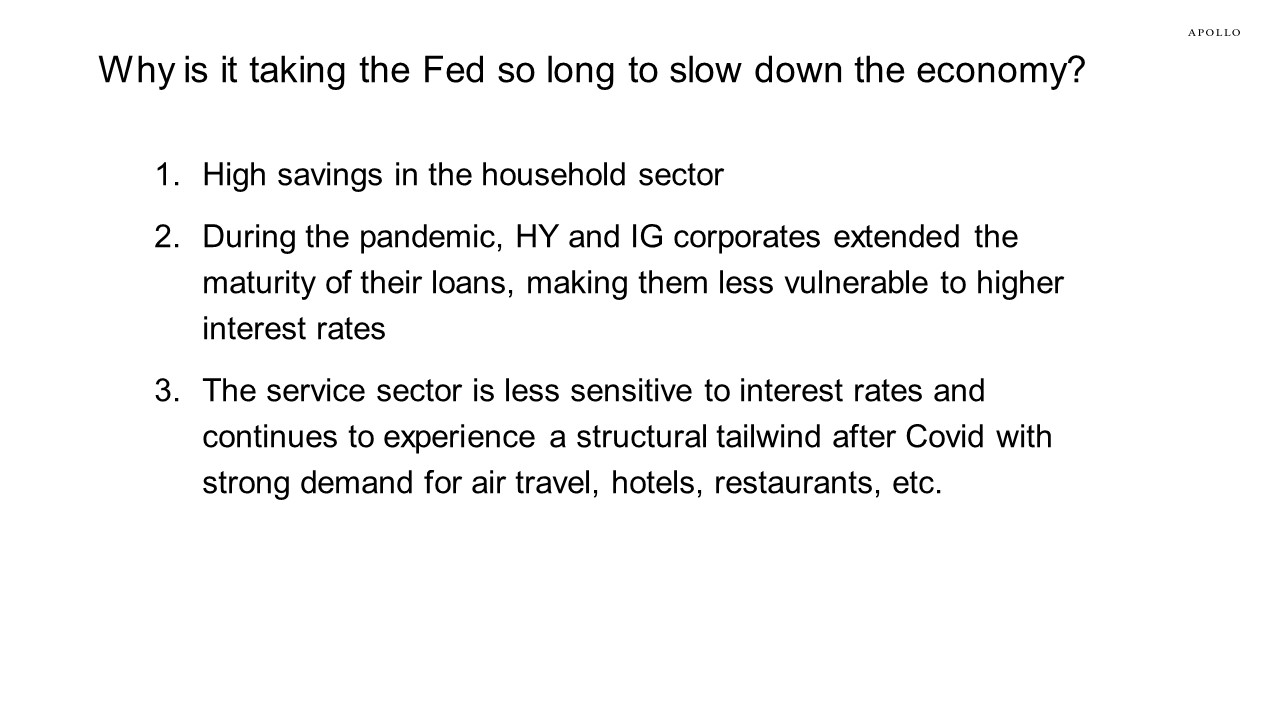
Why is the economy still so strong, and why are Fed hikes not having a bigger negative effect on the economy?
There are three reasons:
1. High savings in the household sector.
2. During the pandemic, IG and HY corporates extended the maturity of their loans, making them less vulnerable to higher rates.
3. The service sector is less sensitive to interest rates and continues to experience a structural tailwind after Covid with strong demand for air travel, hotels, restaurants, etc.
The bottom line is that the weaker transmission mechanism of monetary policy will keep the costs of capital higher for longer because that is what is needed for the Fed to get inflation down from currently 5% to the Fed’s 2% inflation target.
Source: Apollo Chief Economist See important disclaimers at the bottom of the page.
-
Foreigners own about 30% of Japanese equities outstanding, see chart below. Japanese households also hold around 30%, and Japanese pension and insurance only hold 15%.
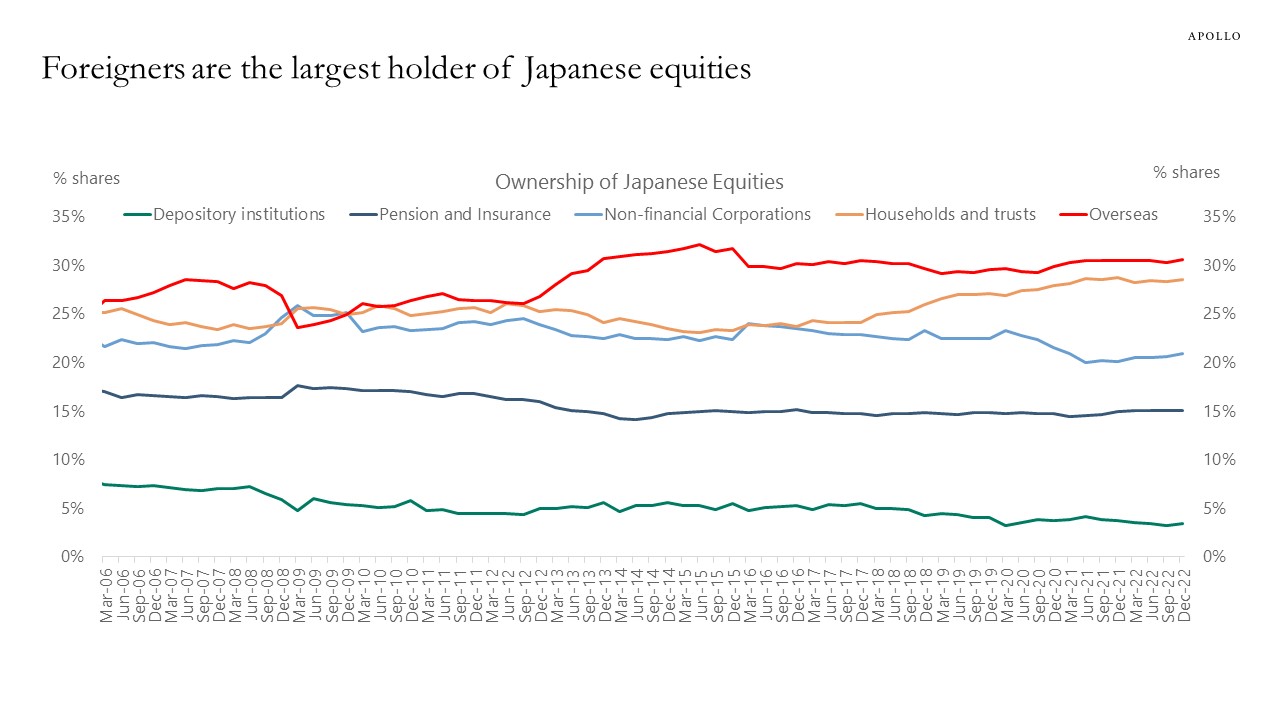
Source: BoJ, Bloomberg, Apollo Chief Economist See important disclaimers at the bottom of the page.
-
The latest data shows a modest improvement in credit card delinquency rates and auto loan delinquency rates for subprime, near prime, and prime borrowers, see chart below. This is the opposite of what would be expected with the Fed trying to tighten financial conditions.
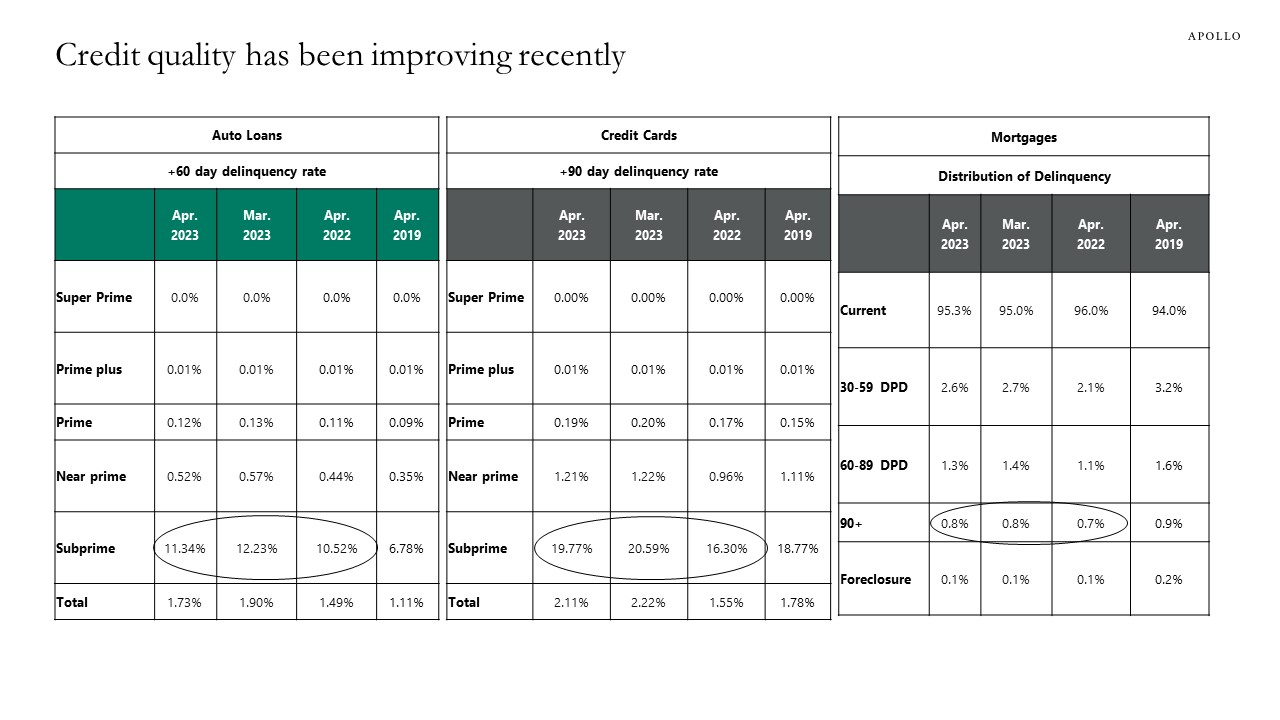
Source: Transunion Monthly Industry Snapshot April 2023 See important disclaimers at the bottom of the page.

This presentation may not be distributed, transmitted or otherwise communicated to others in whole or in part without the express consent of Apollo Global Management, Inc. (together with its subsidiaries, “Apollo”).
Apollo makes no representation or warranty, expressed or implied, with respect to the accuracy, reasonableness, or completeness of any of the statements made during this presentation, including, but not limited to, statements obtained from third parties. Opinions, estimates and projections constitute the current judgment of the speaker as of the date indicated. They do not necessarily reflect the views and opinions of Apollo and are subject to change at any time without notice. Apollo does not have any responsibility to update this presentation to account for such changes. There can be no assurance that any trends discussed during this presentation will continue.
Statements made throughout this presentation are not intended to provide, and should not be relied upon for, accounting, legal or tax advice and do not constitute an investment recommendation or investment advice. Investors should make an independent investigation of the information discussed during this presentation, including consulting their tax, legal, accounting or other advisors about such information. Apollo does not act for you and is not responsible for providing you with the protections afforded to its clients. This presentation does not constitute an offer to sell, or the solicitation of an offer to buy, any security, product or service, including interest in any investment product or fund or account managed or advised by Apollo.
Certain statements made throughout this presentation may be “forward-looking” in nature. Due to various risks and uncertainties, actual events or results may differ materially from those reflected or contemplated in such forward-looking information. As such, undue reliance should not be placed on such statements. Forward-looking statements may be identified by the use of terminology including, but not limited to, “may”, “will”, “should”, “expect”, “anticipate”, “target”, “project”, “estimate”, “intend”, “continue” or “believe” or the negatives thereof or other variations thereon or comparable terminology.