


Want it delivered daily to your inbox?
-
In many European countries, a wage-price spiral is institutionalized through collective wage agreements, see chart below. If inflation is high, then wage inflation will also be high.
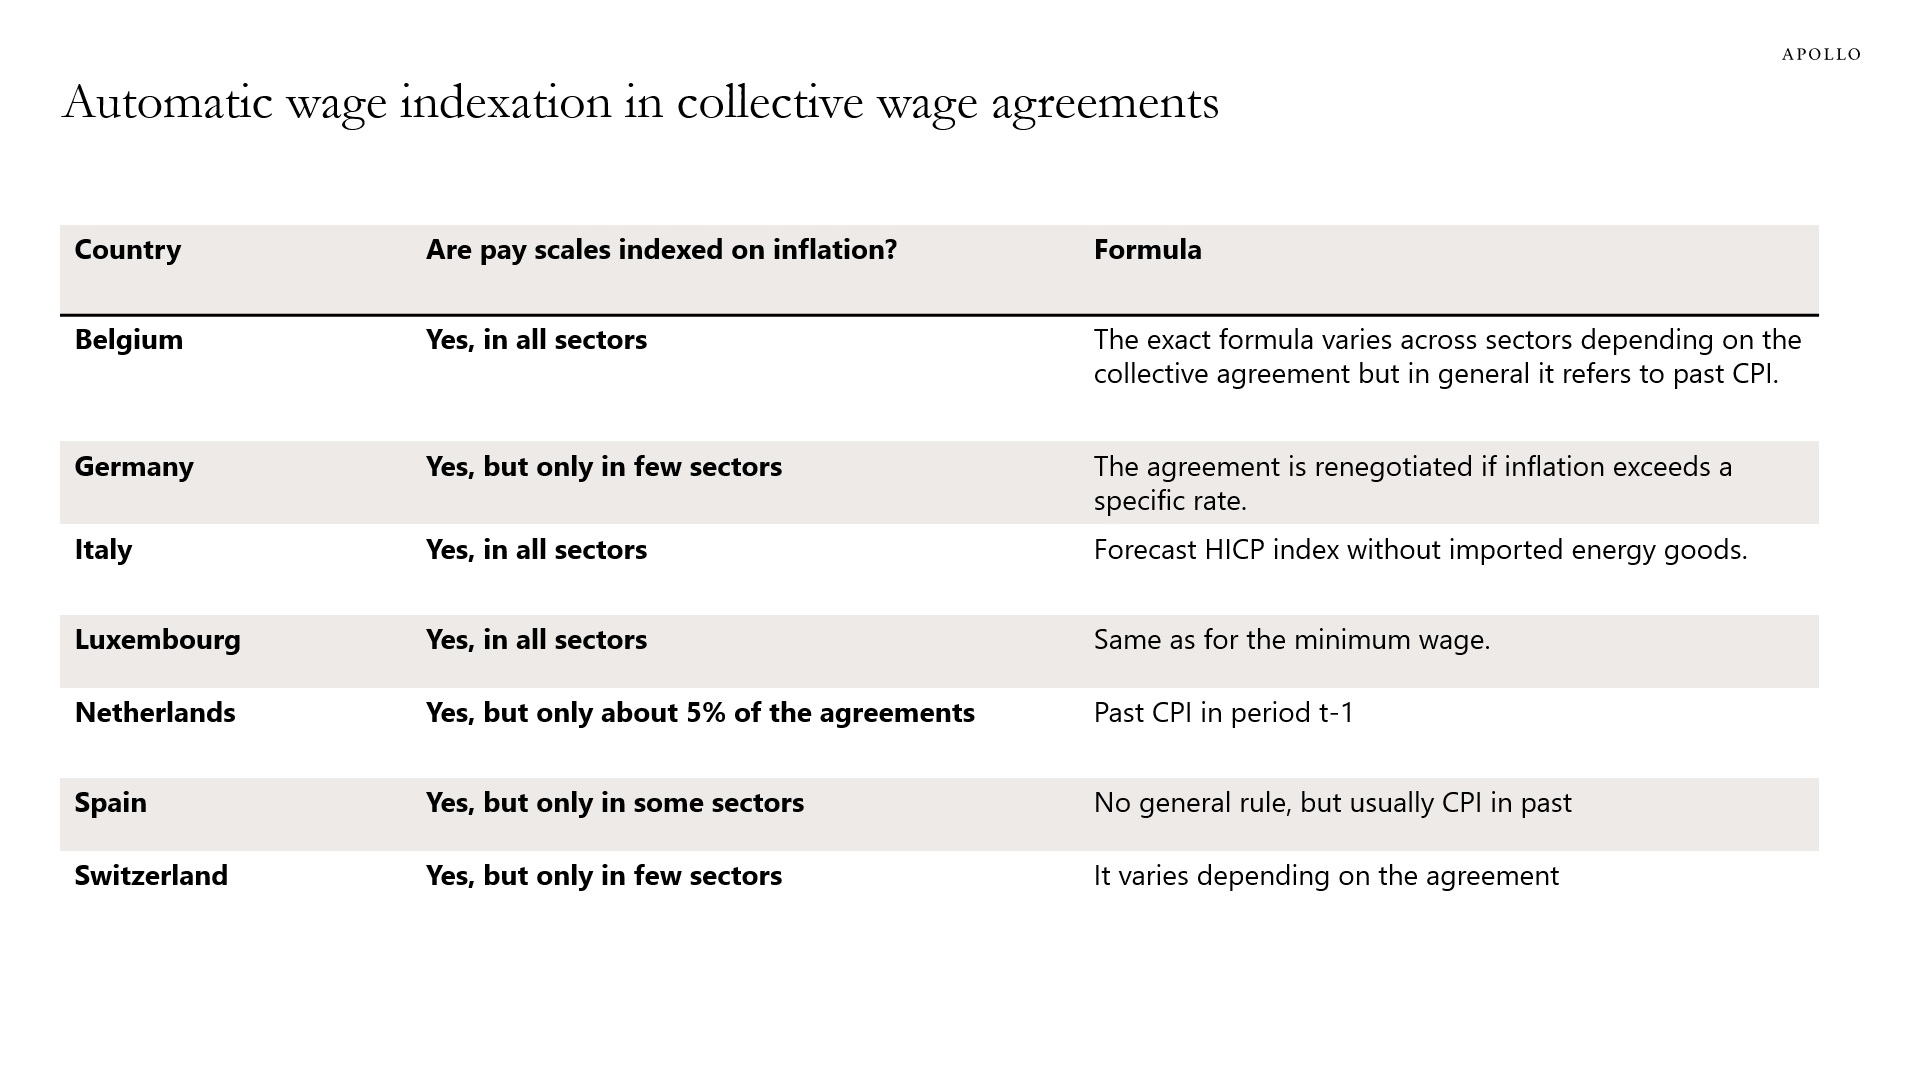
Source: OECD Questionnaire on recent measures to deal with inflation pressure on wages (February 2023), Apollo Chief Economist See important disclaimers at the bottom of the page.
-
The Fed is shrinking its balance sheet, but they still own 35% of all Treasuries with a maturity of 10 years or more, and they own about 20% of the belly of the curve, see chart below.
The supply of Treasury bonds and notes will stay high over the coming months because of QT, ongoing budget deficits, and the existing large stock of T-bills maturing.
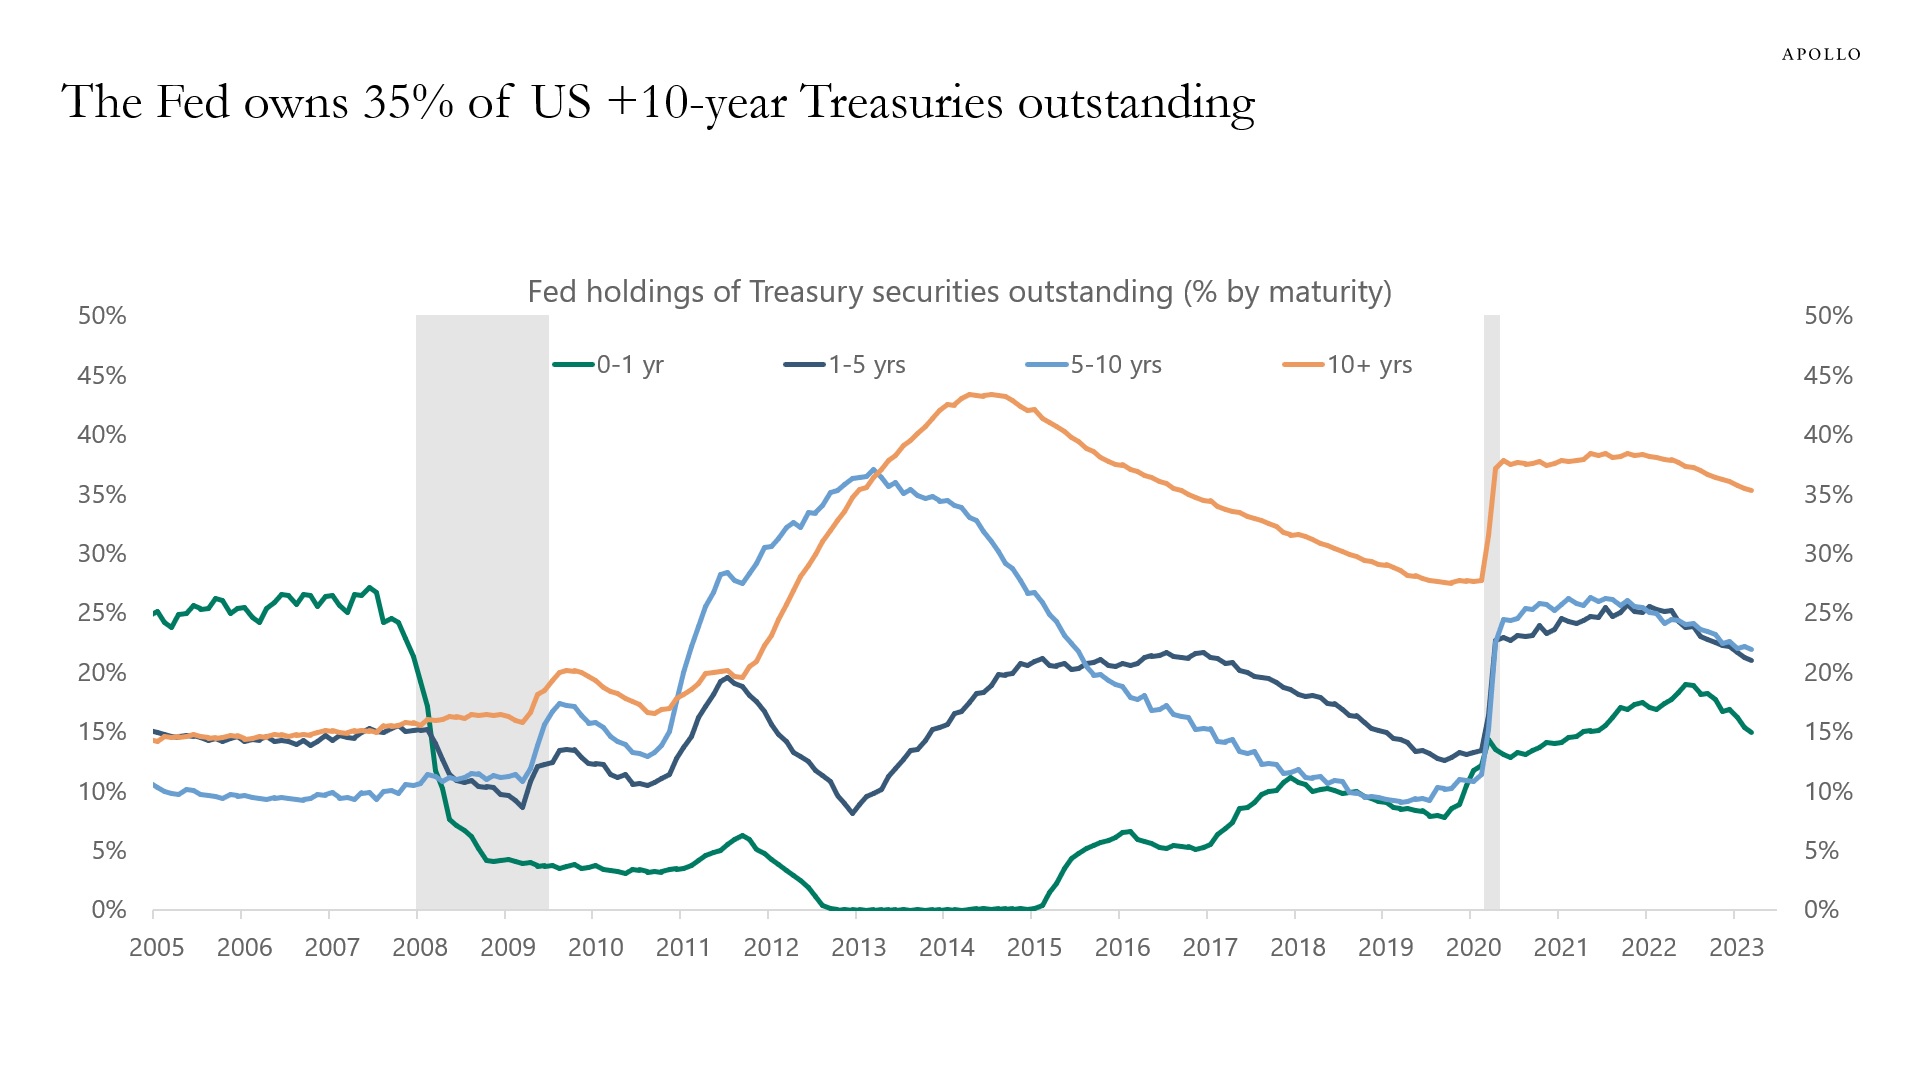
Source: FRB, Treasury, Haver Analytics, Apollo Chief Economist See important disclaimers at the bottom of the page.
-
Since the beginning of this year, the consensus has lowered the probability of a recession in Europe and UK. But for the US, the recession probability has remained constant at 65%. In fact, the consensus now thinks there is a higher probability of a recession in the US in the next 12 months than in Europe and UK, see chart below.
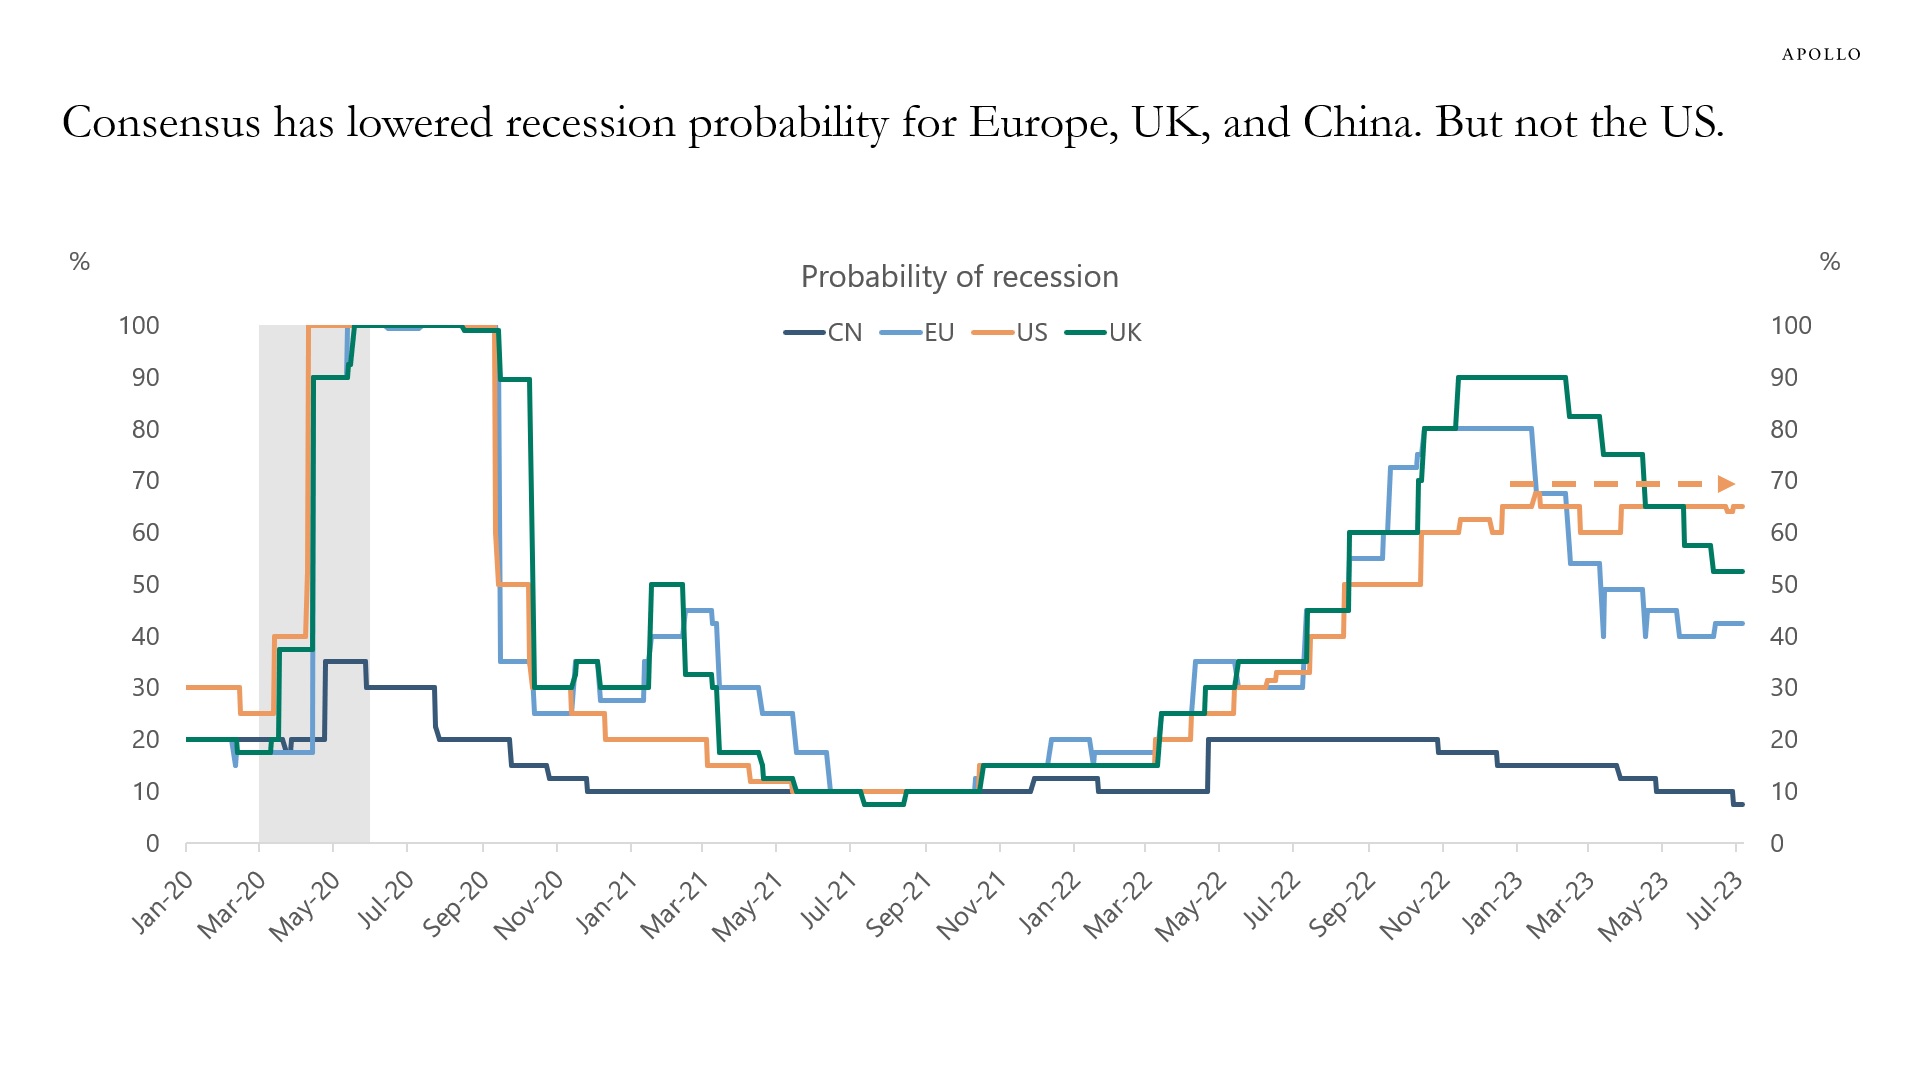
Source: Bloomberg, Apollo Chief Economist See important disclaimers at the bottom of the page.
-
Since the Fed started hiking in March 2022, interest rates on auto loans have increased from 4.5% to 7.5%, interest rates on credit cards have risen from 16% to 22%, and loan growth has been slowing for both small and large banks, see the first three charts below.
With the Fed still hiking and saying they will keep interest rates at current levels “for a couple of years,” the ongoing slowdown in consumer spending will continue, see the fourth chart.
The bottom line is that monetary policy is working exactly as it is supposed to: Higher rates are leading to slower growth.
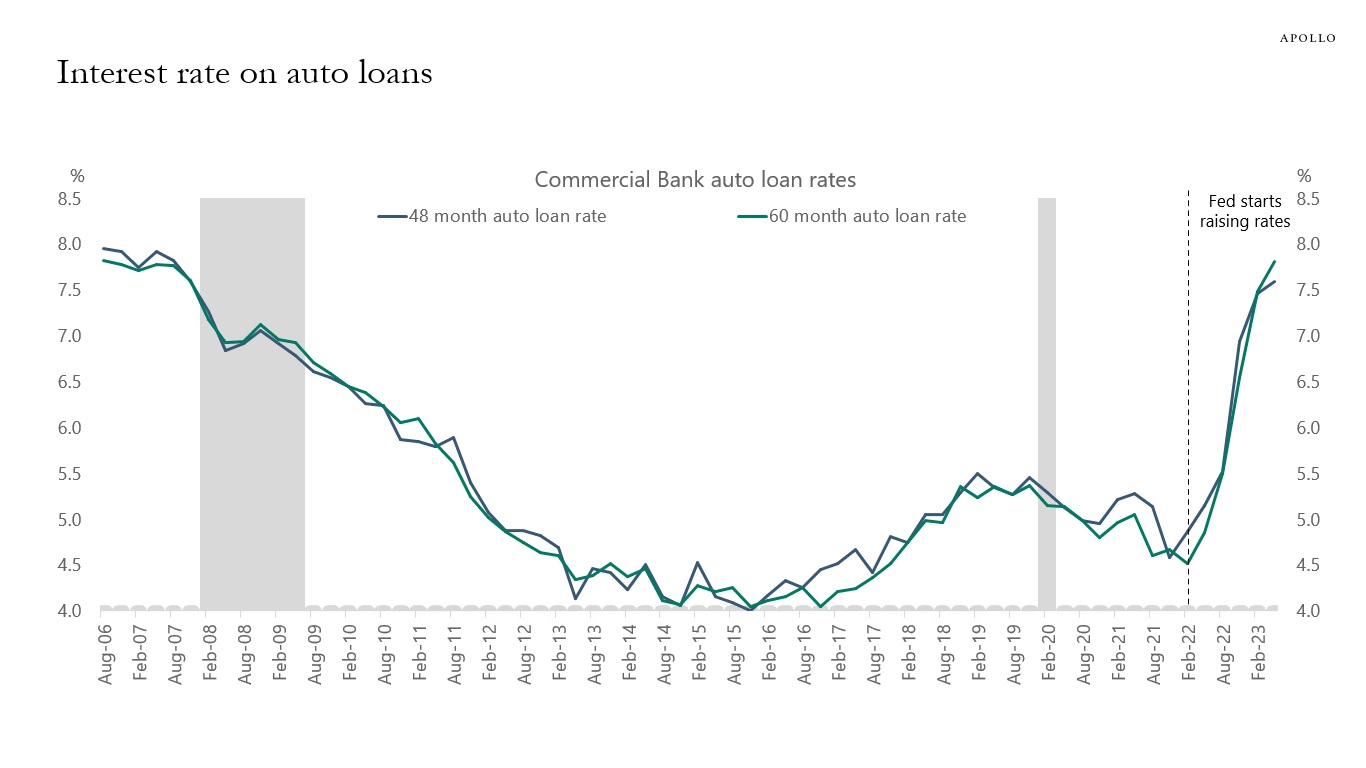
Source: FRB, Bloomberg, Apollo Chief Economist 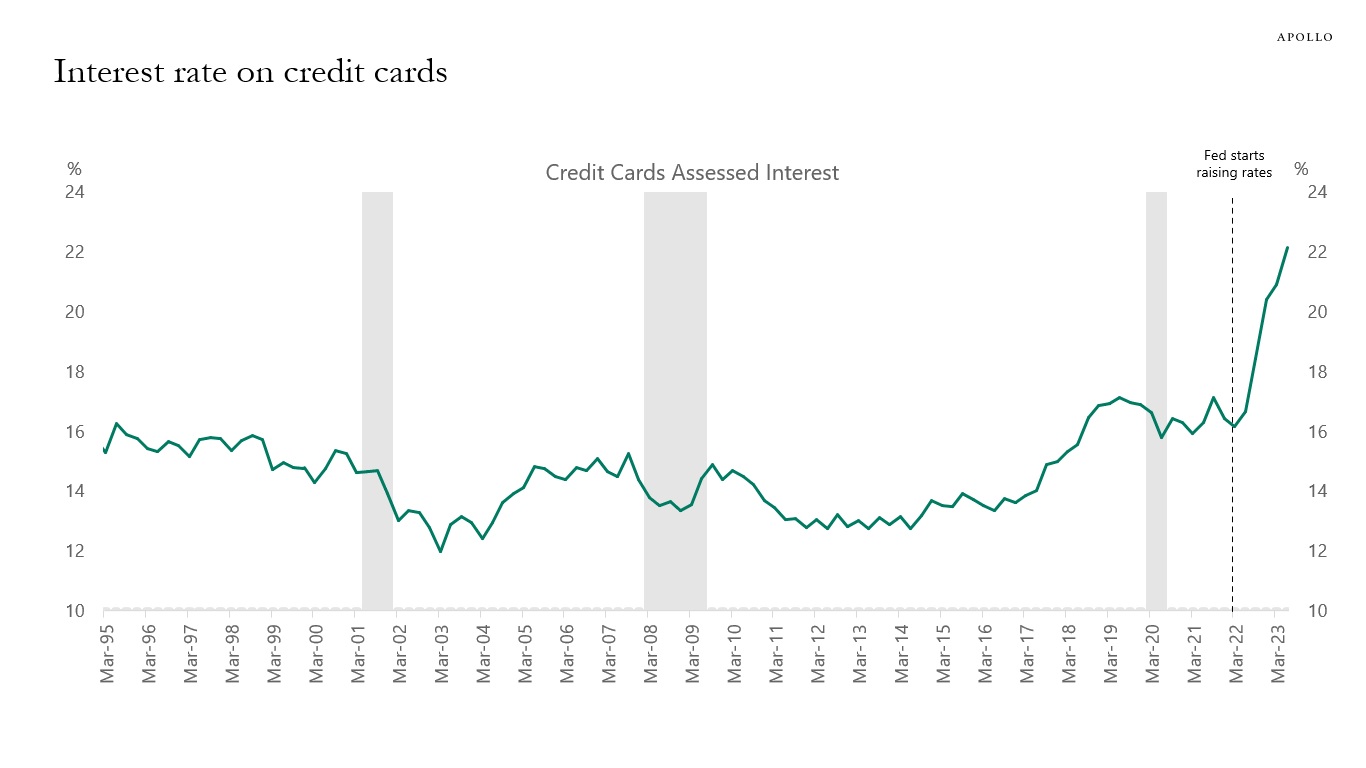
Source: FRB, Haver Analytics, Apollo Chief Economist 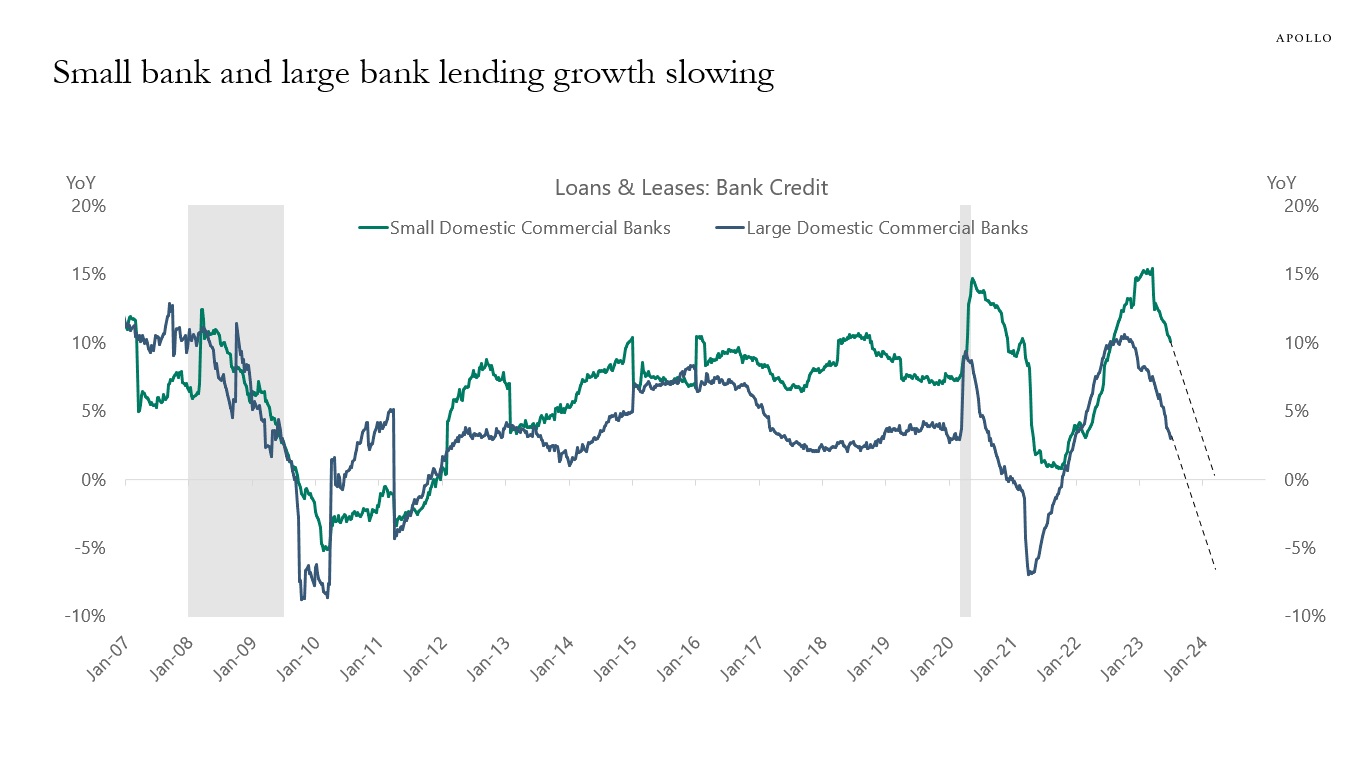
Source: Federal Reserve Board, Haver Analytics, Apollo Chief Economist 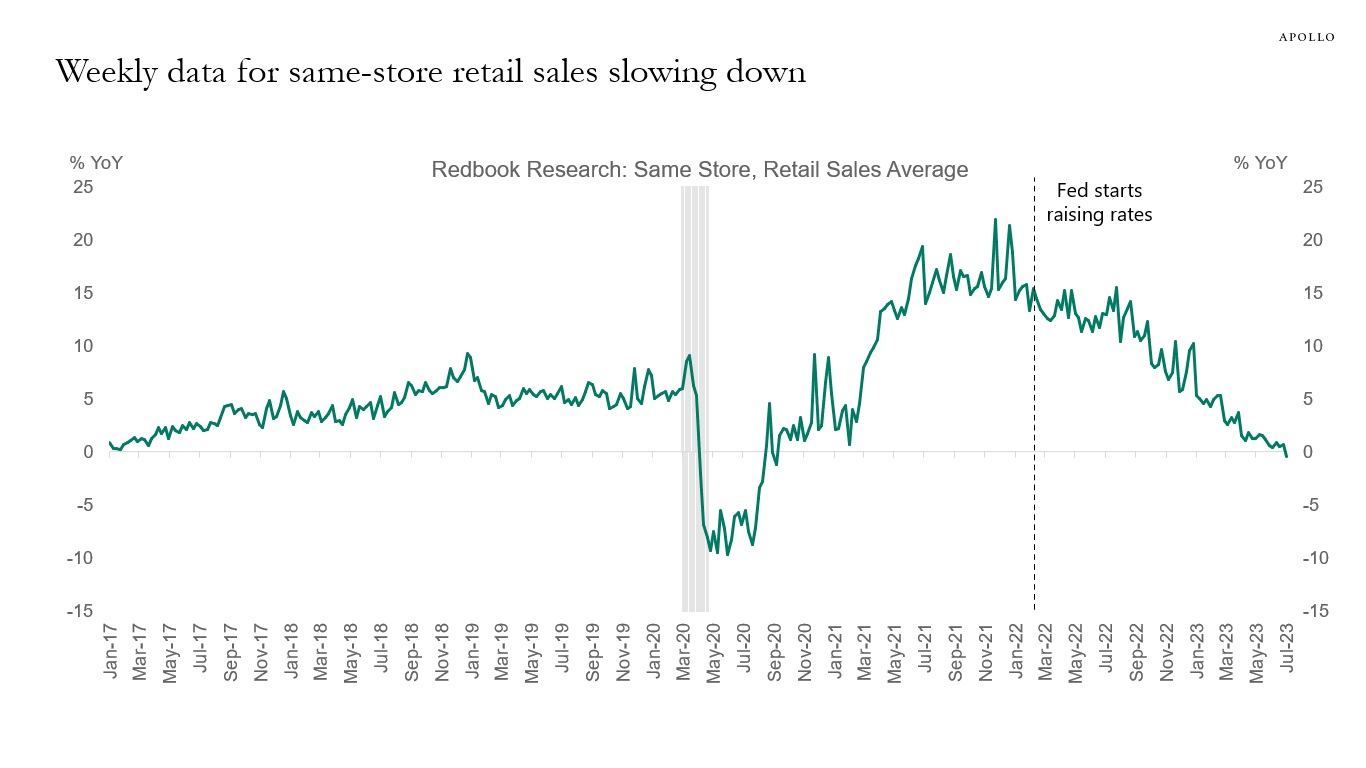
Source: Redbook, Haver Analytics, Apollo Chief Economist See important disclaimers at the bottom of the page.
-
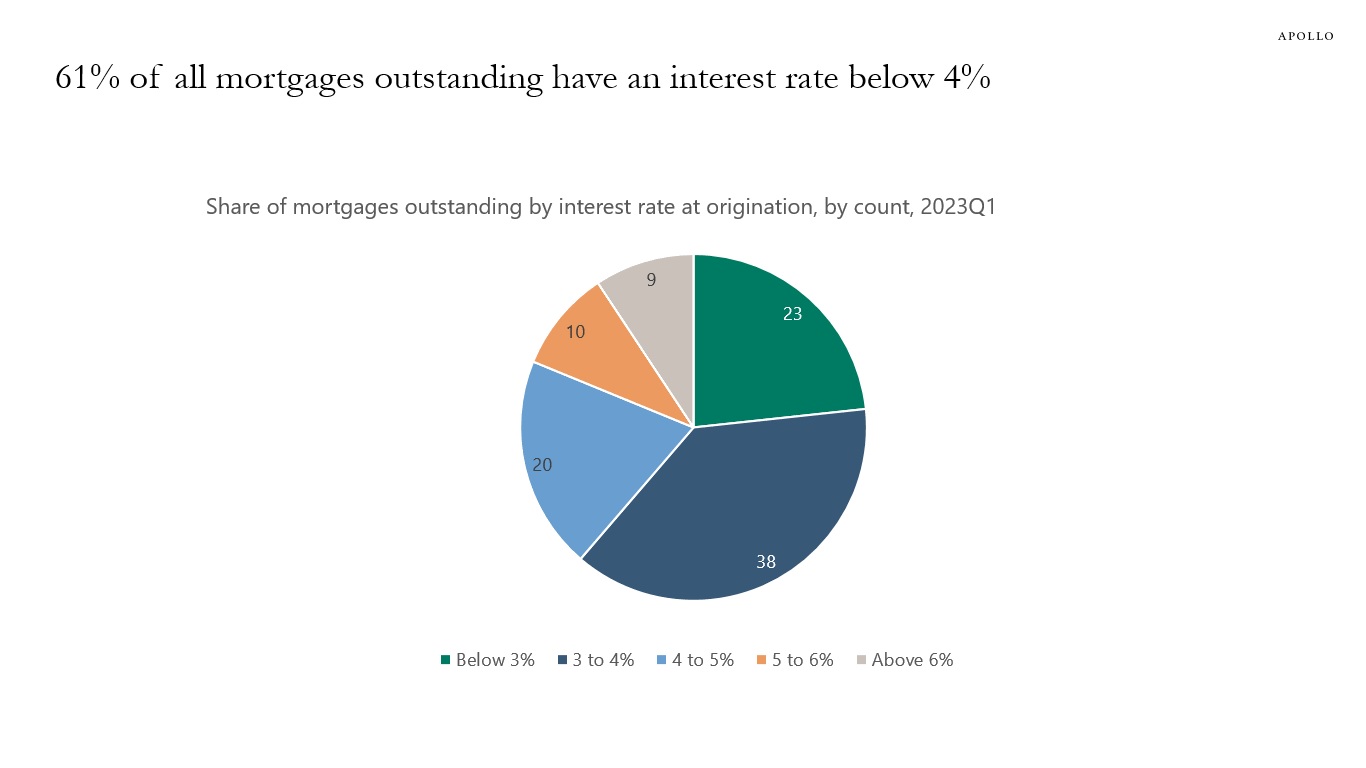
Twenty-three percent of all mortgages outstanding have an interest rate below 3%, 38% are between 3% and 4%, and only 9% of all mortgages outstanding were originated with an interest rate above 6%, see the first chart.
The bottom line is that homeowners across America do not have any incentive to move and get a new mortgage with mortgage rates currently at 7.25%.
This is a key reason why the supply in the housing market continues to be so low, see the second chart.
Source: FHFA, Apollo Chief Economist
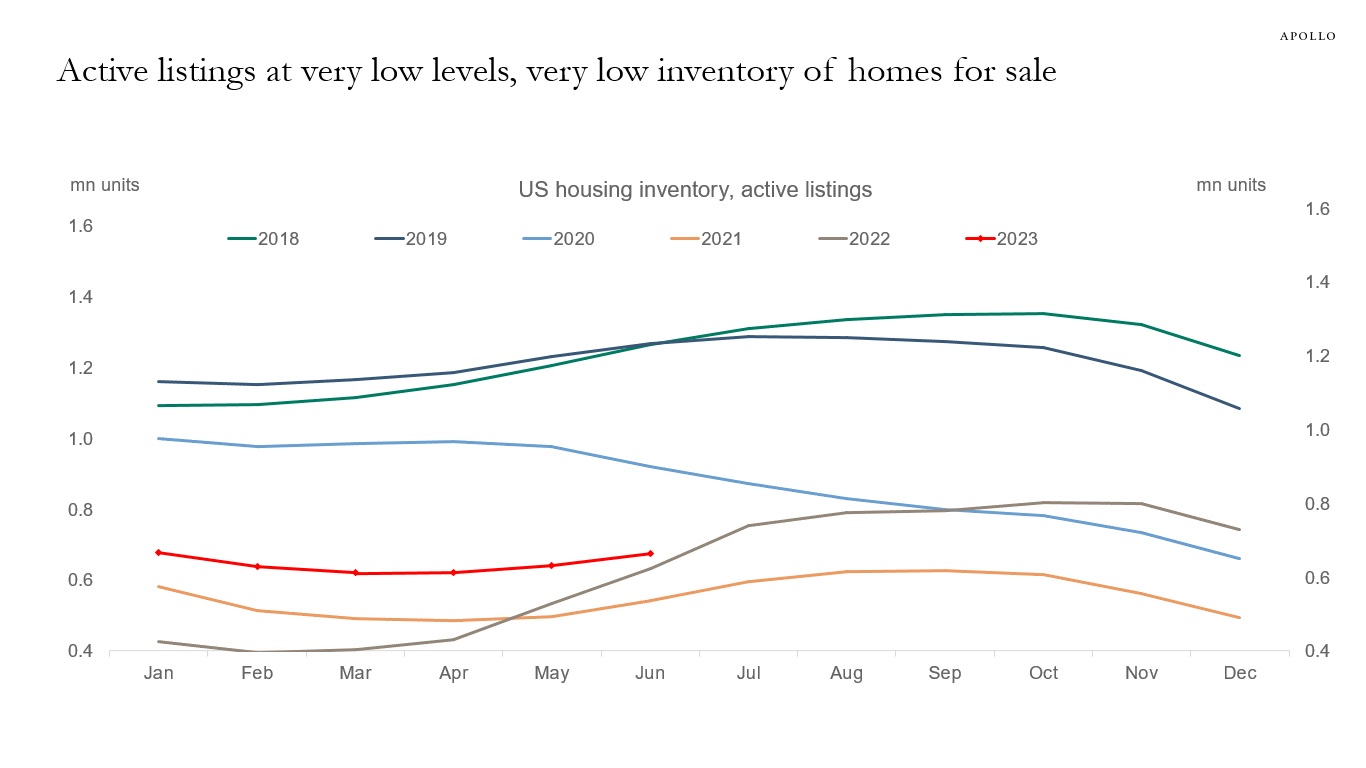
Source: Realtor.com, Apollo Chief Economist See important disclaimers at the bottom of the page.
-
The chart below shows the average probability of not being able to make minimum debt payments over the next three months for people earning more than $100,000. The bottom line is that higher-income households are starting to worry about their finances.
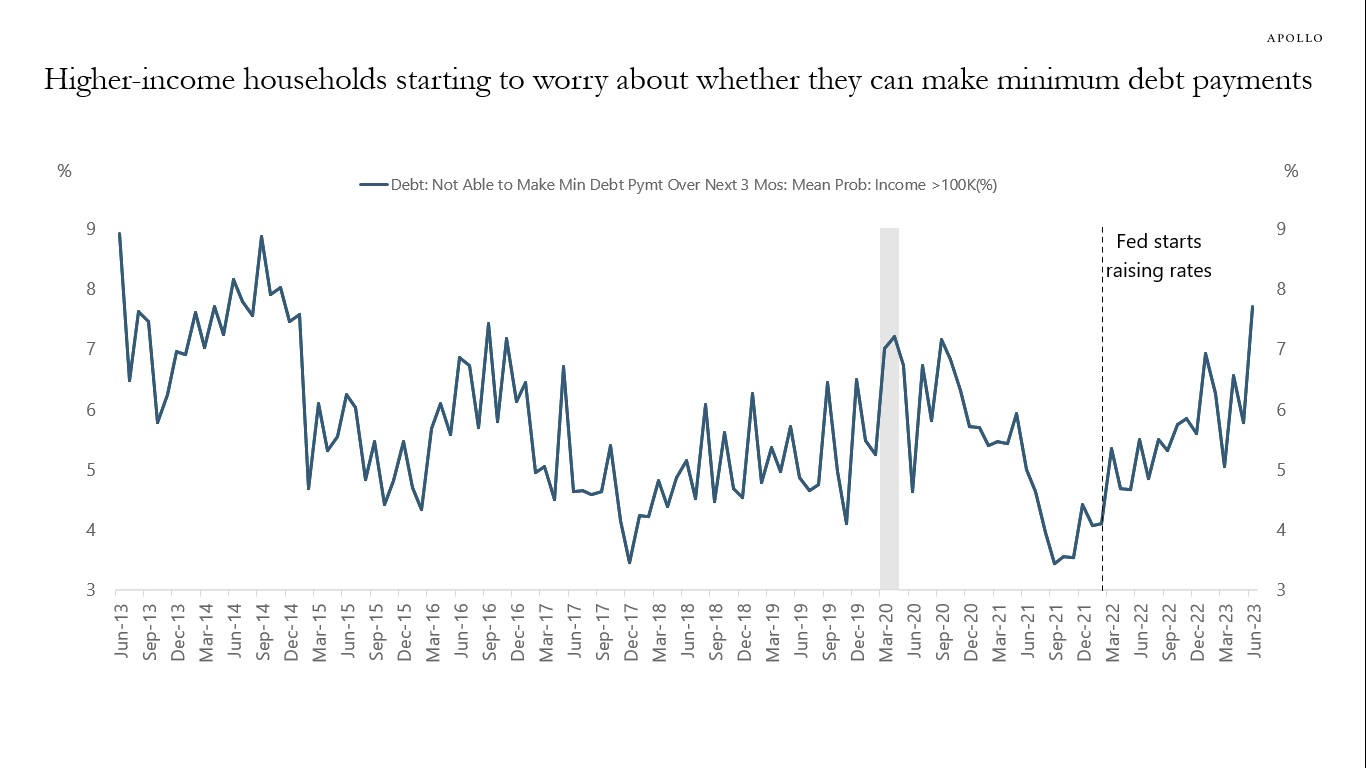
Source: FRBNY, Haver Analytics, Apollo Chief Economist. Note: The data shows the average probability of not being able to make minimum debt payment over the next three months for people earning (income) greater than $100K. See important disclaimers at the bottom of the page.
-
The Fed has raised the Fed funds rate to 5%, and the lagged effects of Fed hikes will continue to drag down growth over the coming 12 months. See chart below, which shows a simulation with the impact of a 5% increase in the Fed funds rate on the level of GDP done on a variant of the Fed’s FR/BUS model of the US economy.
In other words, the transmission mechanism of monetary policy takes time, and the drag on growth from lagged Fed hikes over the coming year will be significant. That is why a recession is a more likely outcome than a soft landing, no matter what happens to inflation.
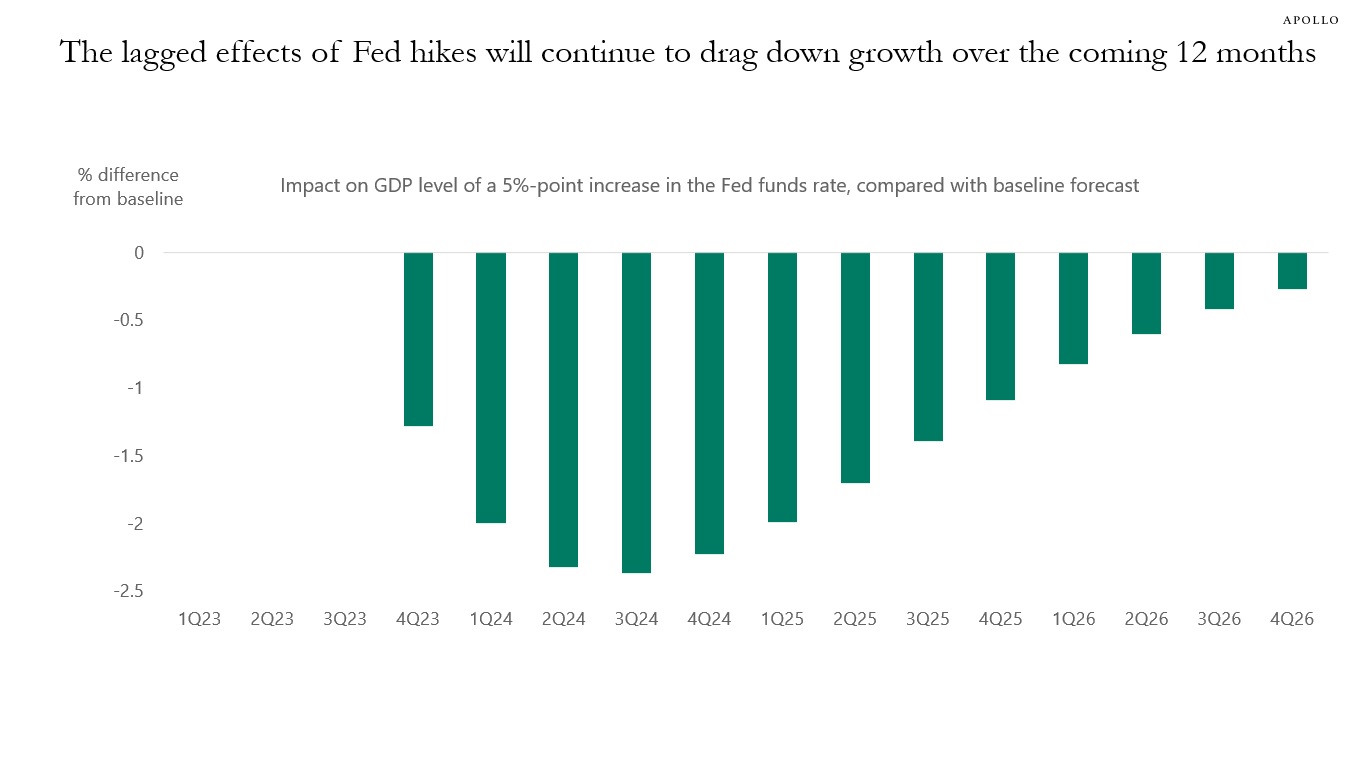
Source: Bloomberg, Apollo Chief Economist. Note: 500bps monetary policy shock in 3Q23. See important disclaimers at the bottom of the page.
-
The market seems to be of the view that if inflation quickly declines to the Fed’s 2% target, then everything will be fine and stocks will continue to go up, and credit spreads will continue to narrow.
There are two problems with this logic.
1) If inflation comes down faster than the Fed expects, it is because the economy is slowing faster than the Fed expects. For example, if wholesale car prices decline more quickly than expected, then it is driven by a sharper-than-expected drop-off in demand for cars.
2) The Fed and academics agree that it takes 12 to 18 months before monetary policy impacts the economy, and this is true both when the Fed is raising rates and when they are cutting rates. So if inflation quickly declines to 2%, we would still have 12 to 18 months of slowing growth ahead of us.
The bottom line is that no matter what happens to inflation, the lagged effects of Fed hikes will continue to drag the economy down over the coming 12 to 18 months, and that is why a recession is a more likely outcome than a soft landing, see chart below.
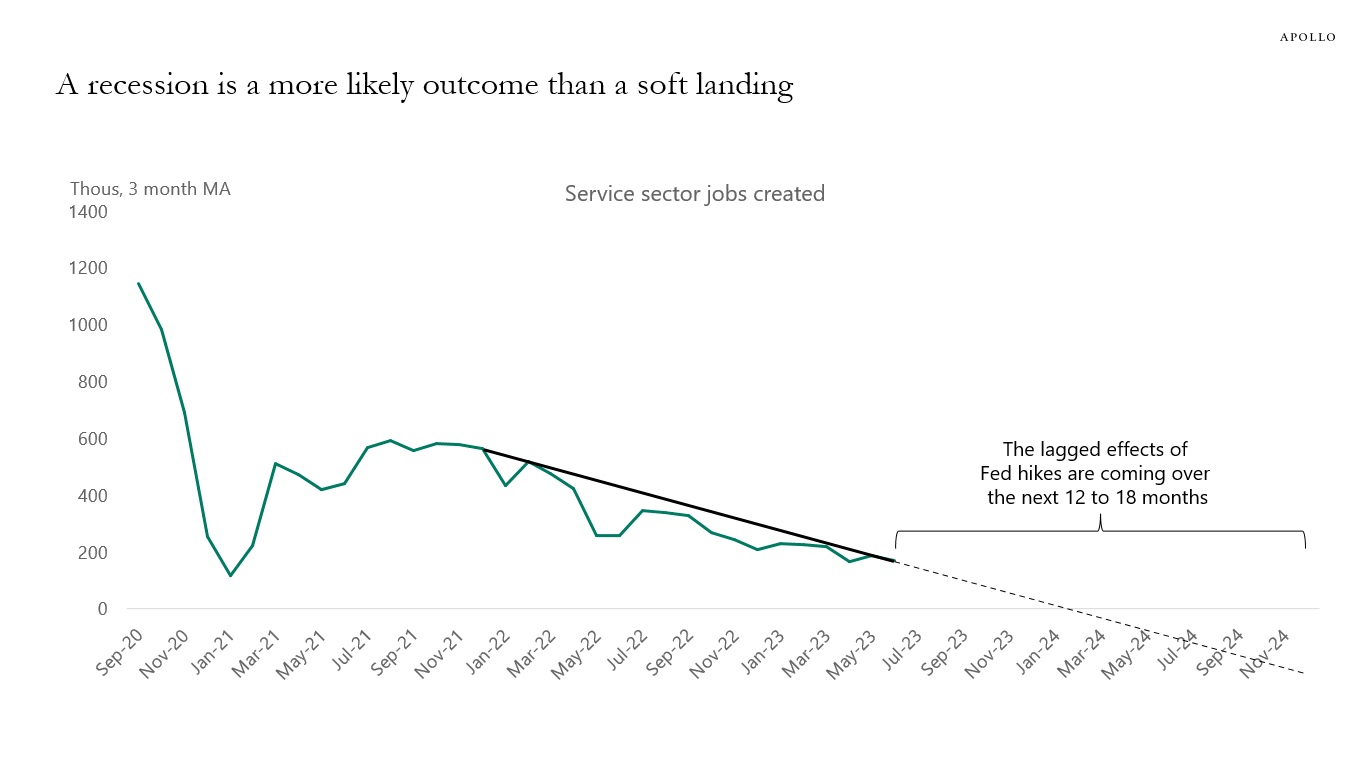
Source: BLS, Haver Analytics, Apollo Chief Economist See important disclaimers at the bottom of the page.
-
Both London and New York are seeing a gradual move back towards normal. London underground usage is 80% of pre-pandemic levels, and New York City subway usage is 70%, see charts below. The rising trends in these charts bode well for a recovery over time in office, retail, and commercial real estate more broadly.
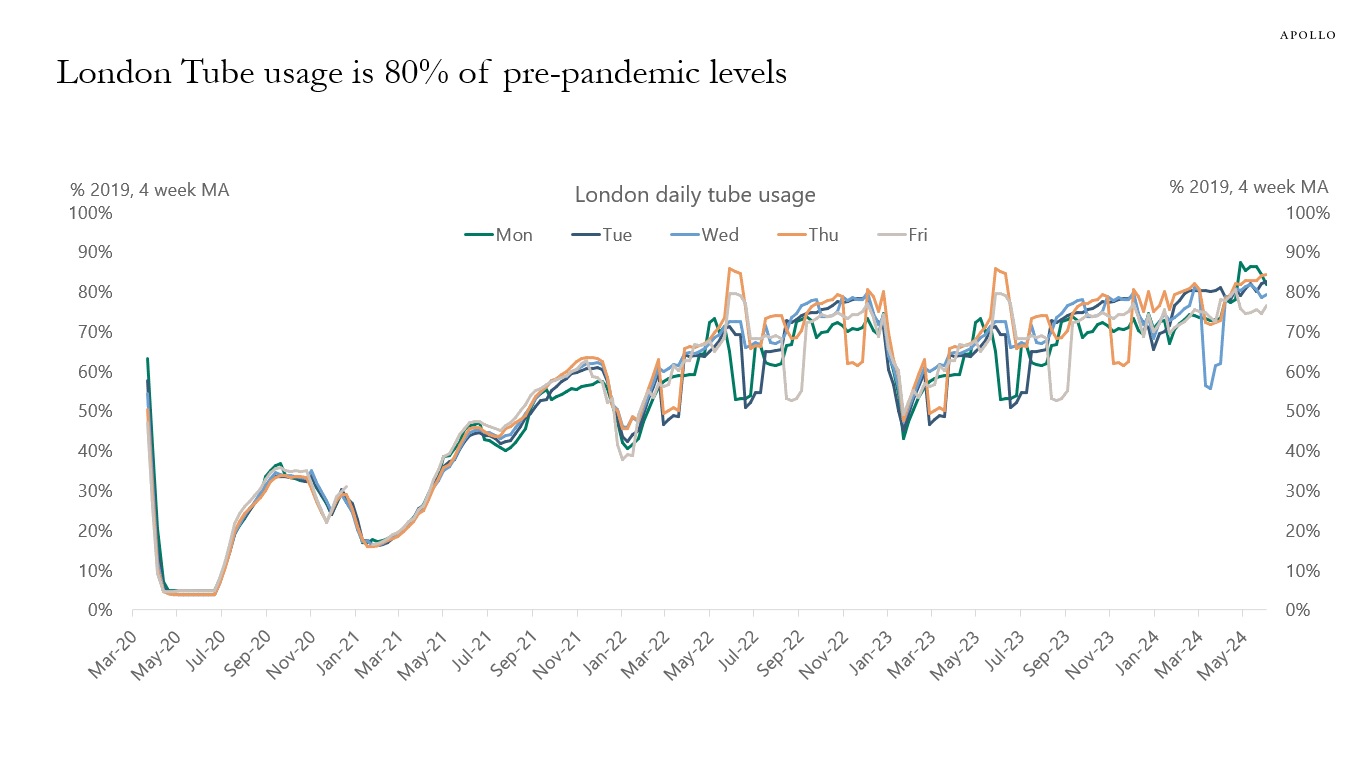
Source: ONS, TfL, Apollo Chief Economist 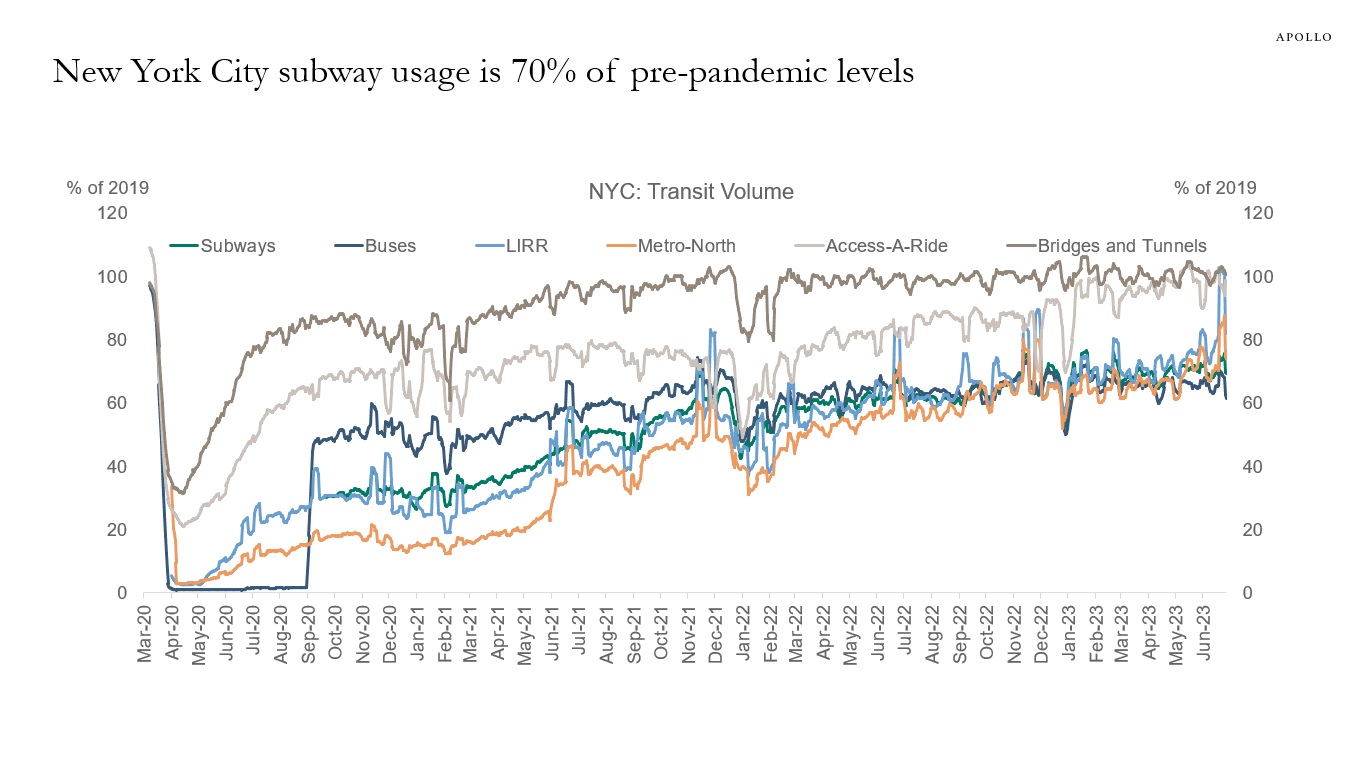
Source: MTA, Apollo Chief Economist See important disclaimers at the bottom of the page.
-
High rates and a slowing economy are creating opportunities for credit investors. Our latest credit market outlook is available here, key charts inserted below.
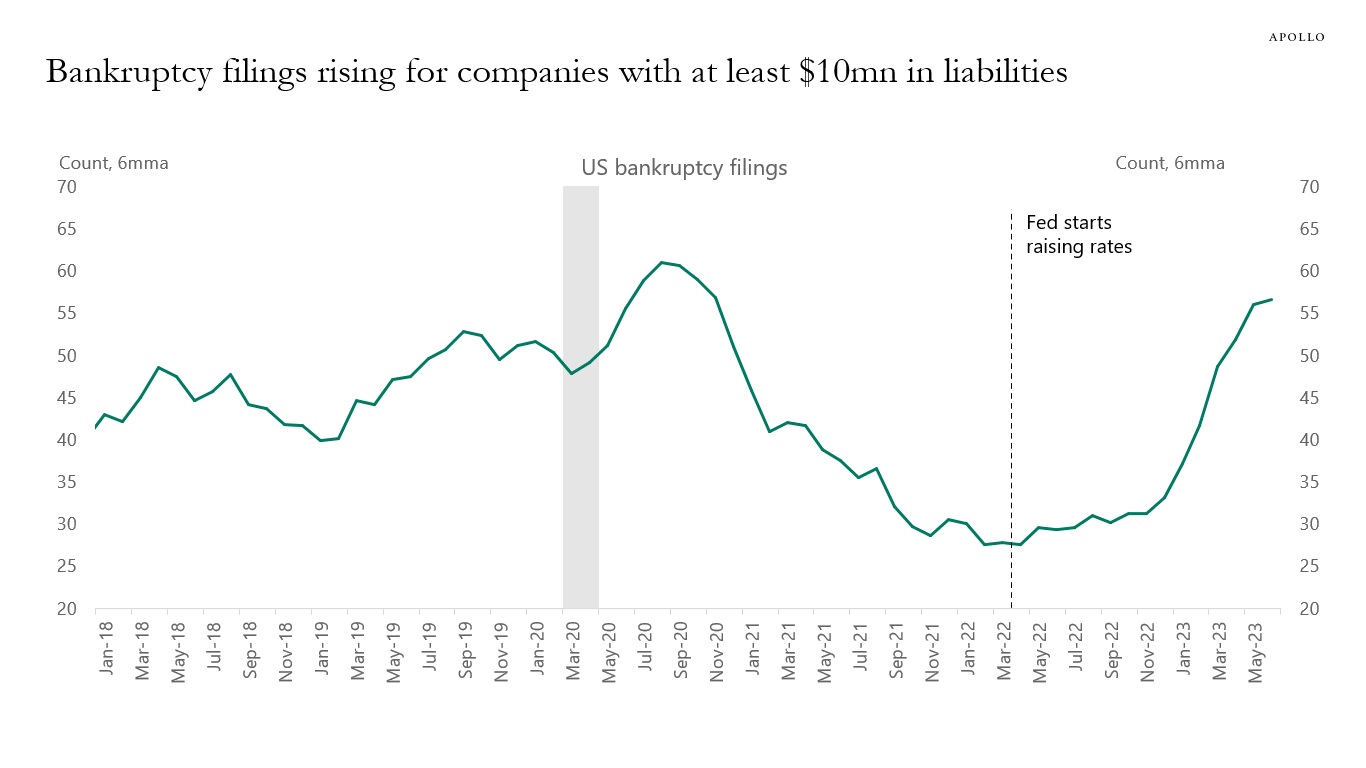
Source: S&P Capital IQ, Bloomberg, Apollo Chief Economist. Note: Bankruptcy figures include public companies or private companies with public debt with a minimum of $2 million in assets or liabilities at the time of filing, in addition to private companies with at least $10 million in assets or liabilities. 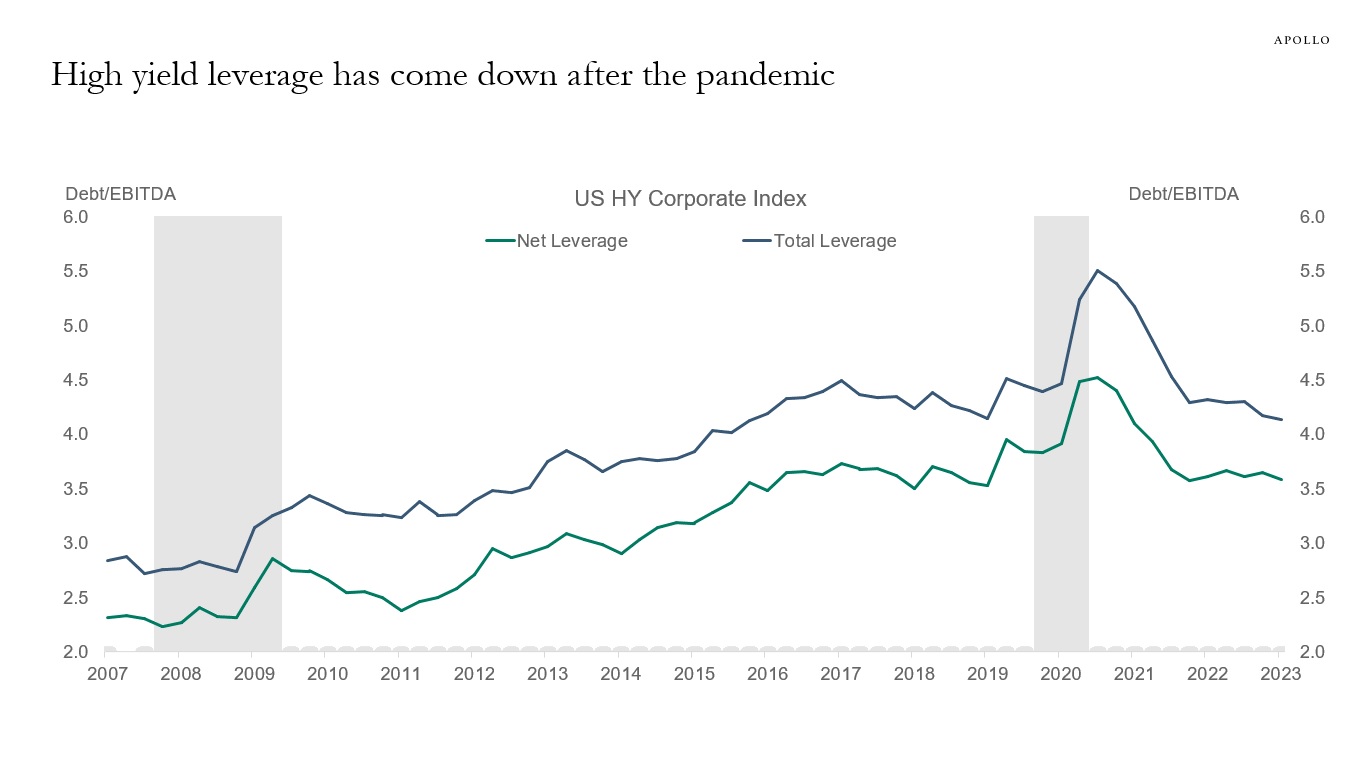
Source: Bloomberg, Apollo Chief Economist. Note: Median leverage for the bonds in H0A0 index. 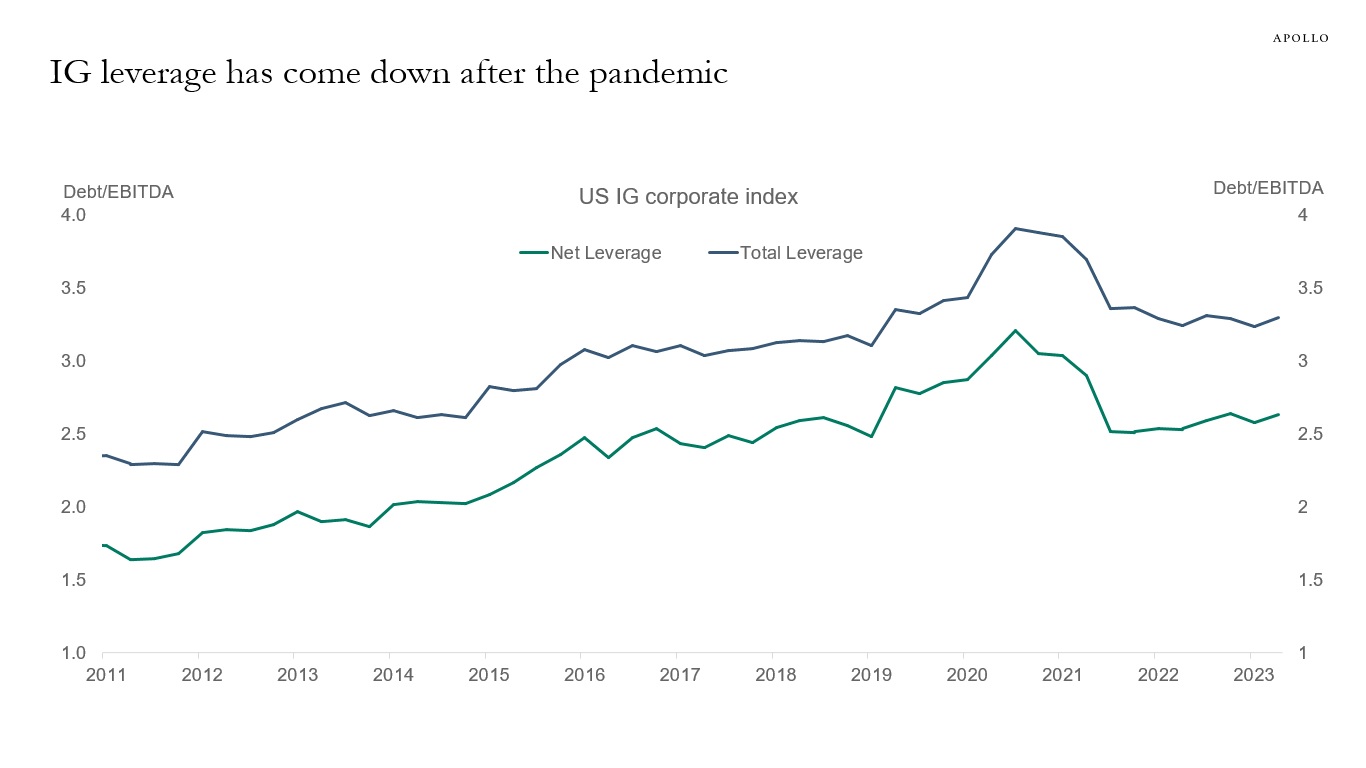
Source: ICE BofA, Bloomberg, Apollo Chief Economist. Note: Index used C0A0 Index. 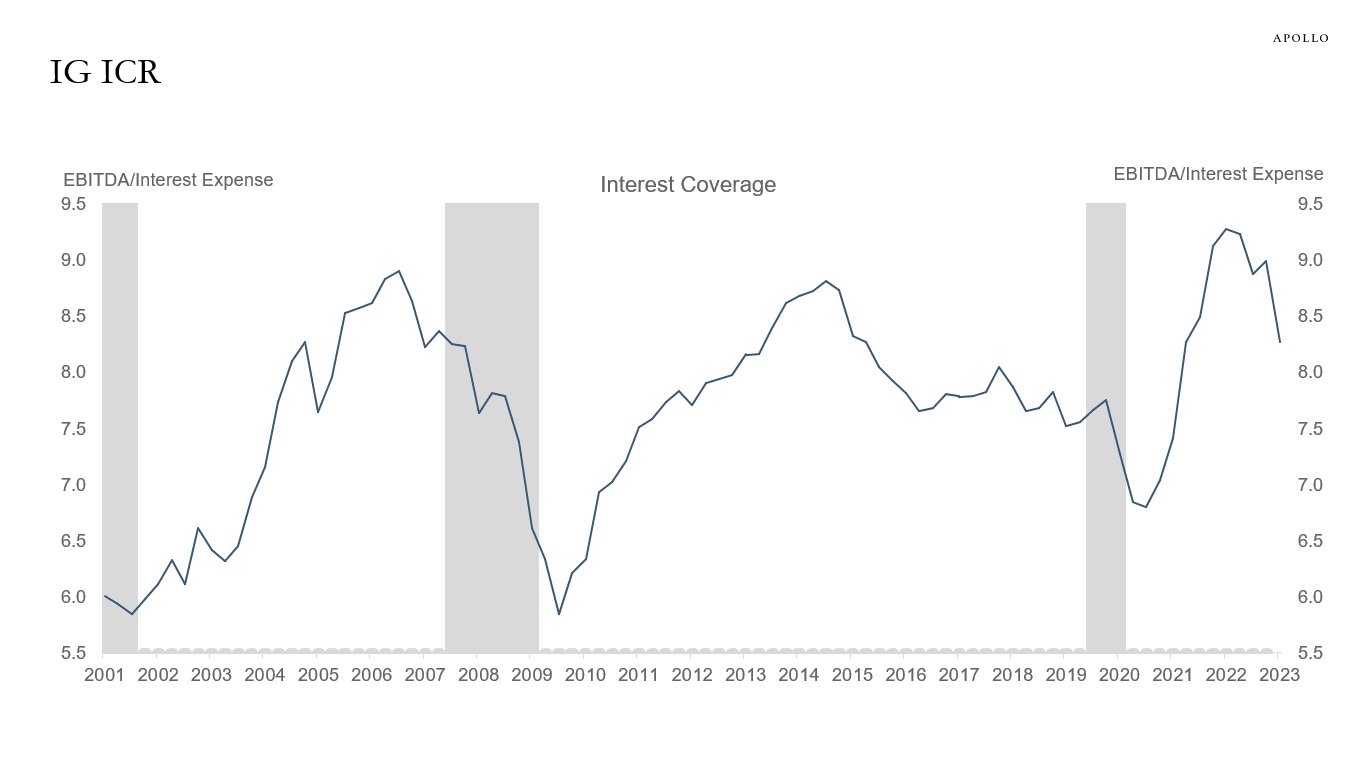
Source: Bloomberg, Apollo Chief Economist 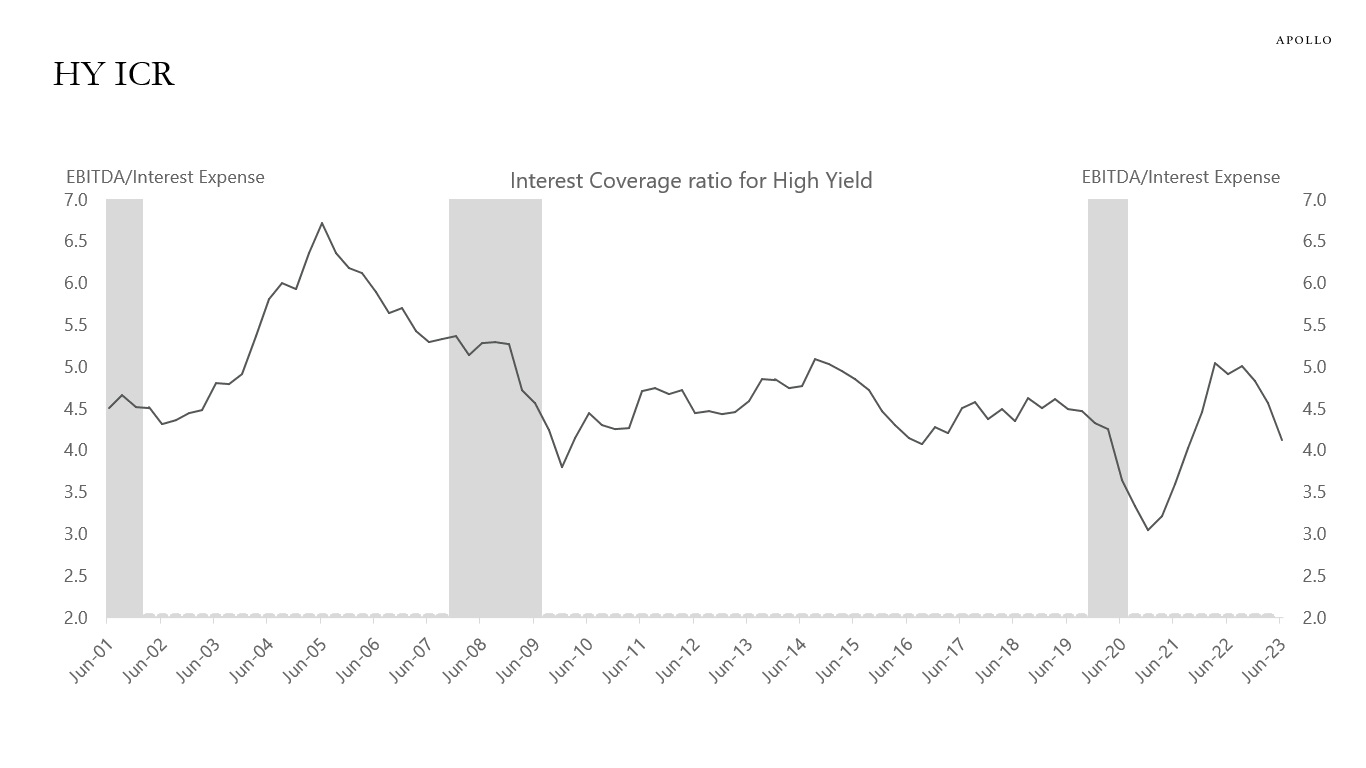
Source: Bloomberg, Apollo Chief Economist 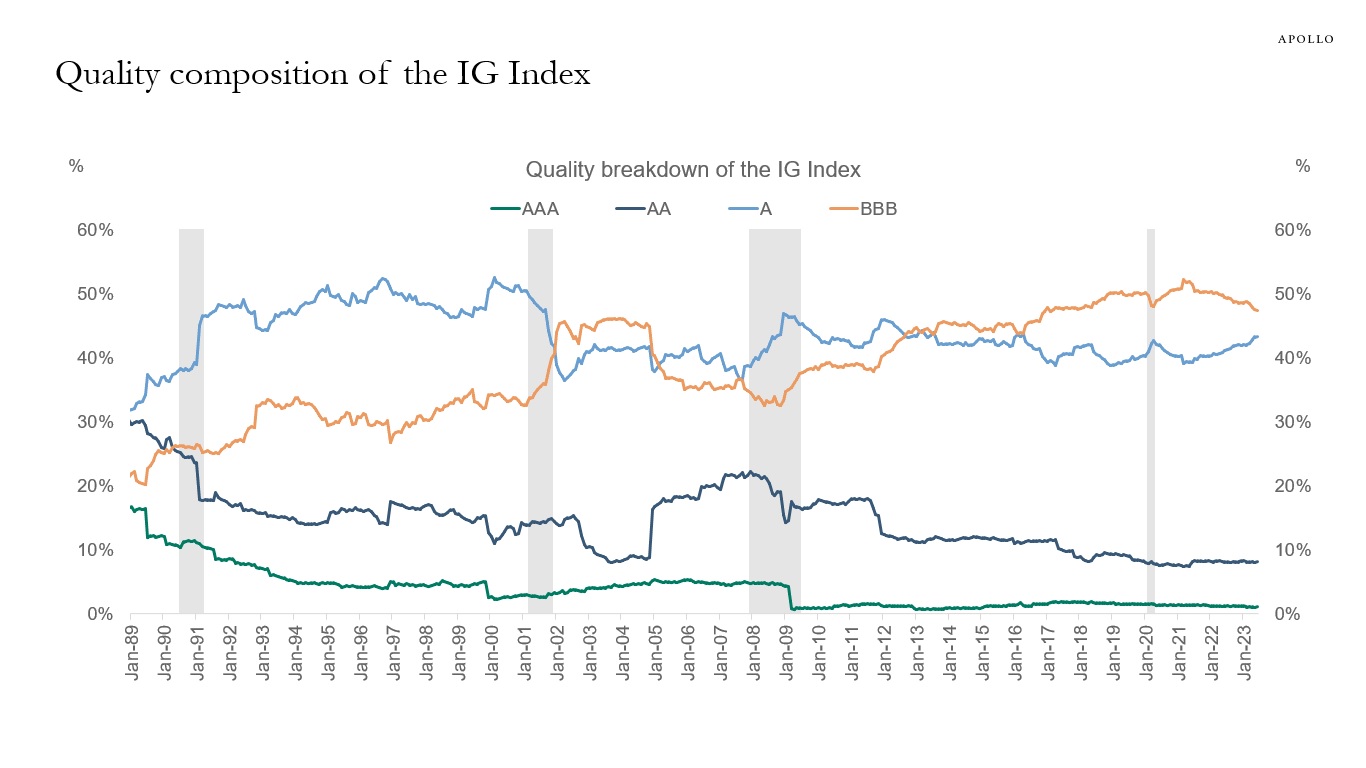
Source: ICE BofA, Bloomberg, Apollo Chief Economist. Note: Breakdown by market value. Data as of June 30, 2023. 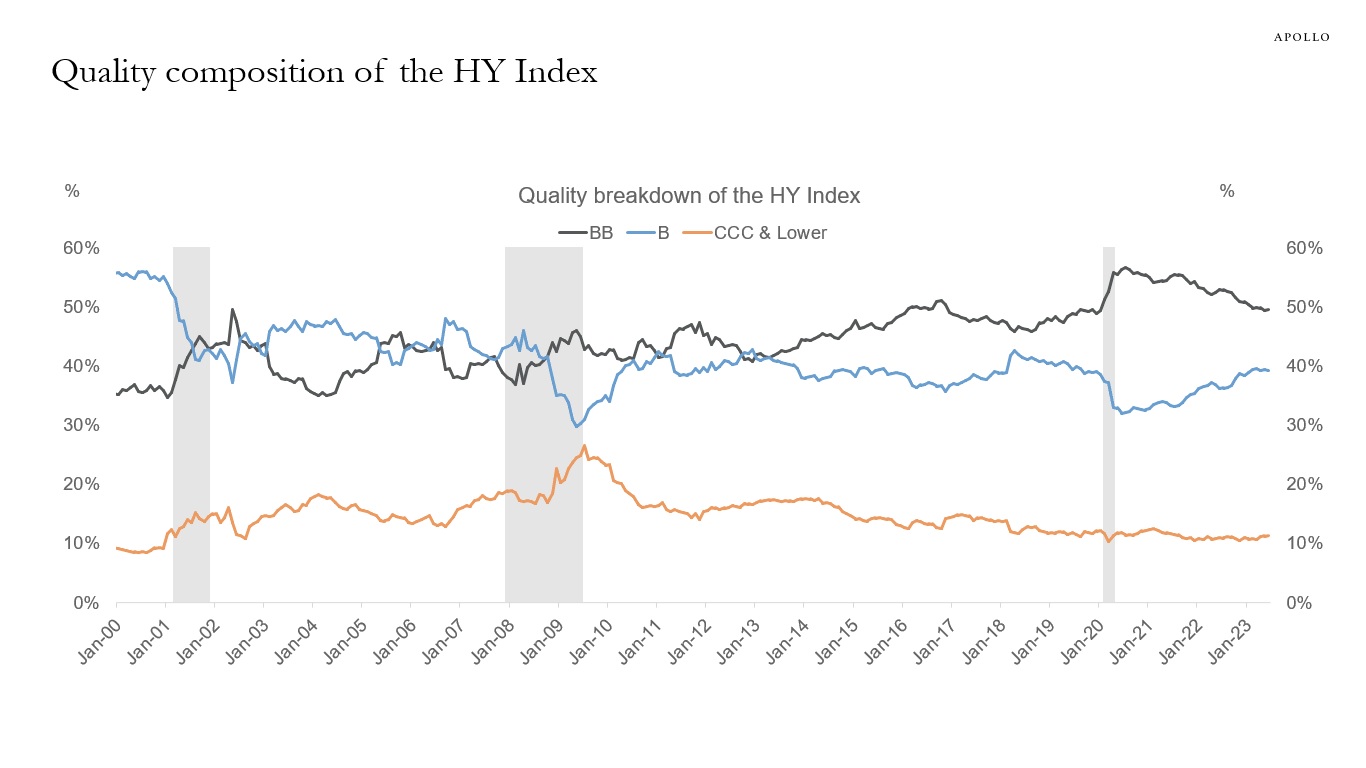
Source: ICE BofA, Bloomberg, Apollo Chief Economist. Note: Breakdown by market value. Data as of June 30, 2023. 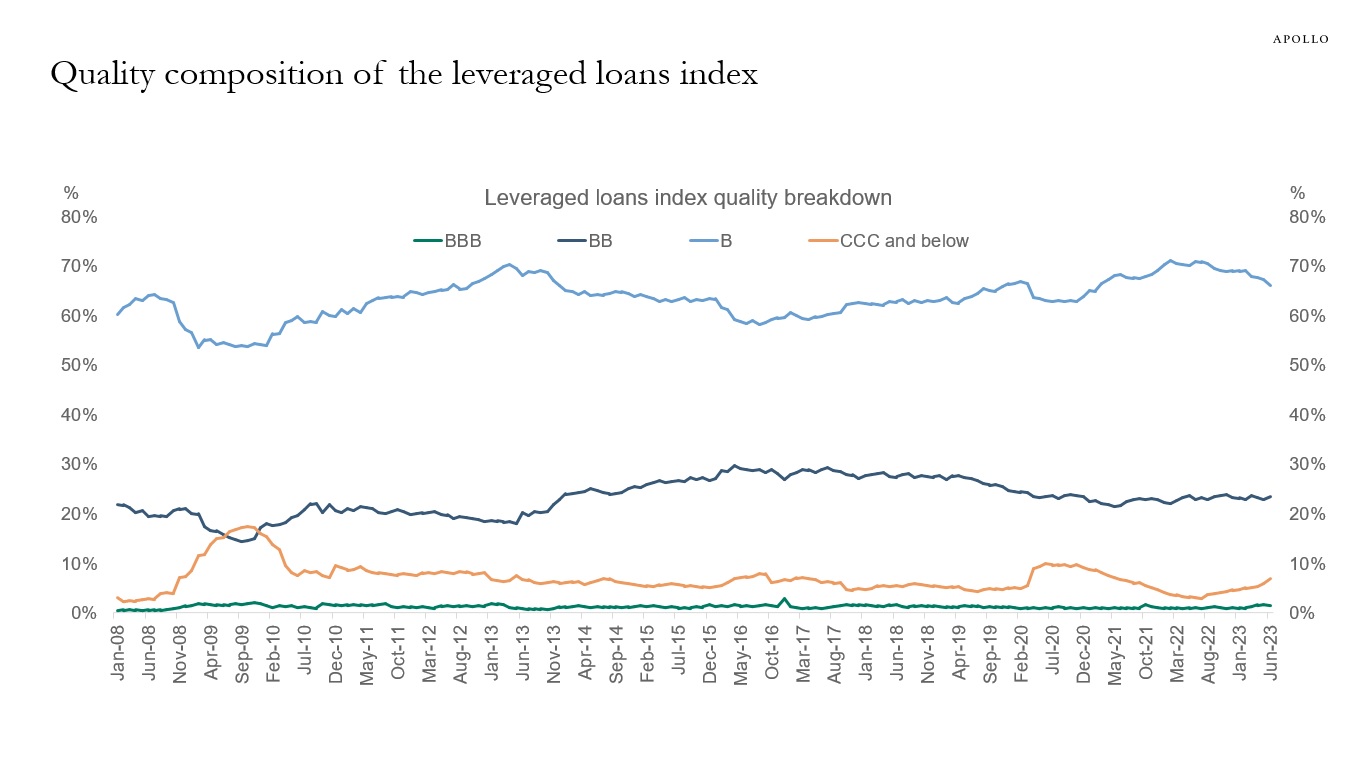
Source: Pitchbook LCD, Apollo Chief Economist 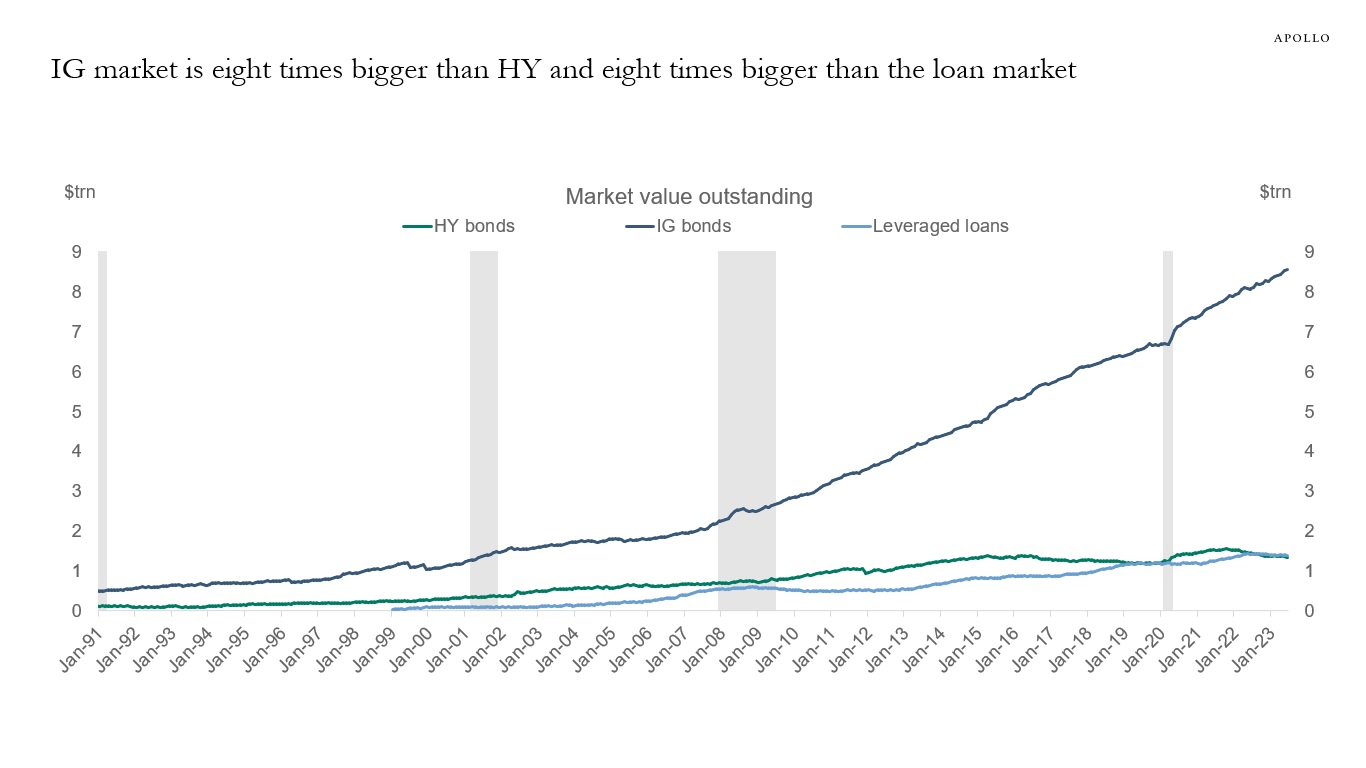
Source: ICE BofA, Bloomberg, Pitchbook LCD, Apollo Chief Economist. Note: Ticker used for HY is H0A0 Index and for IG it is C0A0 Index and for Loans it is SPBDALB Index. 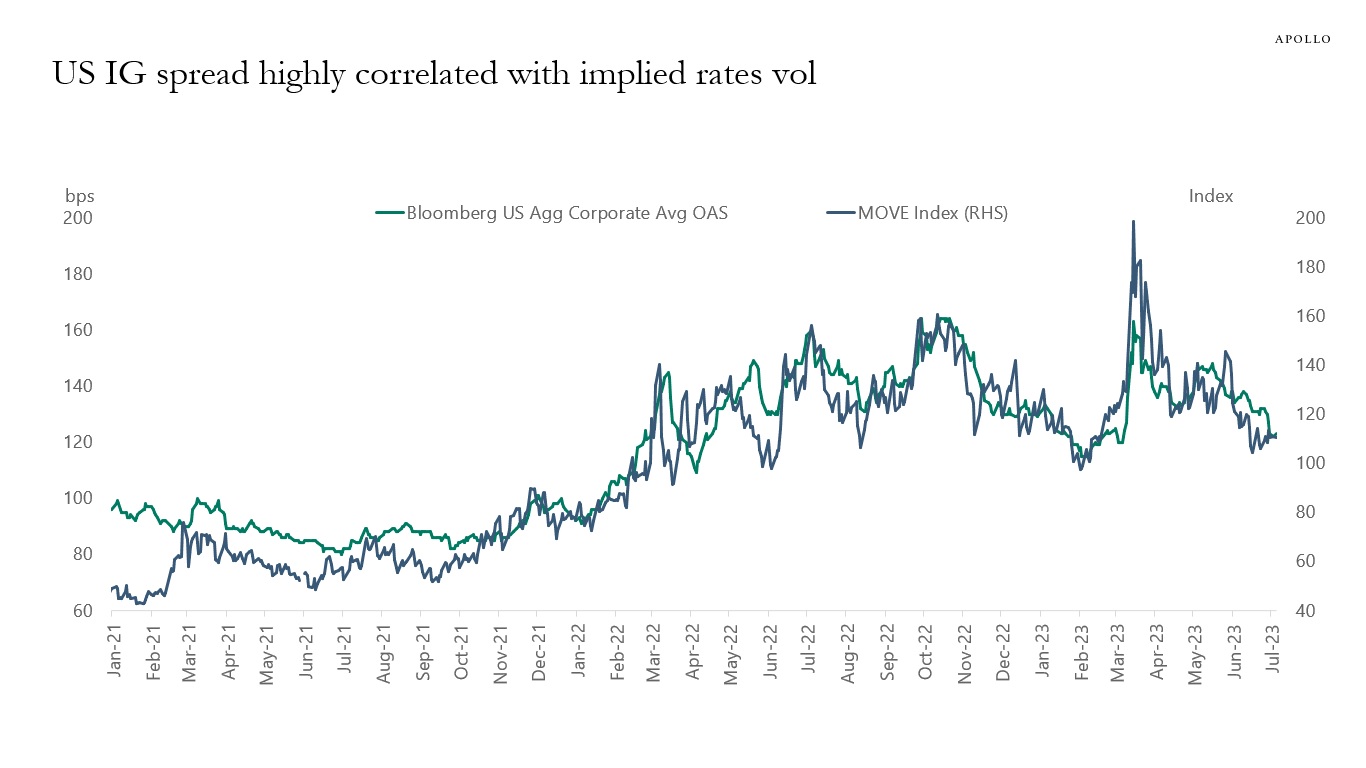
Source: Bloomberg, Apollo Chief Economist 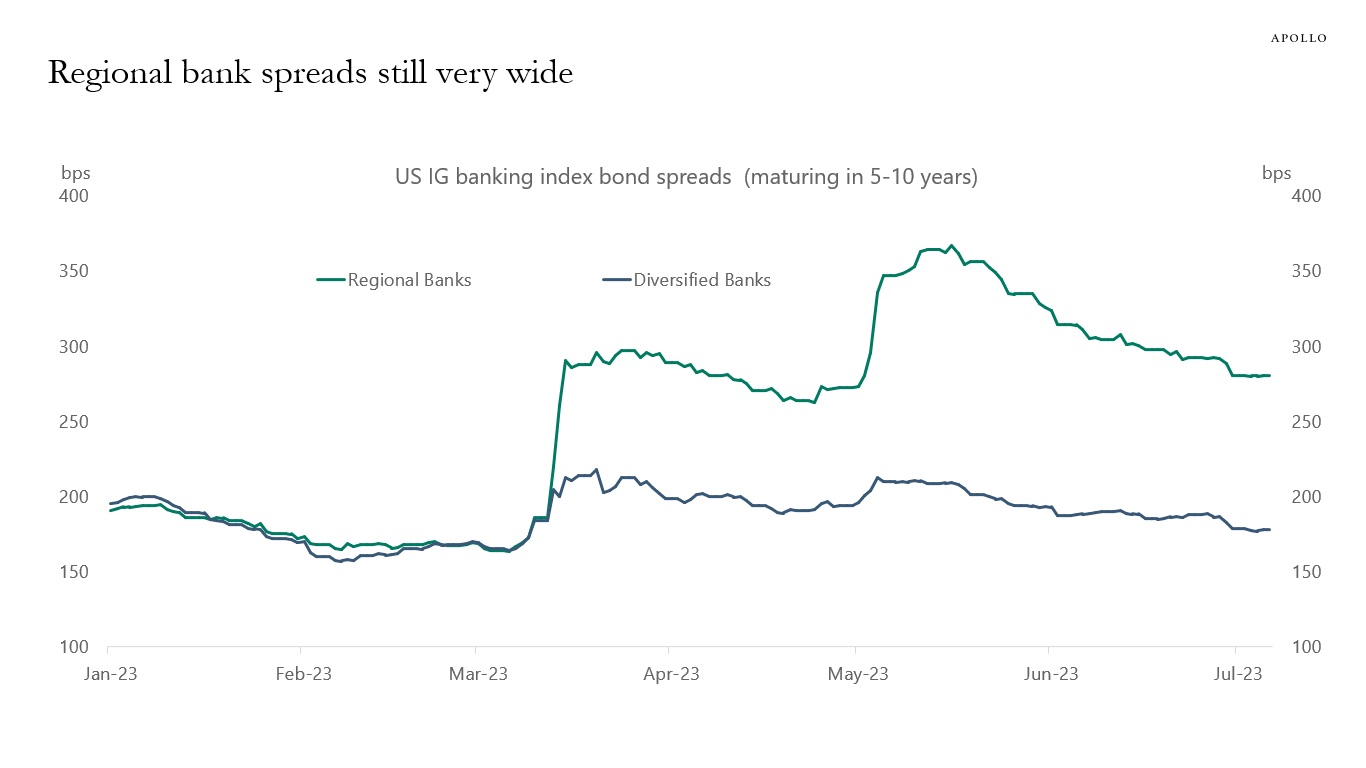
Source: ICE BofA, Bloomberg, Apollo Chief Economist. Note: Unweighted average spreads of bonds from ICE 5-10 Year US Banking Index, C6PX Index for bonds issued before Jan 1, 2023. There are 8 banks in the Regional index and 41 banks in the Diversified index. Regional banks include BankUnited Inc, Citizens Financial Group, Huntington Bancshares Incorporated, Regions Financial Corporation, Truist Financial Corporation, Webster Financial Corp, Wintrust Financial Corp, and Zions. Diversified banks include JP Morgan, Citibank, Bank of America, etc. 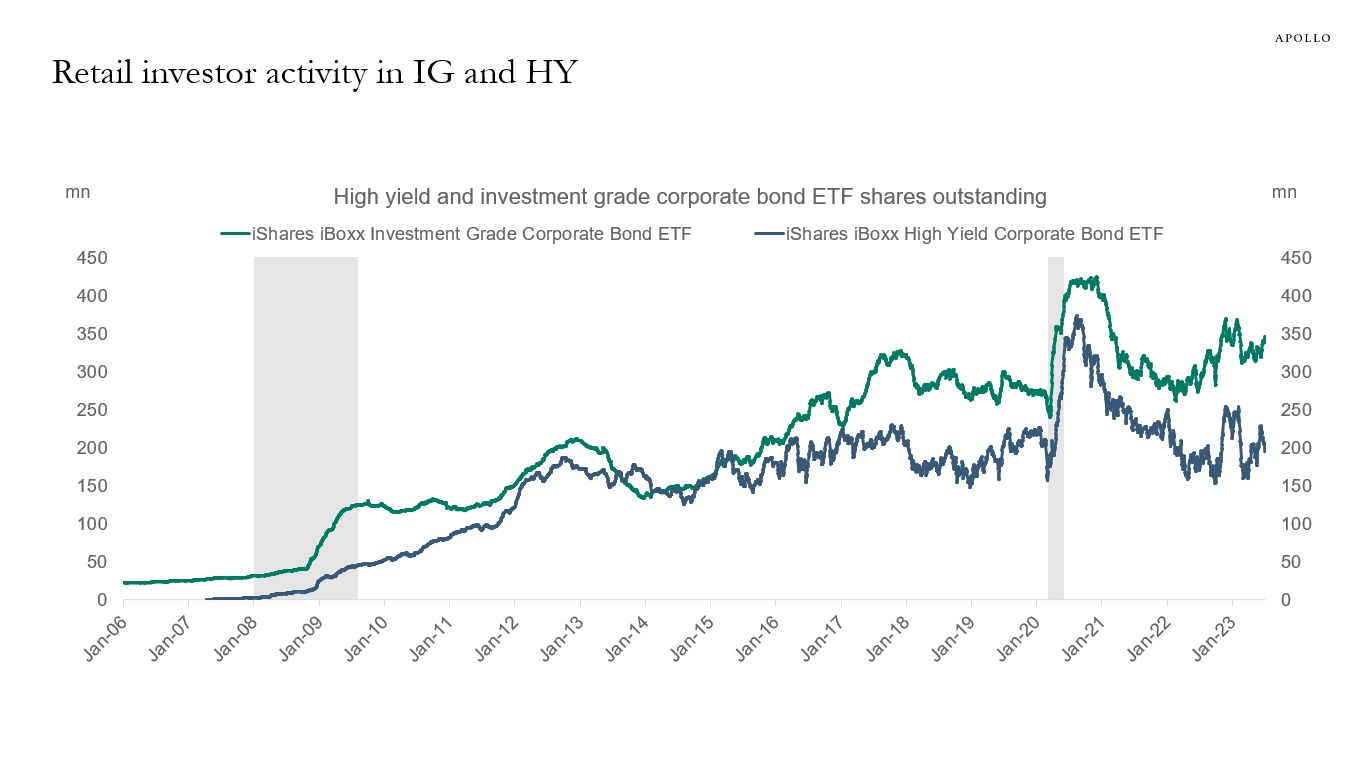
Source: Bloomberg, Apollo Chief Economist. Note: Tickers used HYG US Equity and LQD US Equity. 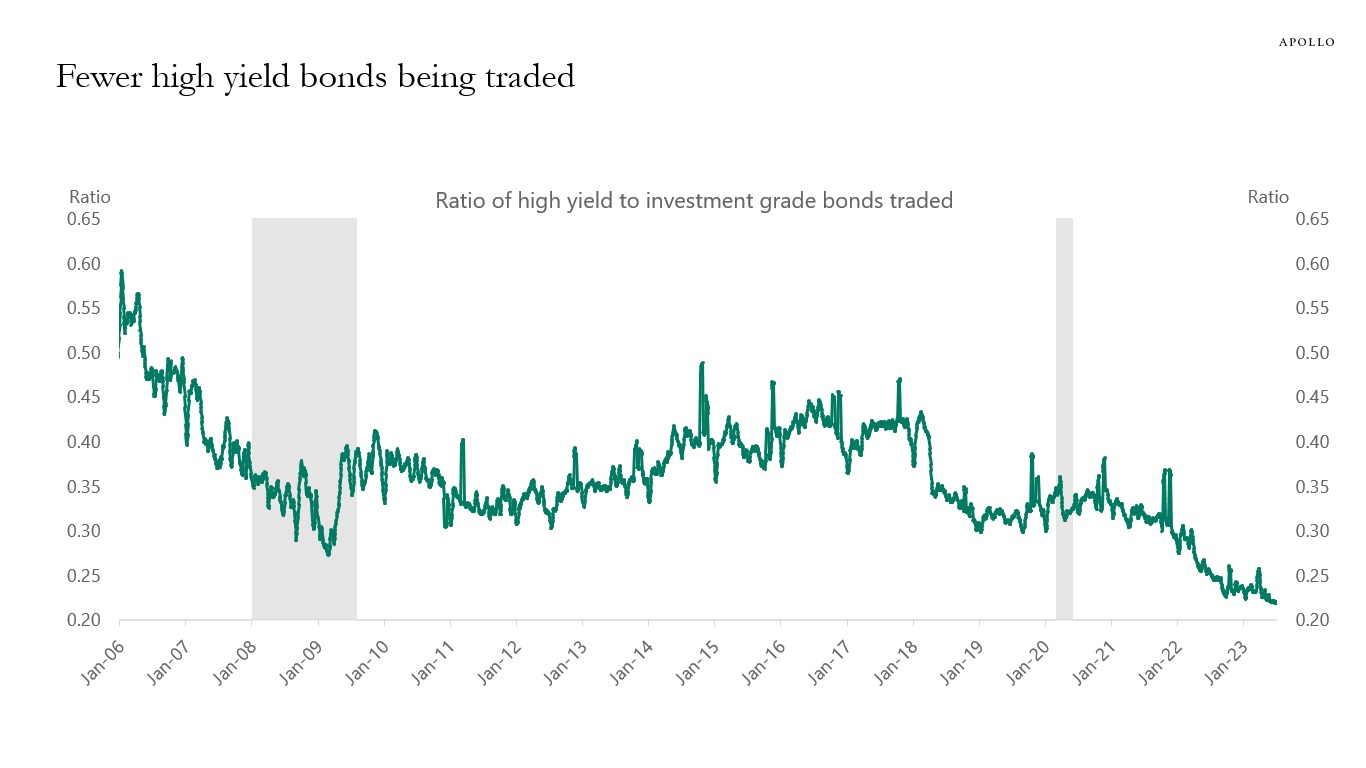
Source: FINRA Trace, Bloomberg, Apollo Chief Economist 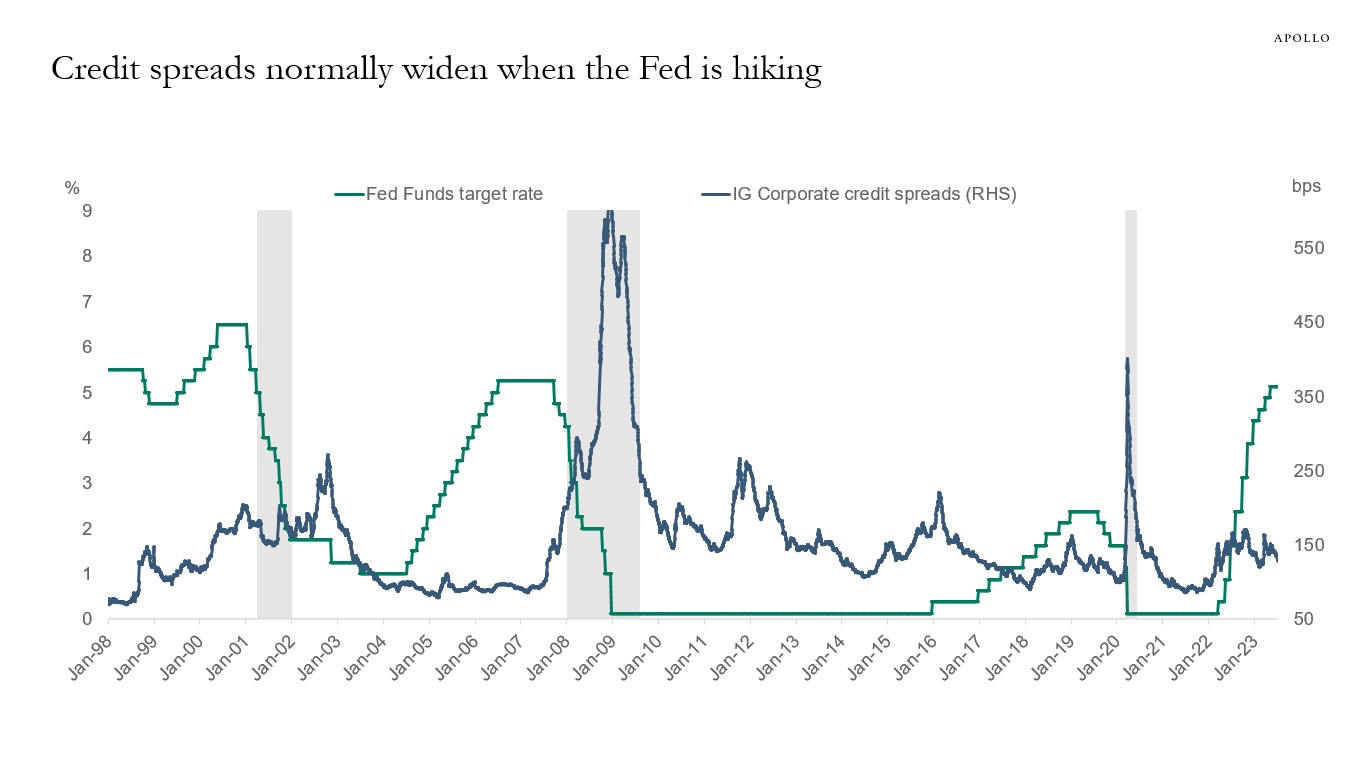
Source: Bloomberg, Apollo Chief Economist 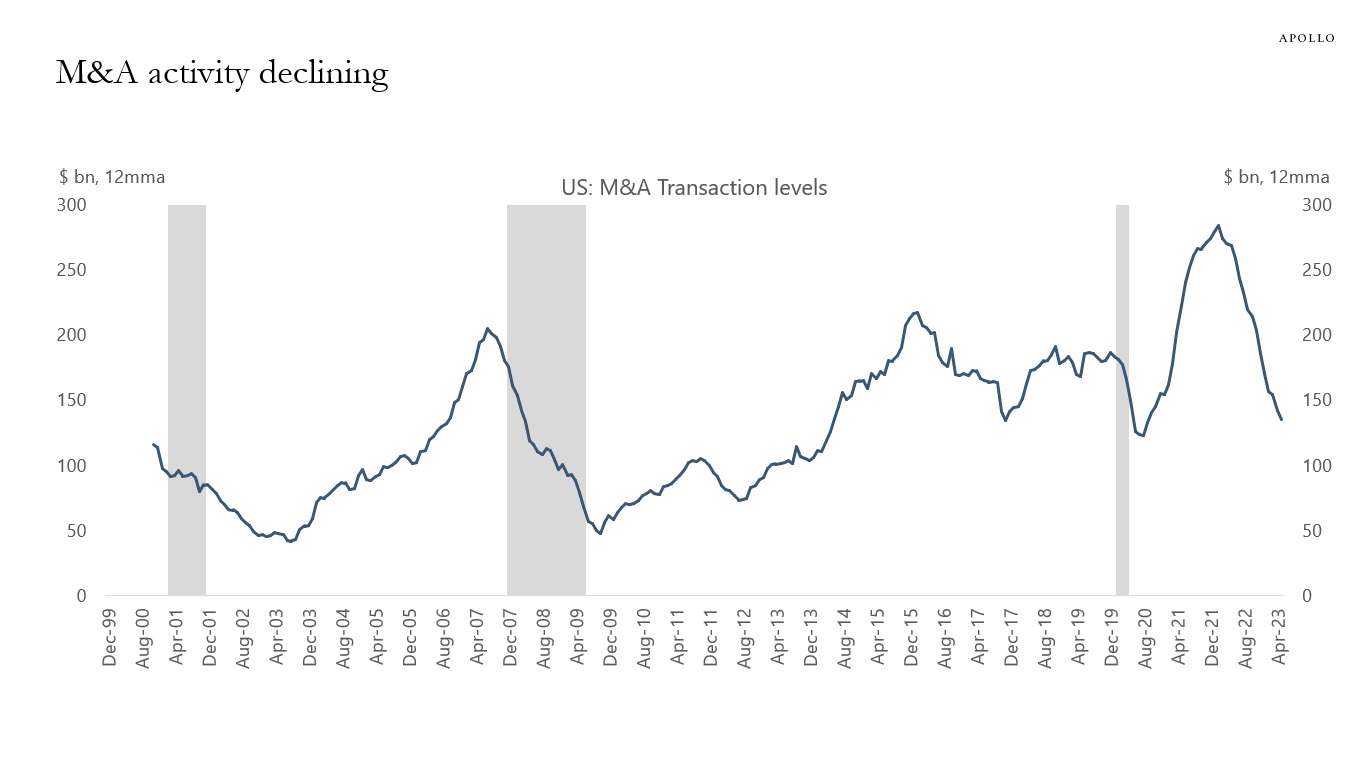
Source: Bloomberg, Apollo Chief Economist See important disclaimers at the bottom of the page.

This presentation may not be distributed, transmitted or otherwise communicated to others in whole or in part without the express consent of Apollo Global Management, Inc. (together with its subsidiaries, “Apollo”).
Apollo makes no representation or warranty, expressed or implied, with respect to the accuracy, reasonableness, or completeness of any of the statements made during this presentation, including, but not limited to, statements obtained from third parties. Opinions, estimates and projections constitute the current judgment of the speaker as of the date indicated. They do not necessarily reflect the views and opinions of Apollo and are subject to change at any time without notice. Apollo does not have any responsibility to update this presentation to account for such changes. There can be no assurance that any trends discussed during this presentation will continue.
Statements made throughout this presentation are not intended to provide, and should not be relied upon for, accounting, legal or tax advice and do not constitute an investment recommendation or investment advice. Investors should make an independent investigation of the information discussed during this presentation, including consulting their tax, legal, accounting or other advisors about such information. Apollo does not act for you and is not responsible for providing you with the protections afforded to its clients. This presentation does not constitute an offer to sell, or the solicitation of an offer to buy, any security, product or service, including interest in any investment product or fund or account managed or advised by Apollo.
Certain statements made throughout this presentation may be “forward-looking” in nature. Due to various risks and uncertainties, actual events or results may differ materially from those reflected or contemplated in such forward-looking information. As such, undue reliance should not be placed on such statements. Forward-looking statements may be identified by the use of terminology including, but not limited to, “may”, “will”, “should”, “expect”, “anticipate”, “target”, “project”, “estimate”, “intend”, “continue” or “believe” or the negatives thereof or other variations thereon or comparable terminology.