


Want it delivered daily to your inbox?
-
The Fed has used the Taylor Rule framework for decades to understand what the Fed funds rate should be, and inserting the current level of inflation and unemployment into the Taylor Rule shows that the Fed funds rate today should be 9%, see chart below and our Daily Spark here.
The ongoing gap between the Fed funds rate predicted by the Taylor Rule and the actual Fed funds rate raises the question whether the Fed remains behind the curve. In other words, if the economy reaccelerates over the coming quarters with higher consumer spending and a boom in housing, it will increase the risk that the Taylor Rule was right and that the Fed will have to continue hiking.
In sum, for markets to continue to trade higher, the soft landing must be a soft landing, not a reacceleration, because if housing and consumer spending accelerate from here, the Fed will have to raise rates a lot more.
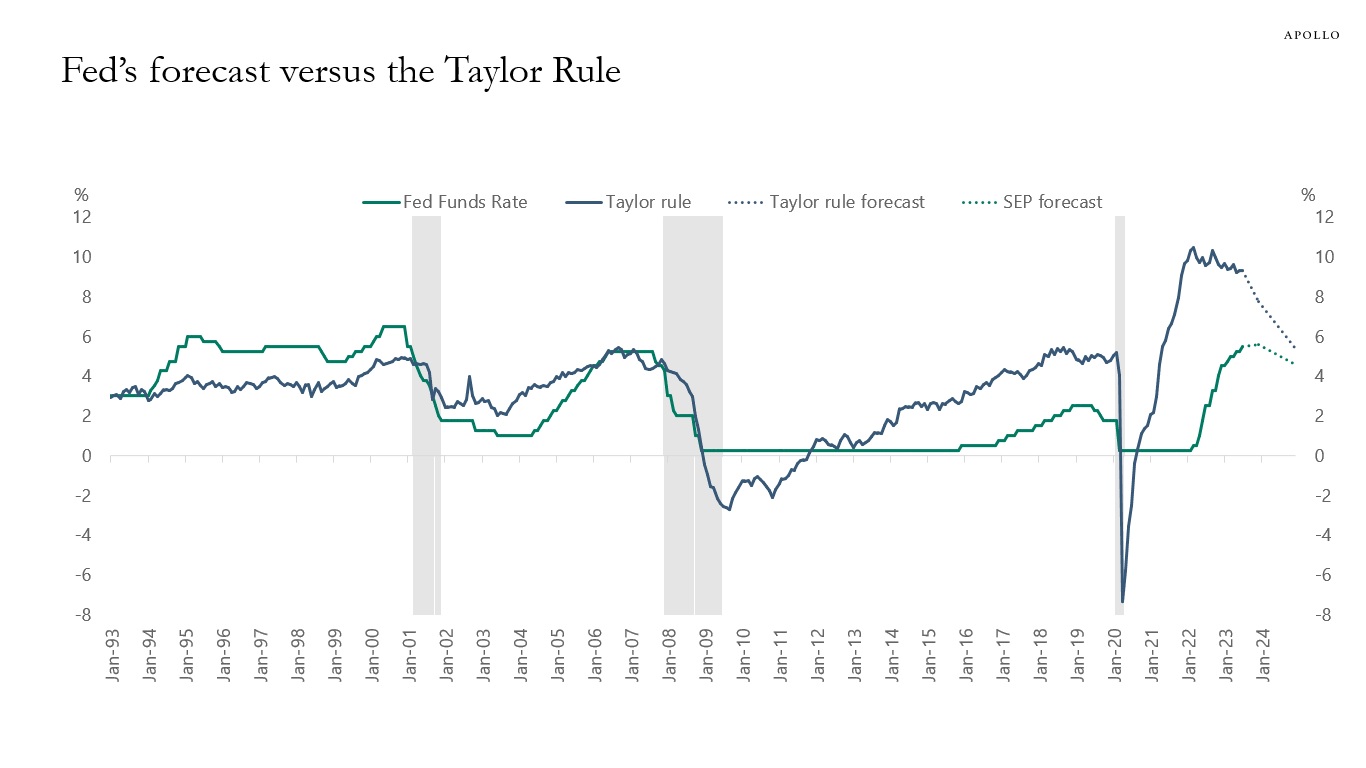
Source: Bloomberg, Fed SEP, Apollo Chief Economist. Note: Taylor Rule calculated using TAYL <GO> function on Bloomberg. See important disclaimers at the bottom of the page.
-
Fed hikes continue to slow down hiring for both small firms and for the broader economy, see charts below. The labor market is softening with hours worked, the number of job openings, and the quits rate all declining.
This is how monetary policy works; higher costs of capital slow down capex spending and hiring, and with rates staying at these levels for a couple of years, this process is going to continue.
That is why the consensus expects negative nonfarm payrolls for six months from October 2023 to March 2024.
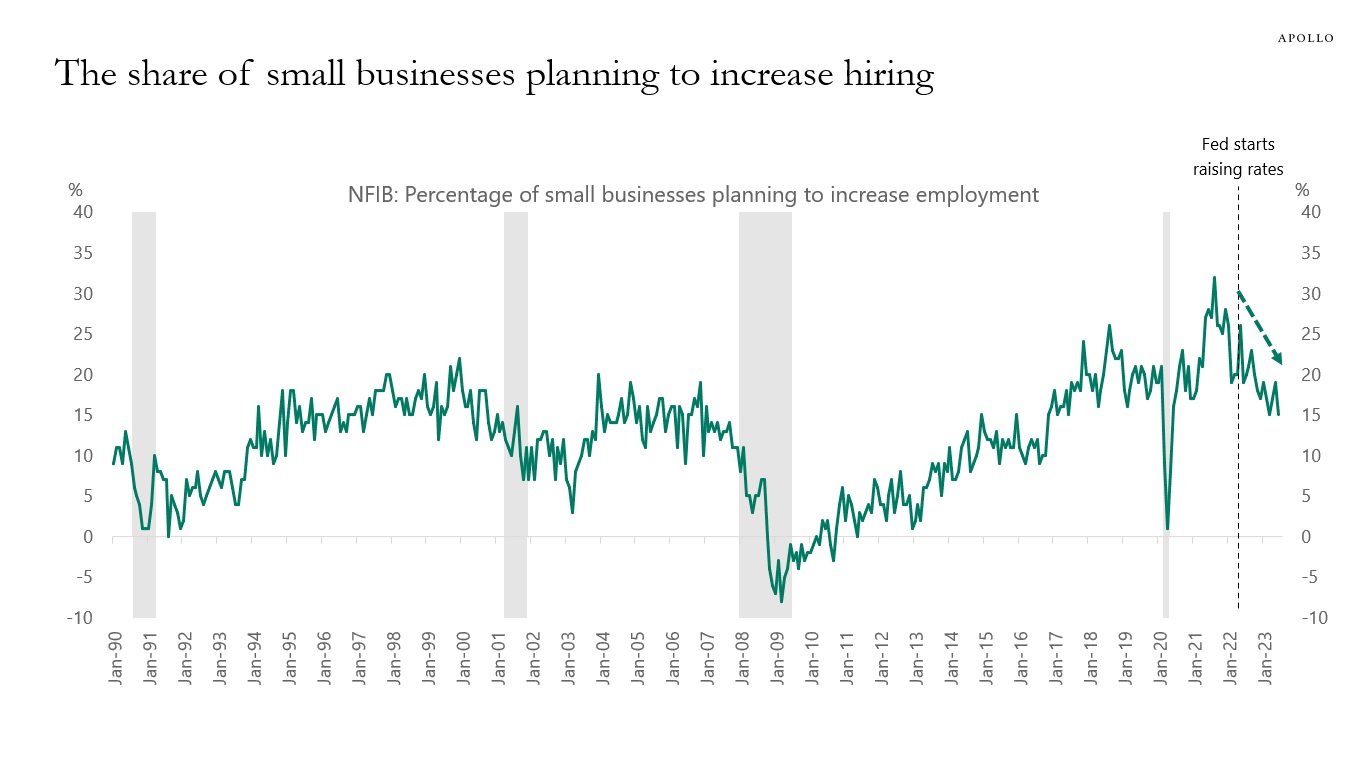
Source: NFIB, Haver Analytics, Apollo Chief Economist 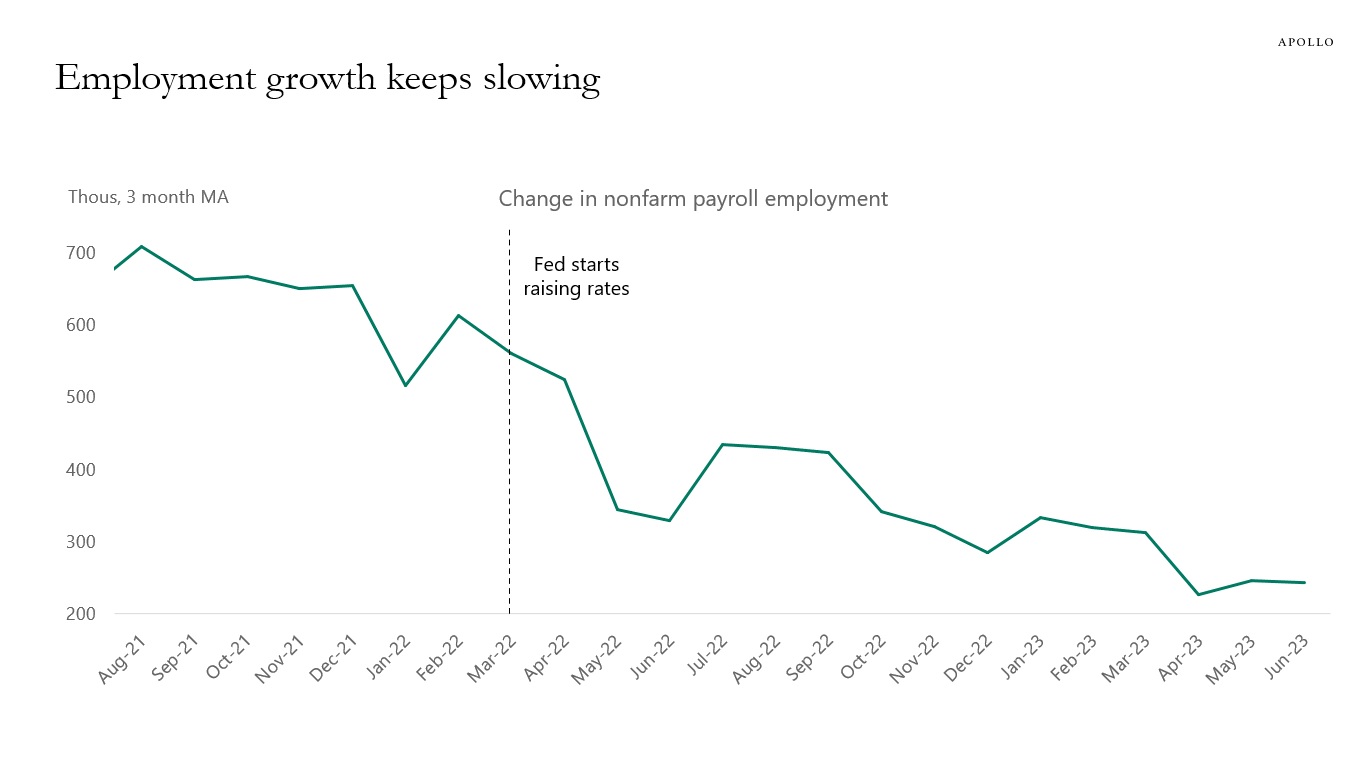
Source: BLS, Haver Analytics, Apollo Chief Economist See important disclaimers at the bottom of the page.
-
Since the Fed started raising interest rates, we have seen an increase in downgrades of loans and a rise in the share of loans trading at distressed levels, i.e. below 80, see charts below. This is the monetary policy transmission mechanism at work; higher costs of capital are having a negative impact on the economy.
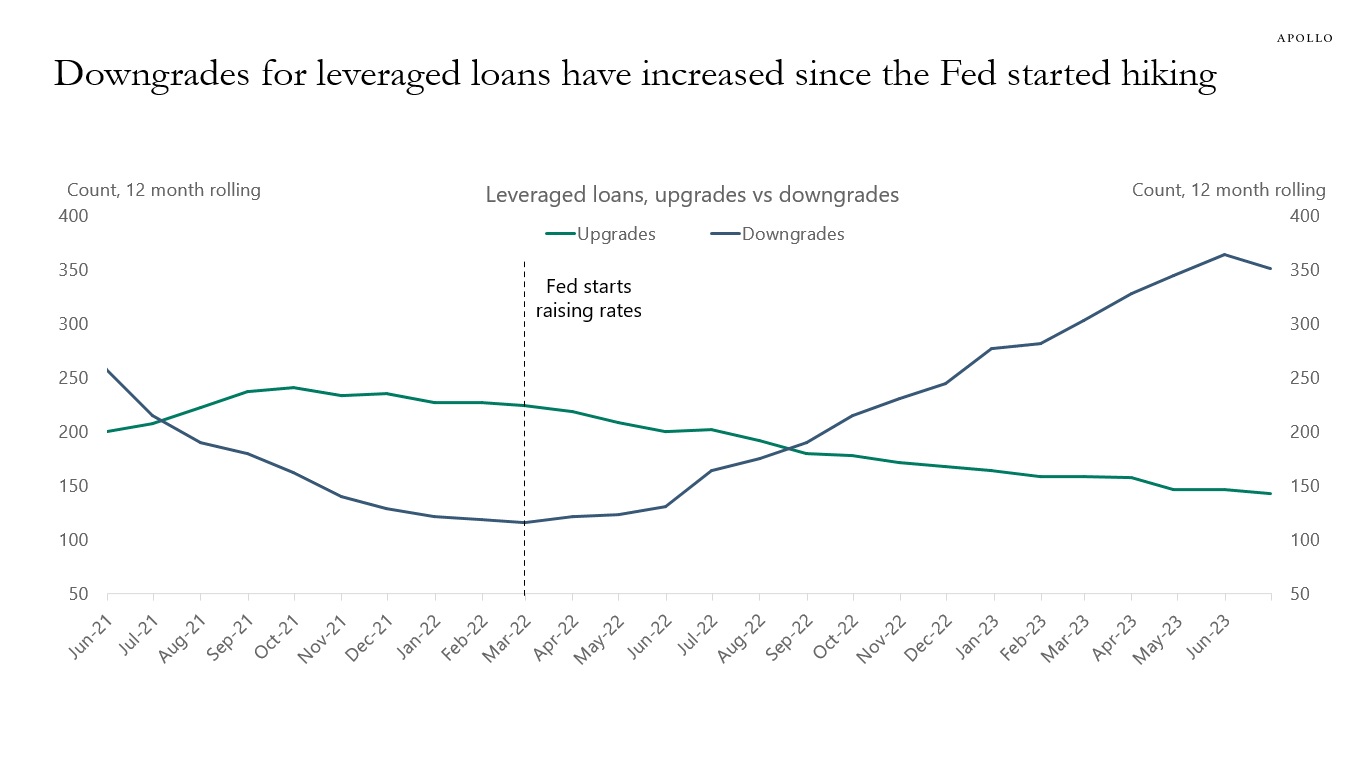
Source: Pitchbook LCD 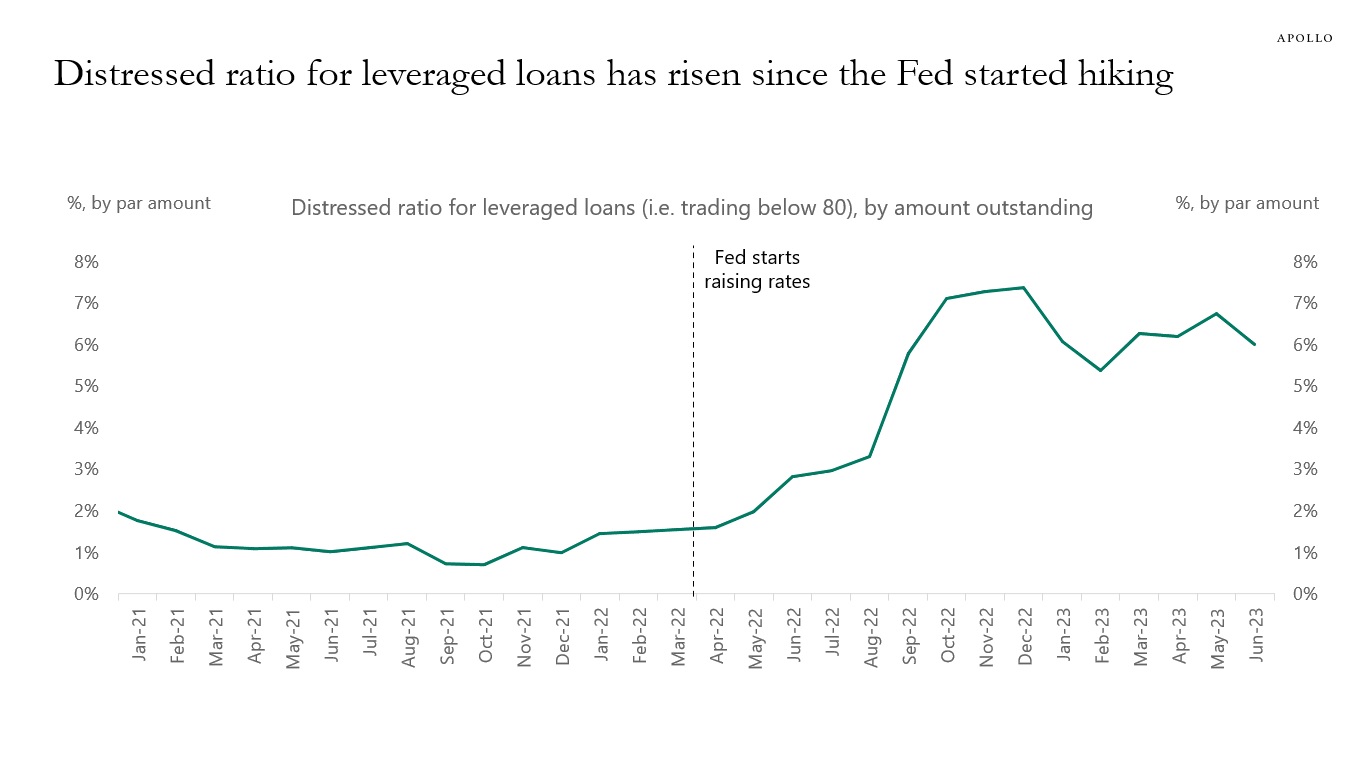
Source: Pitchbook LCD, Apollo Chief Economist. Note: For percent loans priced below 80. See important disclaimers at the bottom of the page.
-
Markets are not taking the ongoing rise in default rates for HY and loans seriously, see charts below, and many investors argue that “this is just a normalization,” or “these are companies nobody has heard about.”
The reality is that more and more companies are defaulting because the cost of capital is higher, and Fed Chair Powell says that interest rates will stay at these levels “for a couple of years,” so tight monetary policy will continue to have a greater negative effect on the economy and capital markets.
In fact, higher costs of capital is precisely how monetary policy works: By making it more difficult to get financing.
In other words, Fed hikes are biting harder and harder, and all investors should have a view on how high they think default rates will go during this cycle, see again charts below.
What could be the aha moment in markets? Once there is a default by some household name in credit, we will likely see an overnight change in market sentiment from bullish to bearish.
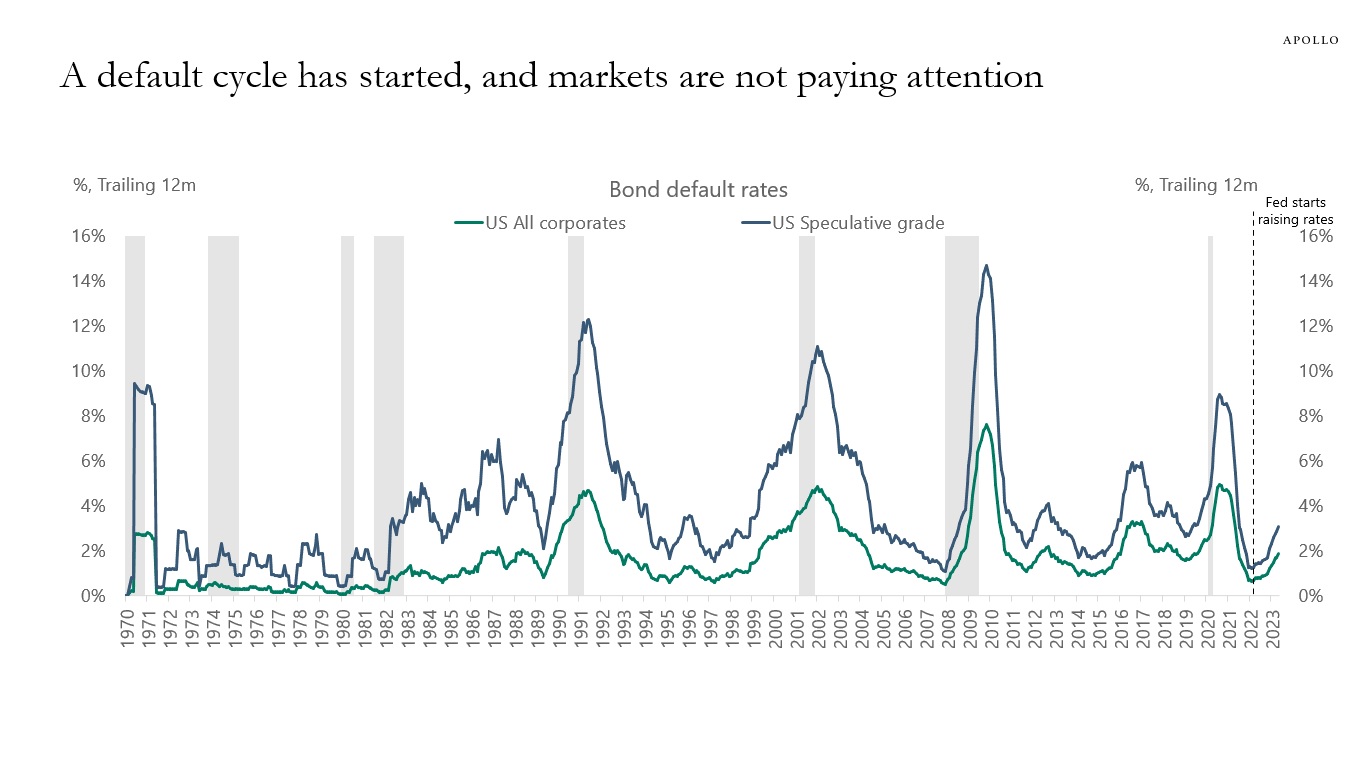
Source: Moody’s Analytics, Apollo Chief Economist 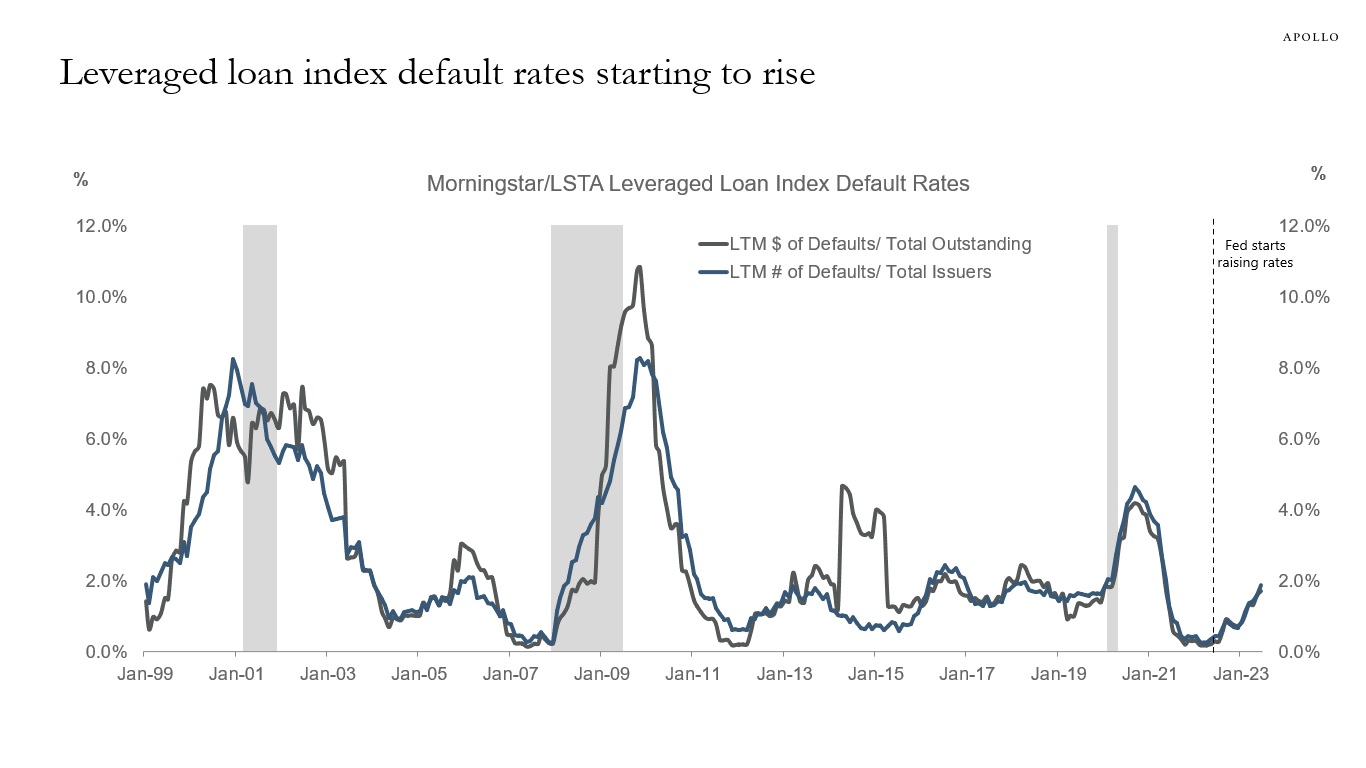
Source: Pitchbook LCD, Apollo Chief Economist See important disclaimers at the bottom of the page.
-
China accounts for more than 50% of global coal consumption, see chart below.
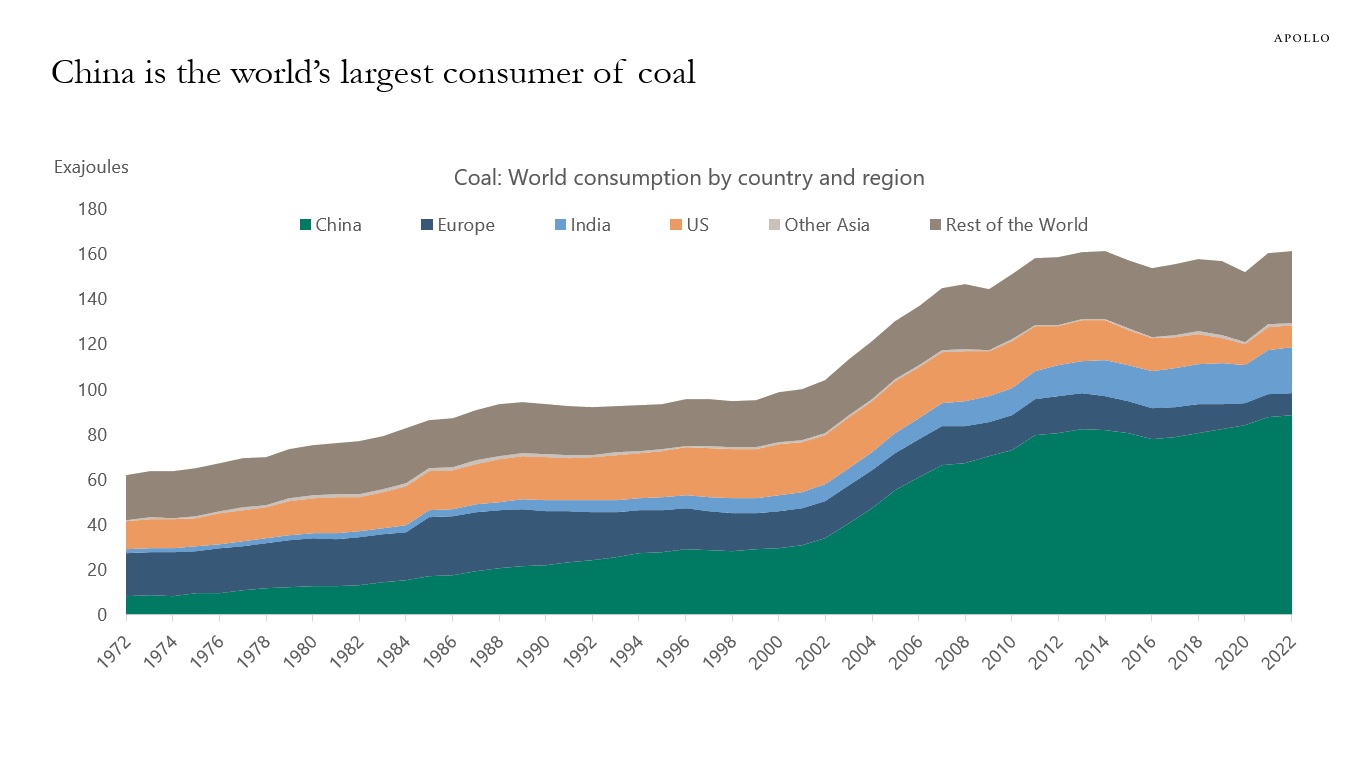
Source: BP, Bloomberg, Apollo Chief Economist See important disclaimers at the bottom of the page.
-
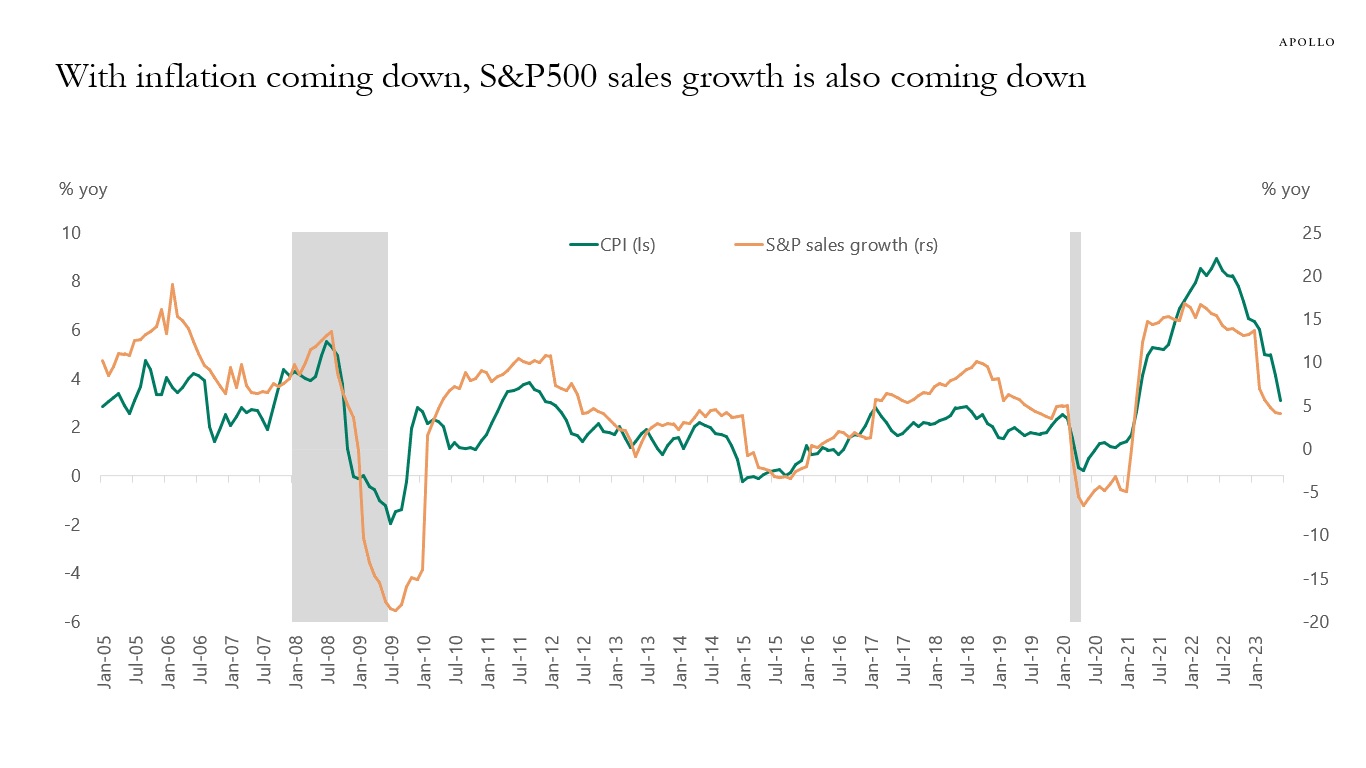
What matters for bond markets and the Fed are real variables, including unemployment, real GDP growth, and real consumer spending.
What matters for the stock market is nominal variables, including earnings growth, sales growth, and output prices.
The chart below shows that with inflation coming down, we should also expect to see a slowdown in nominal sales growth and nominal earnings growth.
Source: BLS, Haver, Bloomberg, Apollo Chief Economist See important disclaimers at the bottom of the page.
-
There are two competing narratives in markets at the moment.
One narrative is that the global economy is simply normalizing after Covid. As that process continues, inflation will come down, and we will have a soft landing as labor markets, product markets, and supply chains continue to normalize.
The other story is that the Fed is stepping hard on the brakes, and the lagged effects of Fed hikes and rates staying higher for longer will weigh on nonfarm payrolls, capex spending, and consumer spending over the coming 12 to 18 months, which will cause a recession.
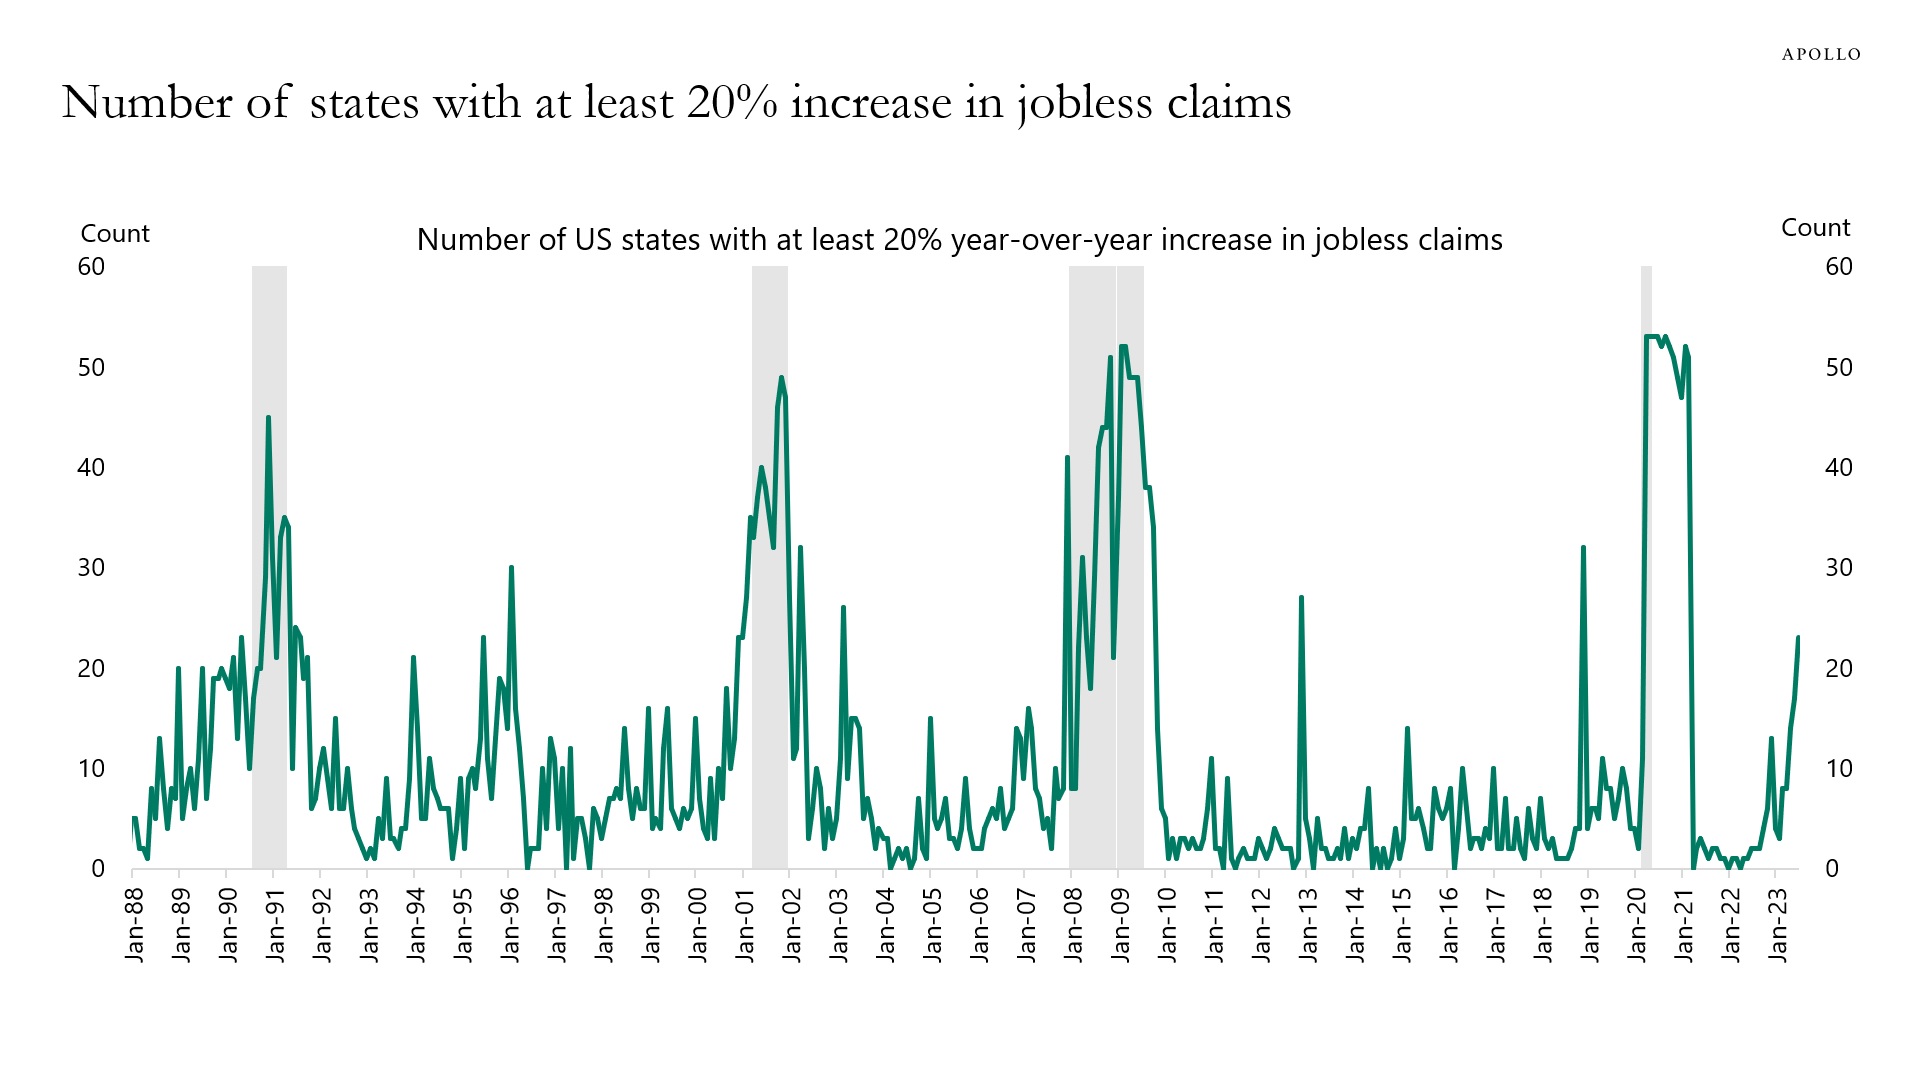
Looking at a broad range of leading indicators, including rising delinquency rates for credit cards and auto loans, rising default rates for HY and loans, rising weekly bankruptcies, slowing weekly loan growth for banks, and leading indicators for jobless claims (see charts below), we continue to see the recession narrative as the most likely outcome.
Rising rates have already had a negative impact on more leveraged consumers, firms, and commercial real estate. And with the Fed on hold for “a couple of years,” the negative effects of higher rates will continue. In that sense, if the economic data soon starts to re-accelerate, then housing inflation will start to move up again, and the Fed will raise rates even more to slow down the economy.
Let’s not forget that a hard landing will always start out by looking like a soft landing.
Our chart book with daily and weekly indicators for the US economy is available here.
Source: BLS, Bloomberg, Apollo Chief Economist 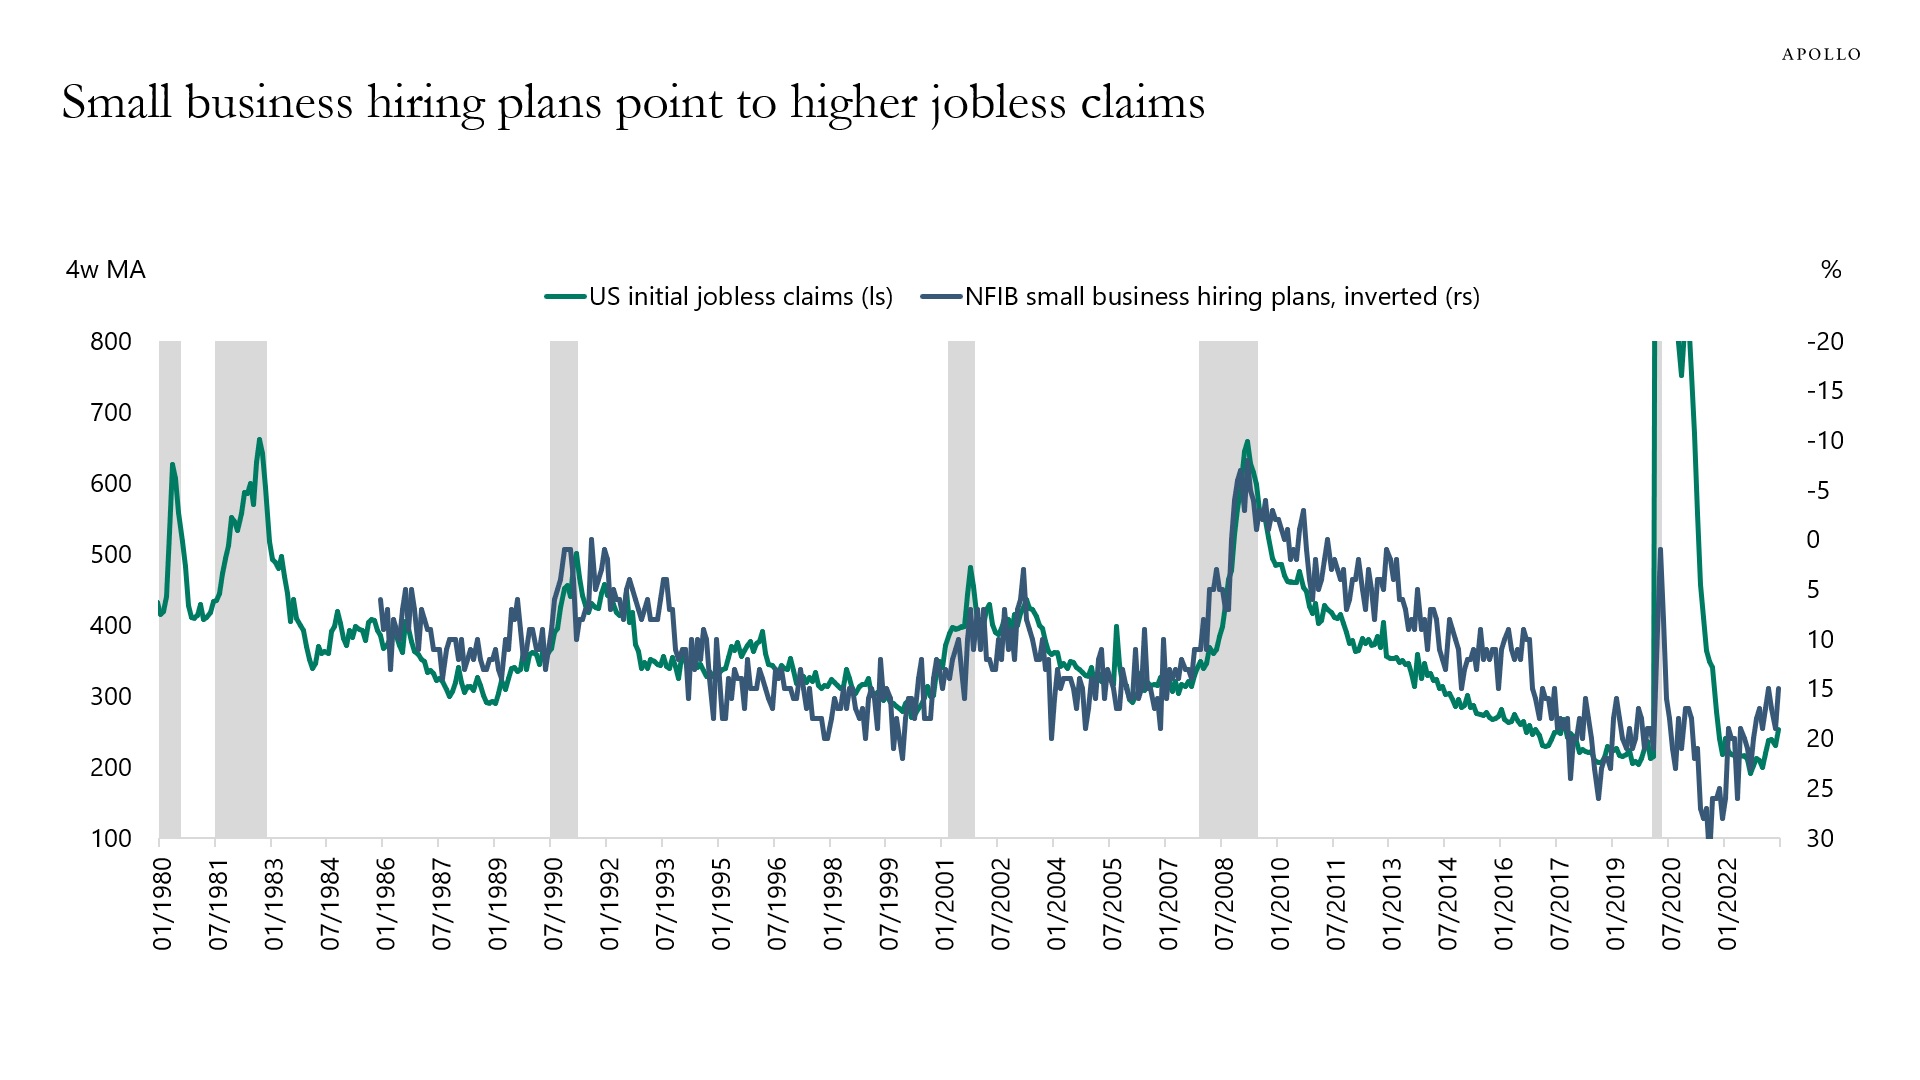
Source: Department of Labor, NFIB, Bloomberg, Apollo Chief Economist 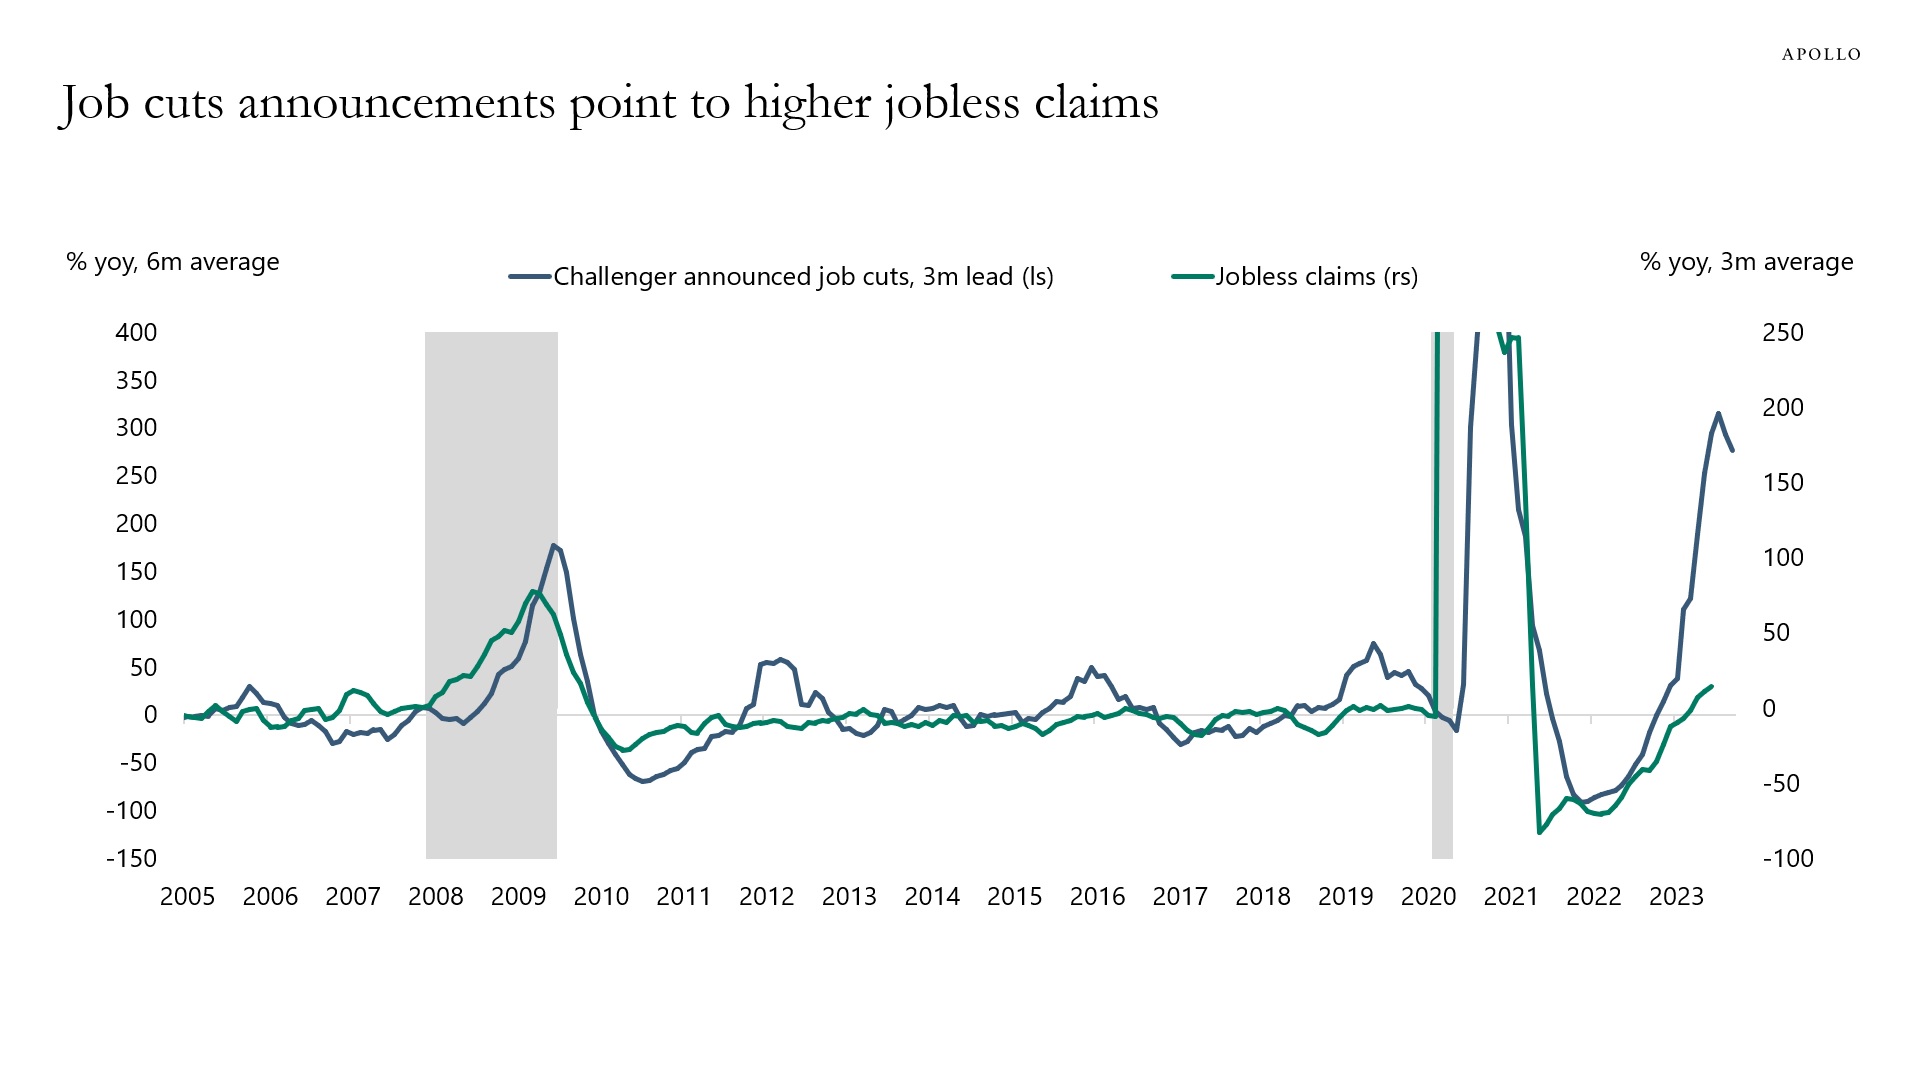
Source: Challenger, Gray & Christmas Inc., Bloomberg, Apollo Chief Economist 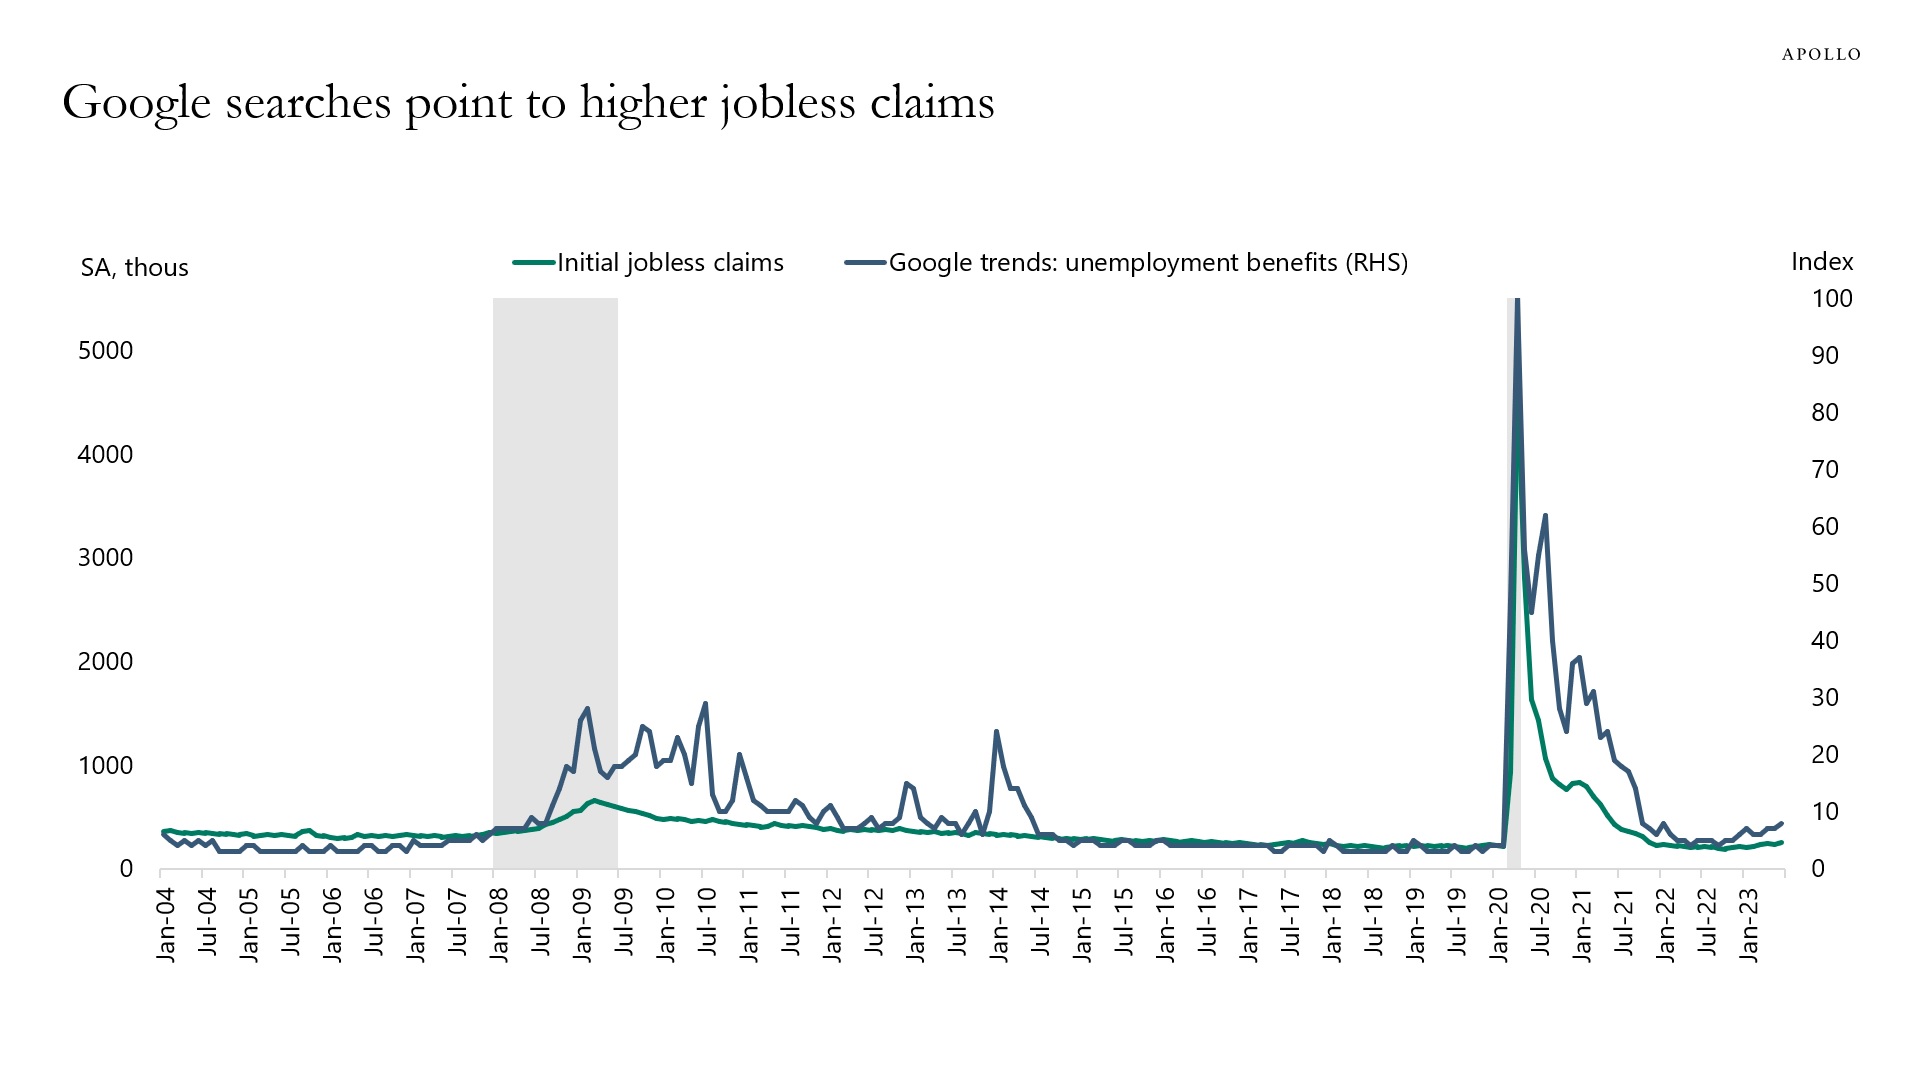
Source: Department of Labor, Haver Analytics, Apollo Chief Economist. Note: Numbers represent search interest relative to the highest point on the chart for the given region and time. A value of 100 is the peak popularity for the term. A value of 50 means that the term is half as popular. A score of 0 means that there was not enough data for this term. 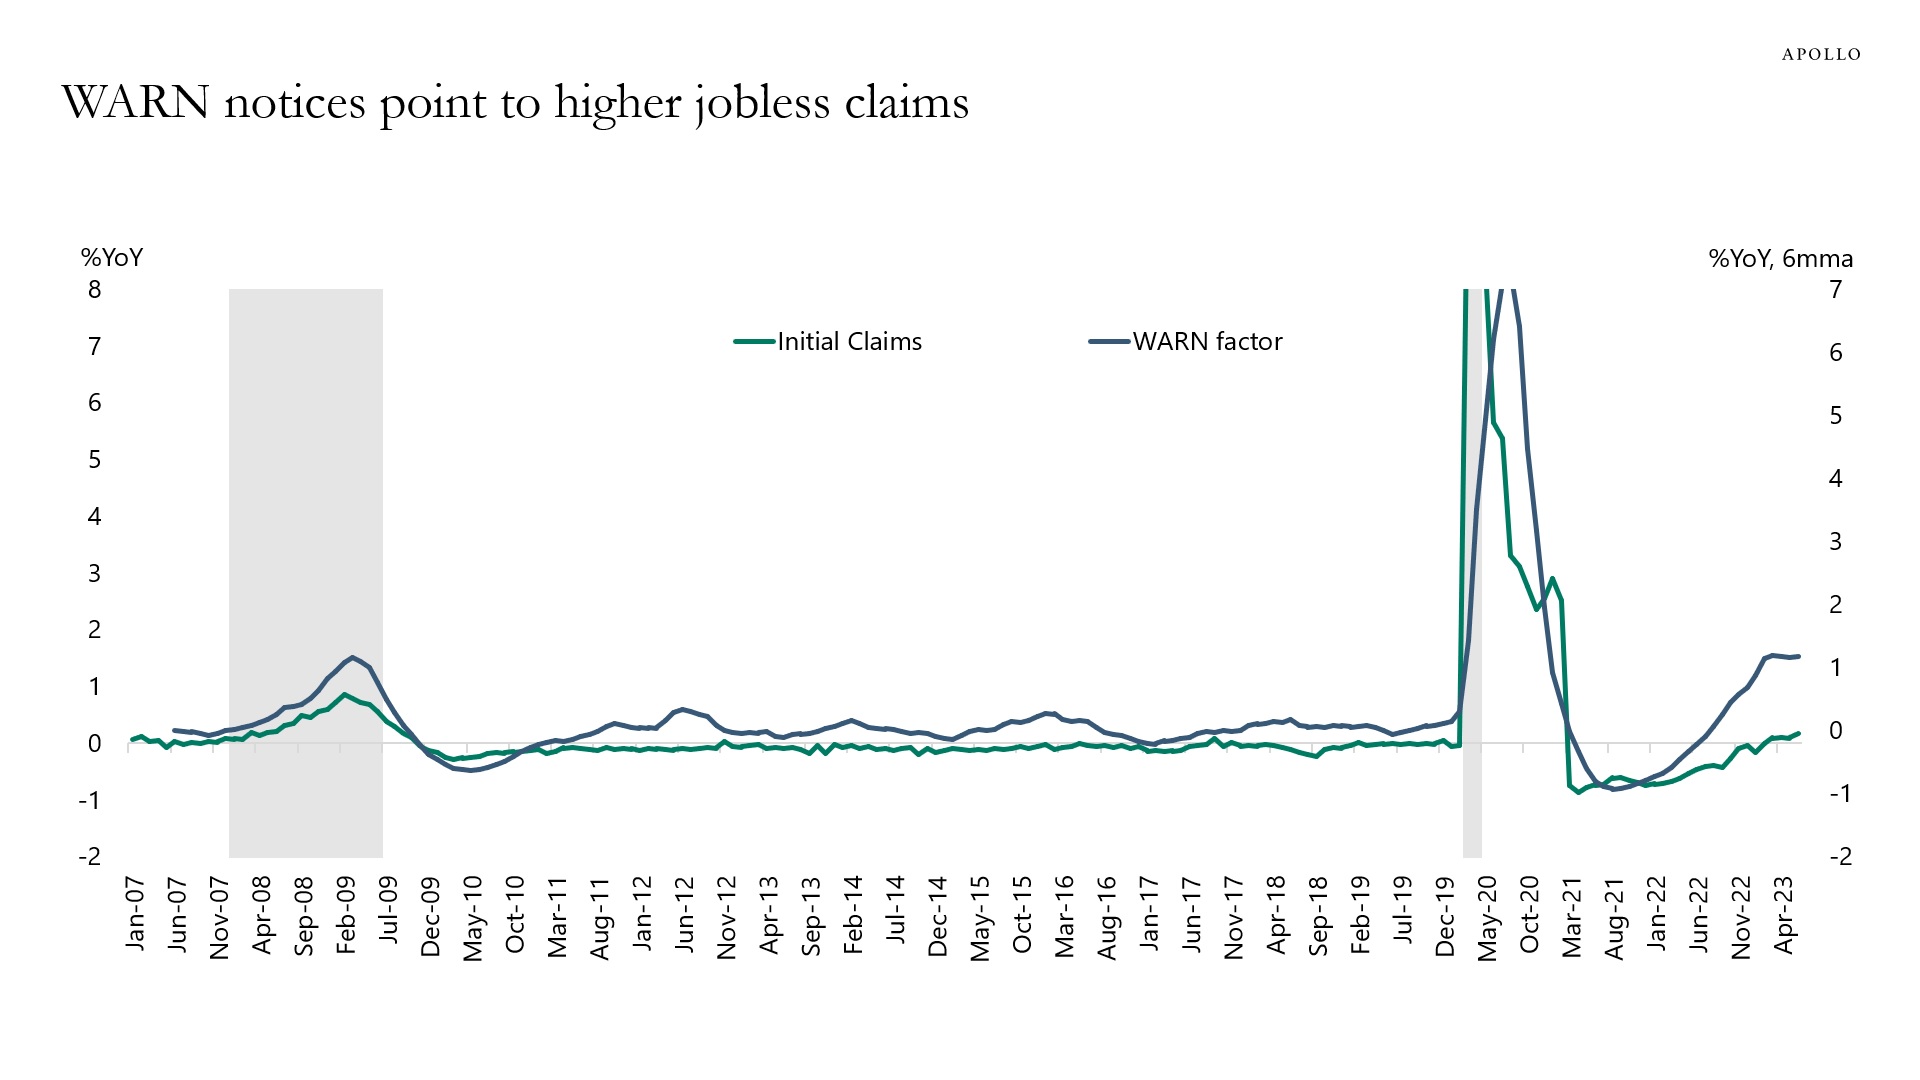
Source: Department of Labor, Haver Analytics, Federal Reserve Bank of Cleveland, Apollo Chief Economist. Note: The Worker Adjustment and Retraining Notification (WARN) Act helps ensure 60 to 90 days advance notice in cases of qualified plant closings and mass layoffs. WARN factor is the Cleveland Fed estimate for WARN notices (see Fed working paper). See important disclaimers at the bottom of the page.
-
The chart below summarizes the reasons to be bullish on the US consumer and the reasons to be bearish.
In this presentation, we look at the outlook for consumer spending on housing, cars, restaurants, travel, and other consumer goods and services.
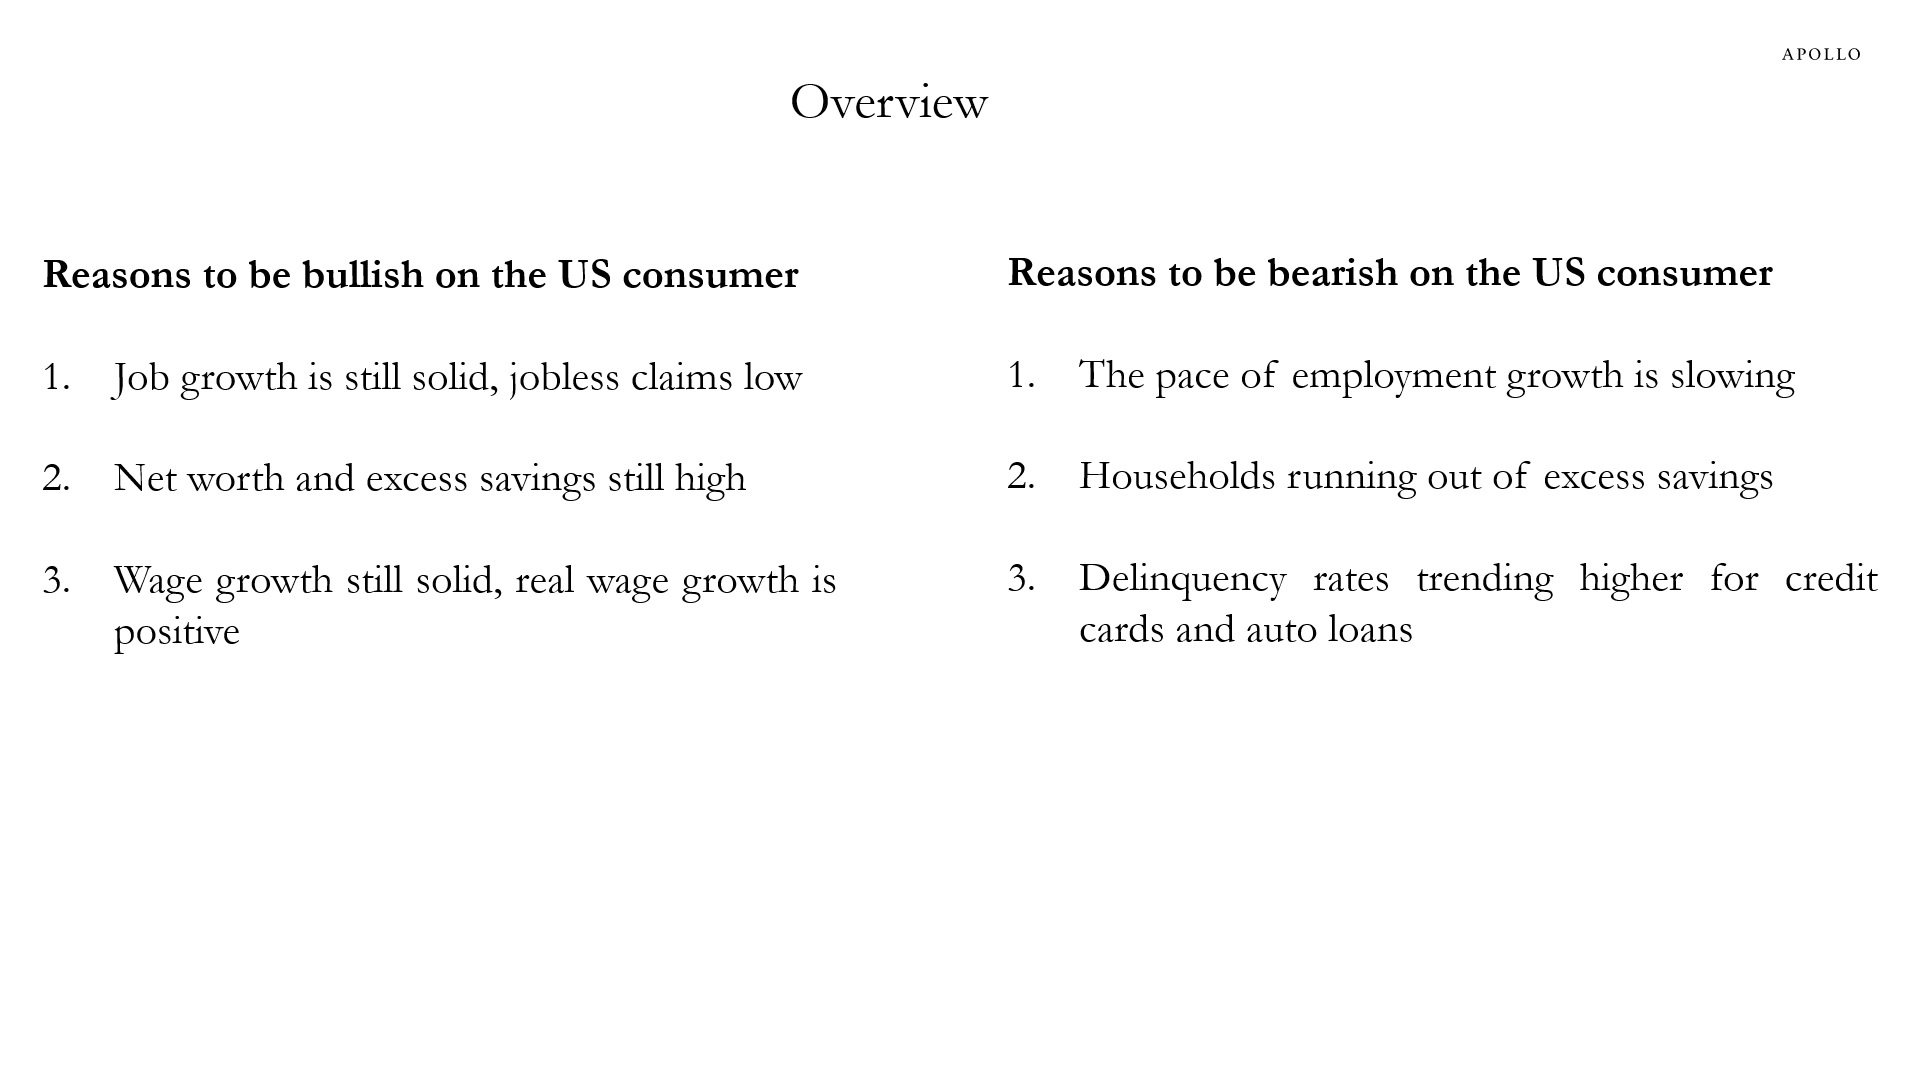
Source: Apollo Chief Economist 
See important disclaimers at the bottom of the page.
-
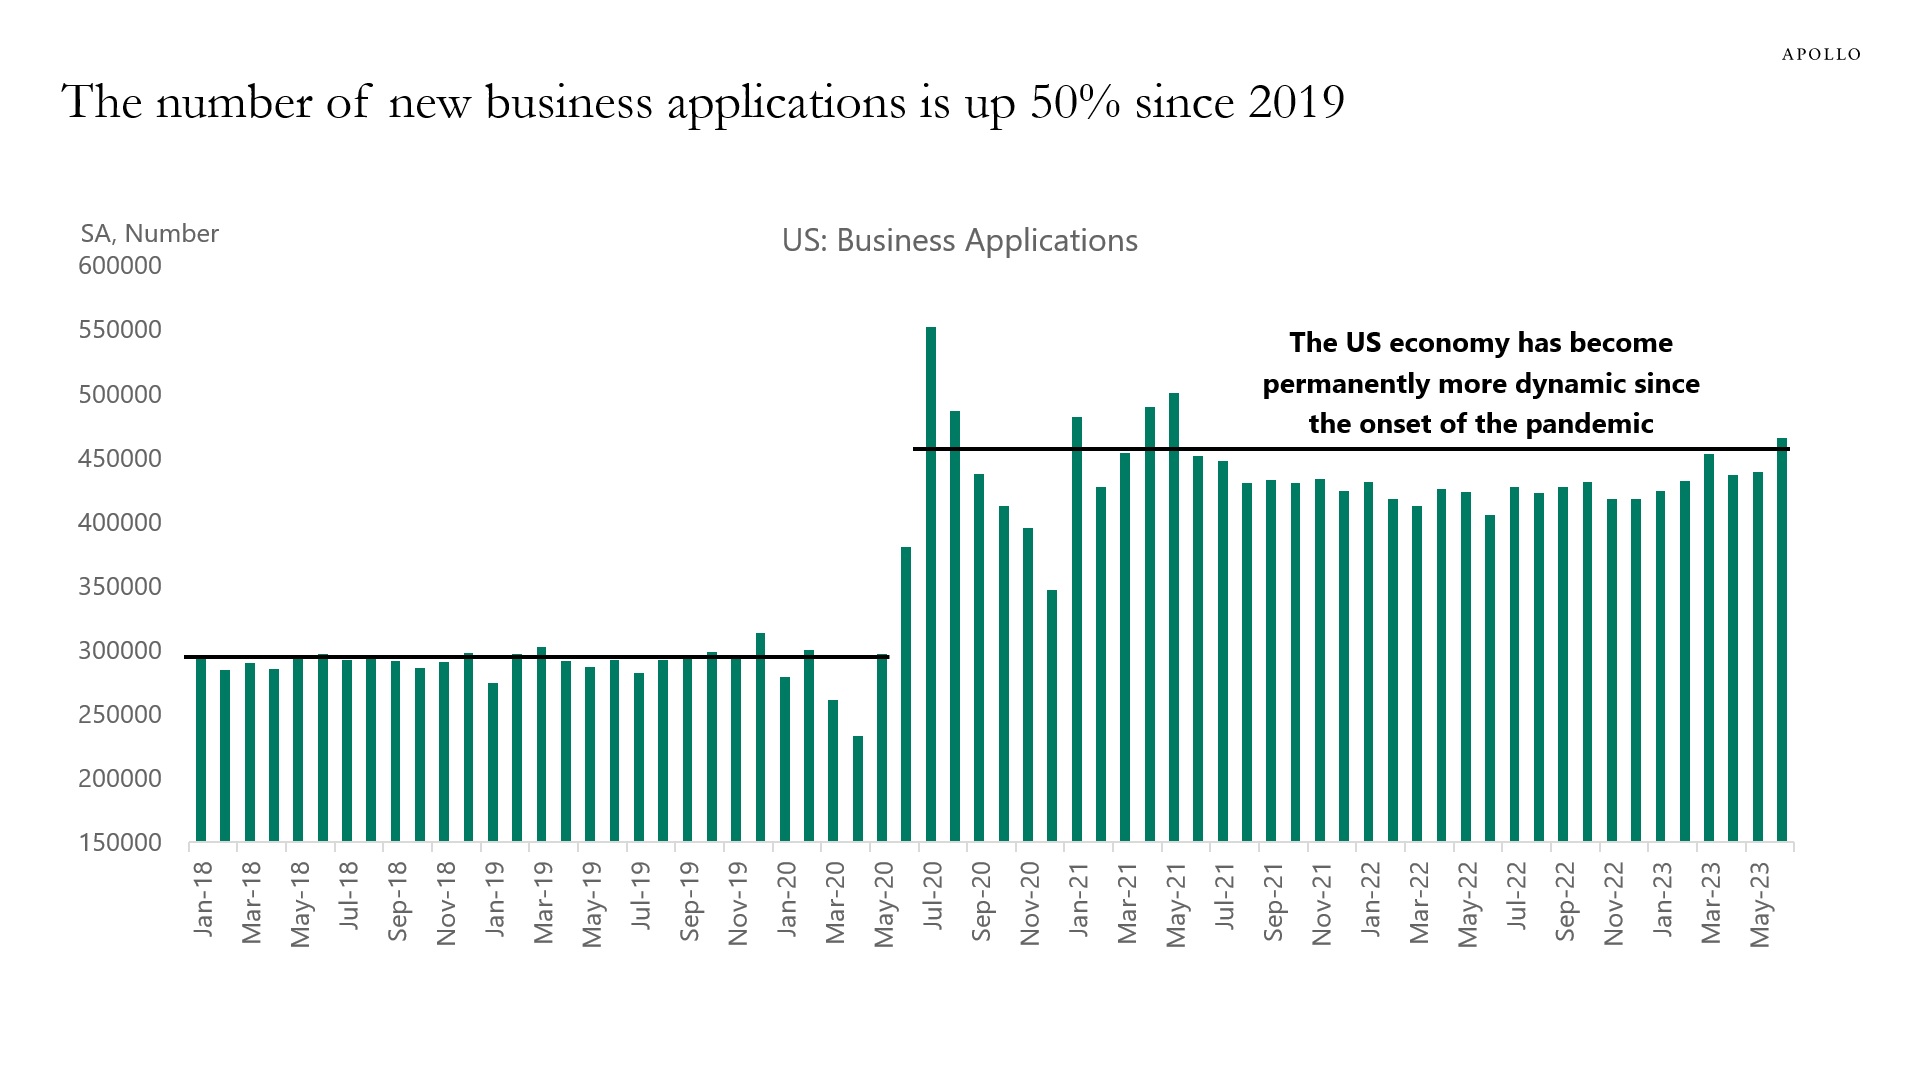
About 450,000 new businesses have opened every month since the onset of Covid-19, which is 50% higher than in 2019 when the number of new businesses opening every month was 300,000, see the first chart below.
The main sectors with significant growth in the number of firms are retail trade, professional services, and construction, see the second chart. Within the retail sector, online shopping accounted for 70% of all applications in 2020.
The bottom line is that the US economy was already the most competitive and dynamic economy in the world, and the level of entrepreneurship and innovation has increased further during the pandemic.
Source: Census Bureau, Haver Analytics, Apollo Chief Economist 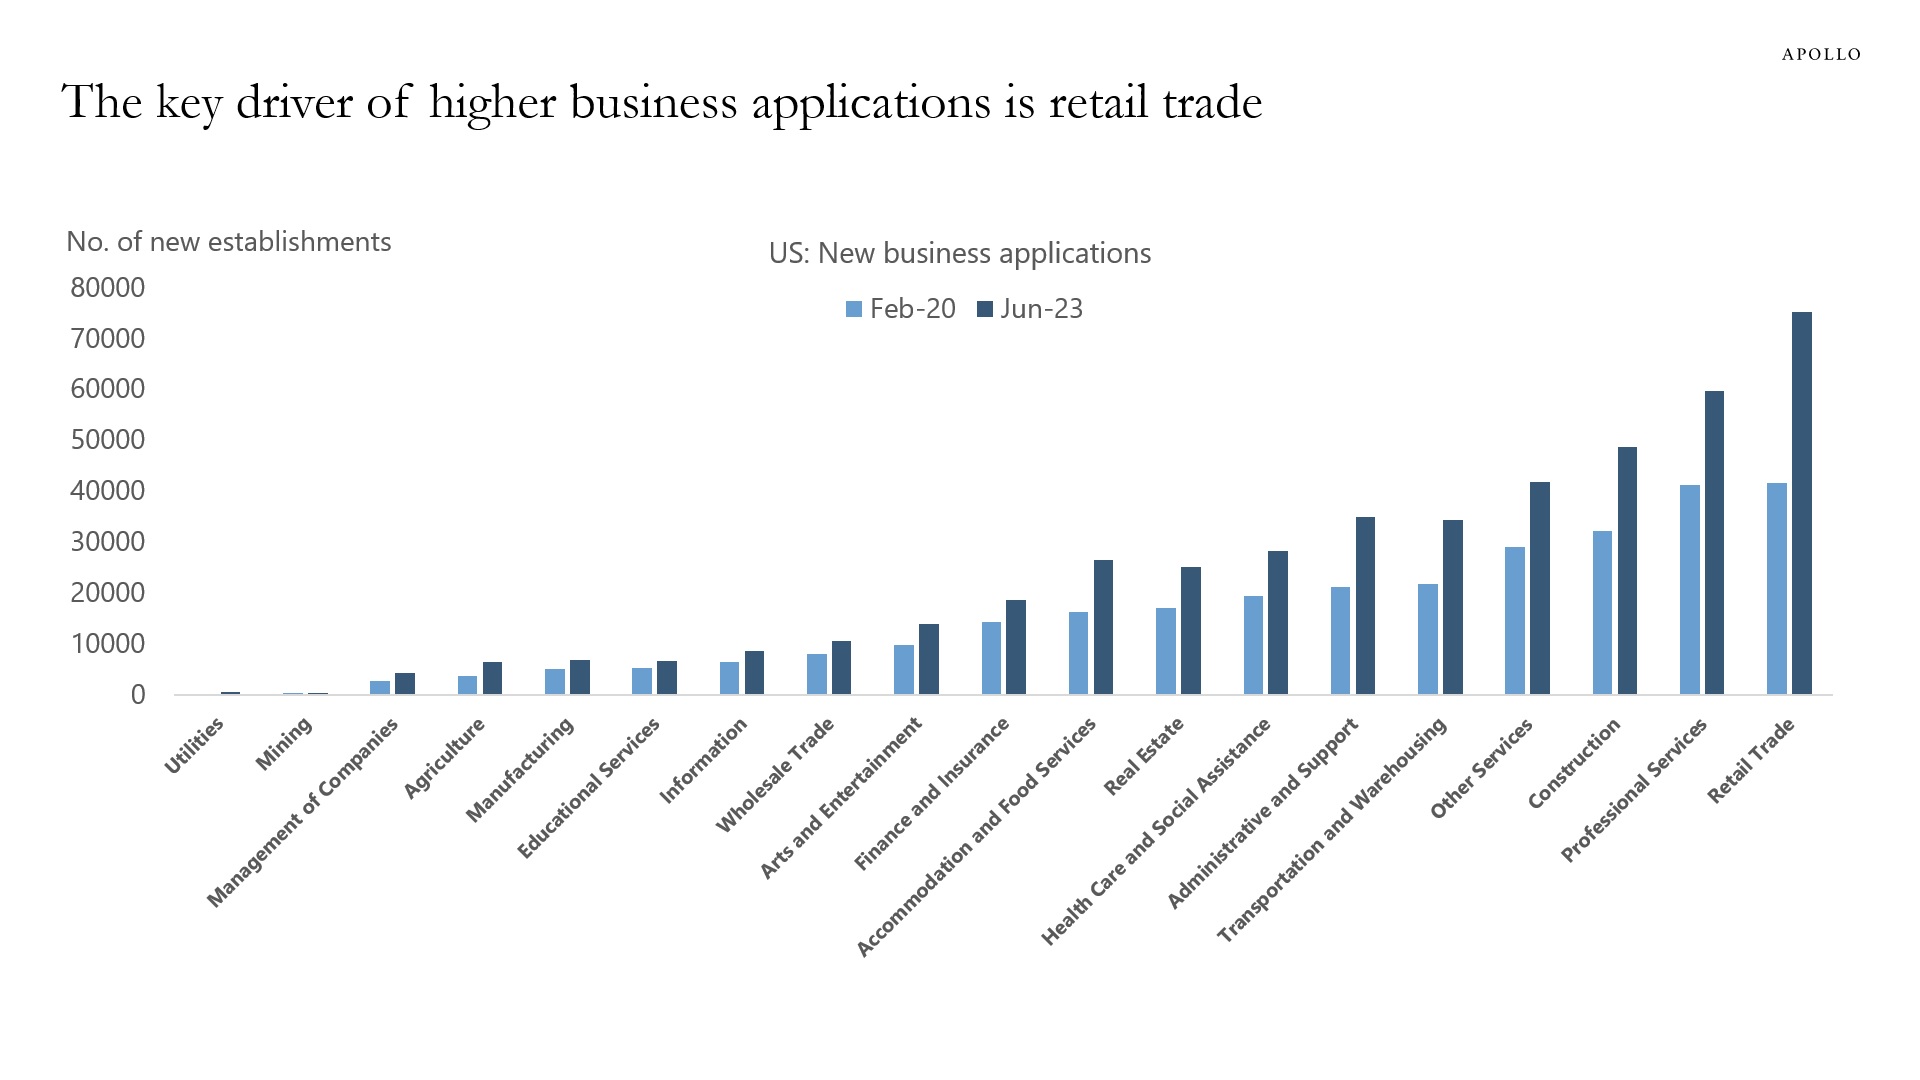
Source: Census Bureau, Haver Analytics, Apollo Chief Economist 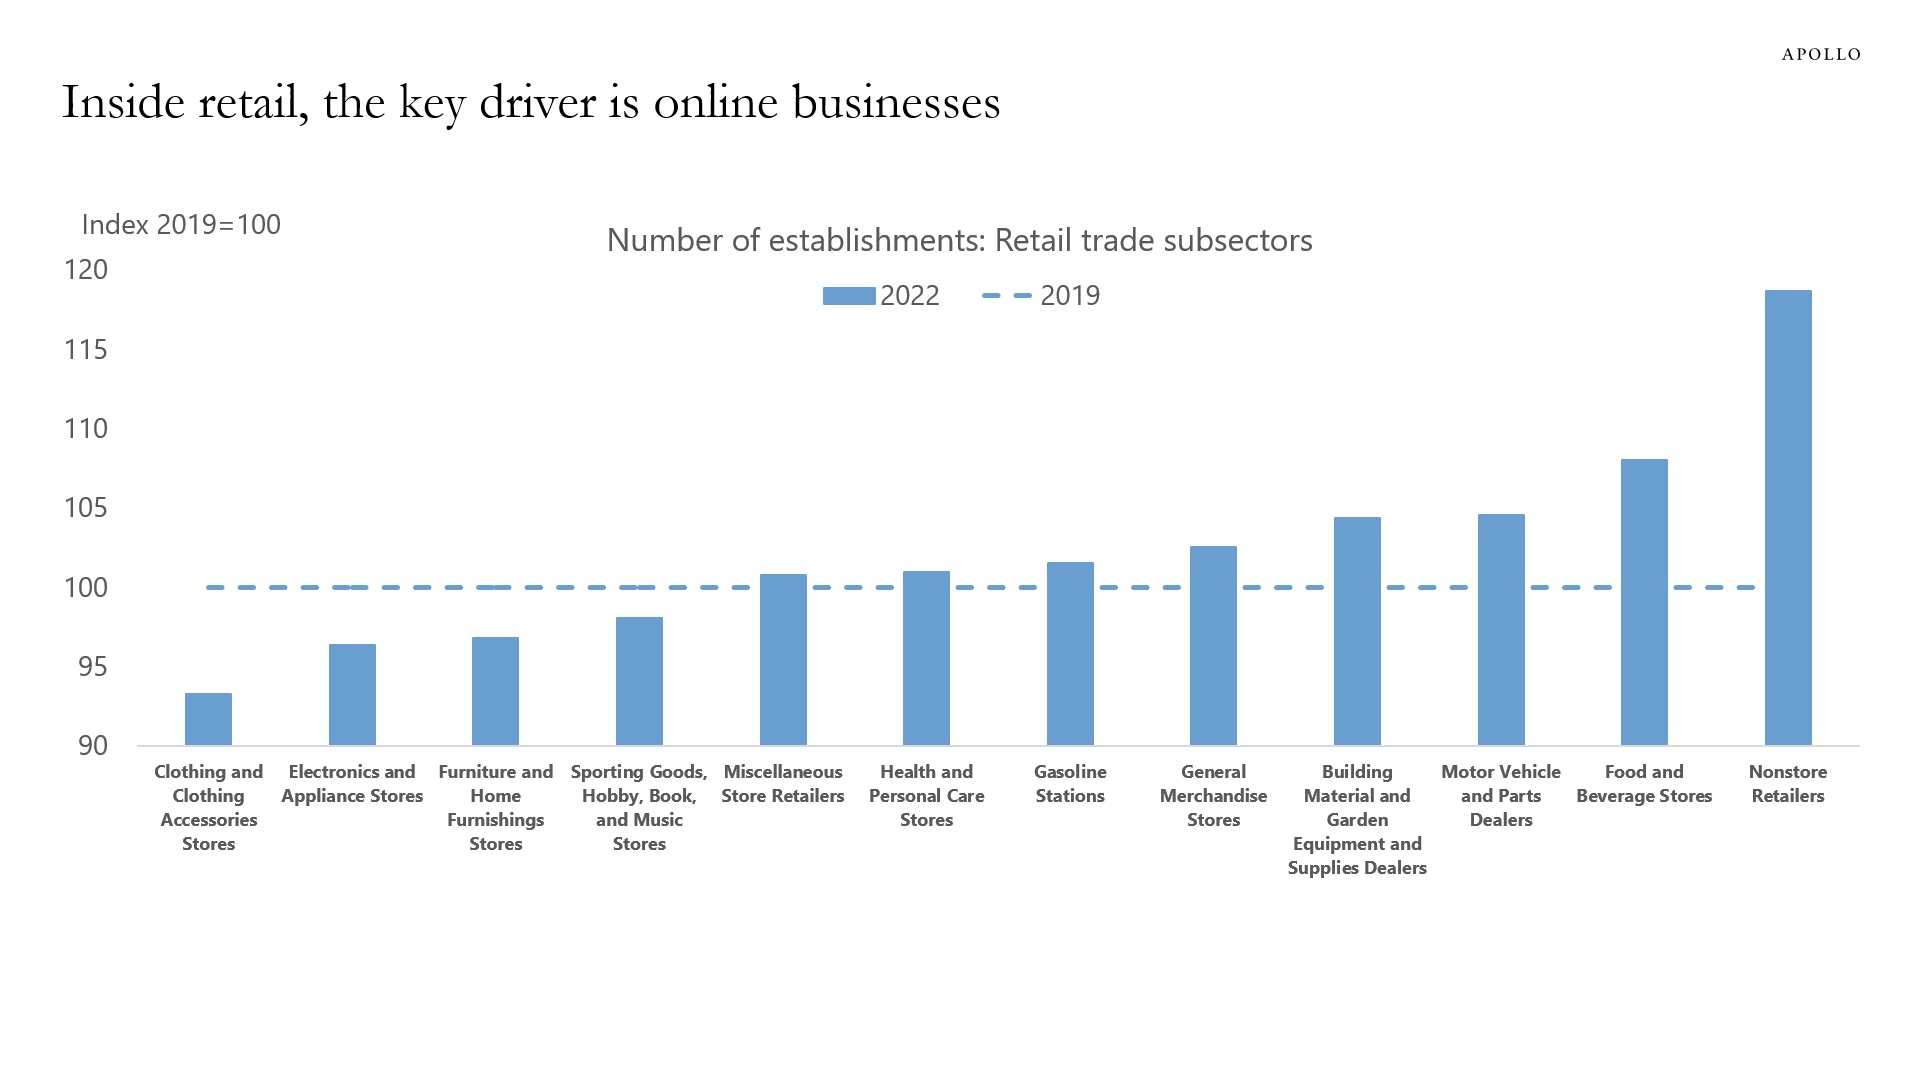
Source: Census Bureau, Haver Analytics, Apollo Chief Economist See important disclaimers at the bottom of the page.
-
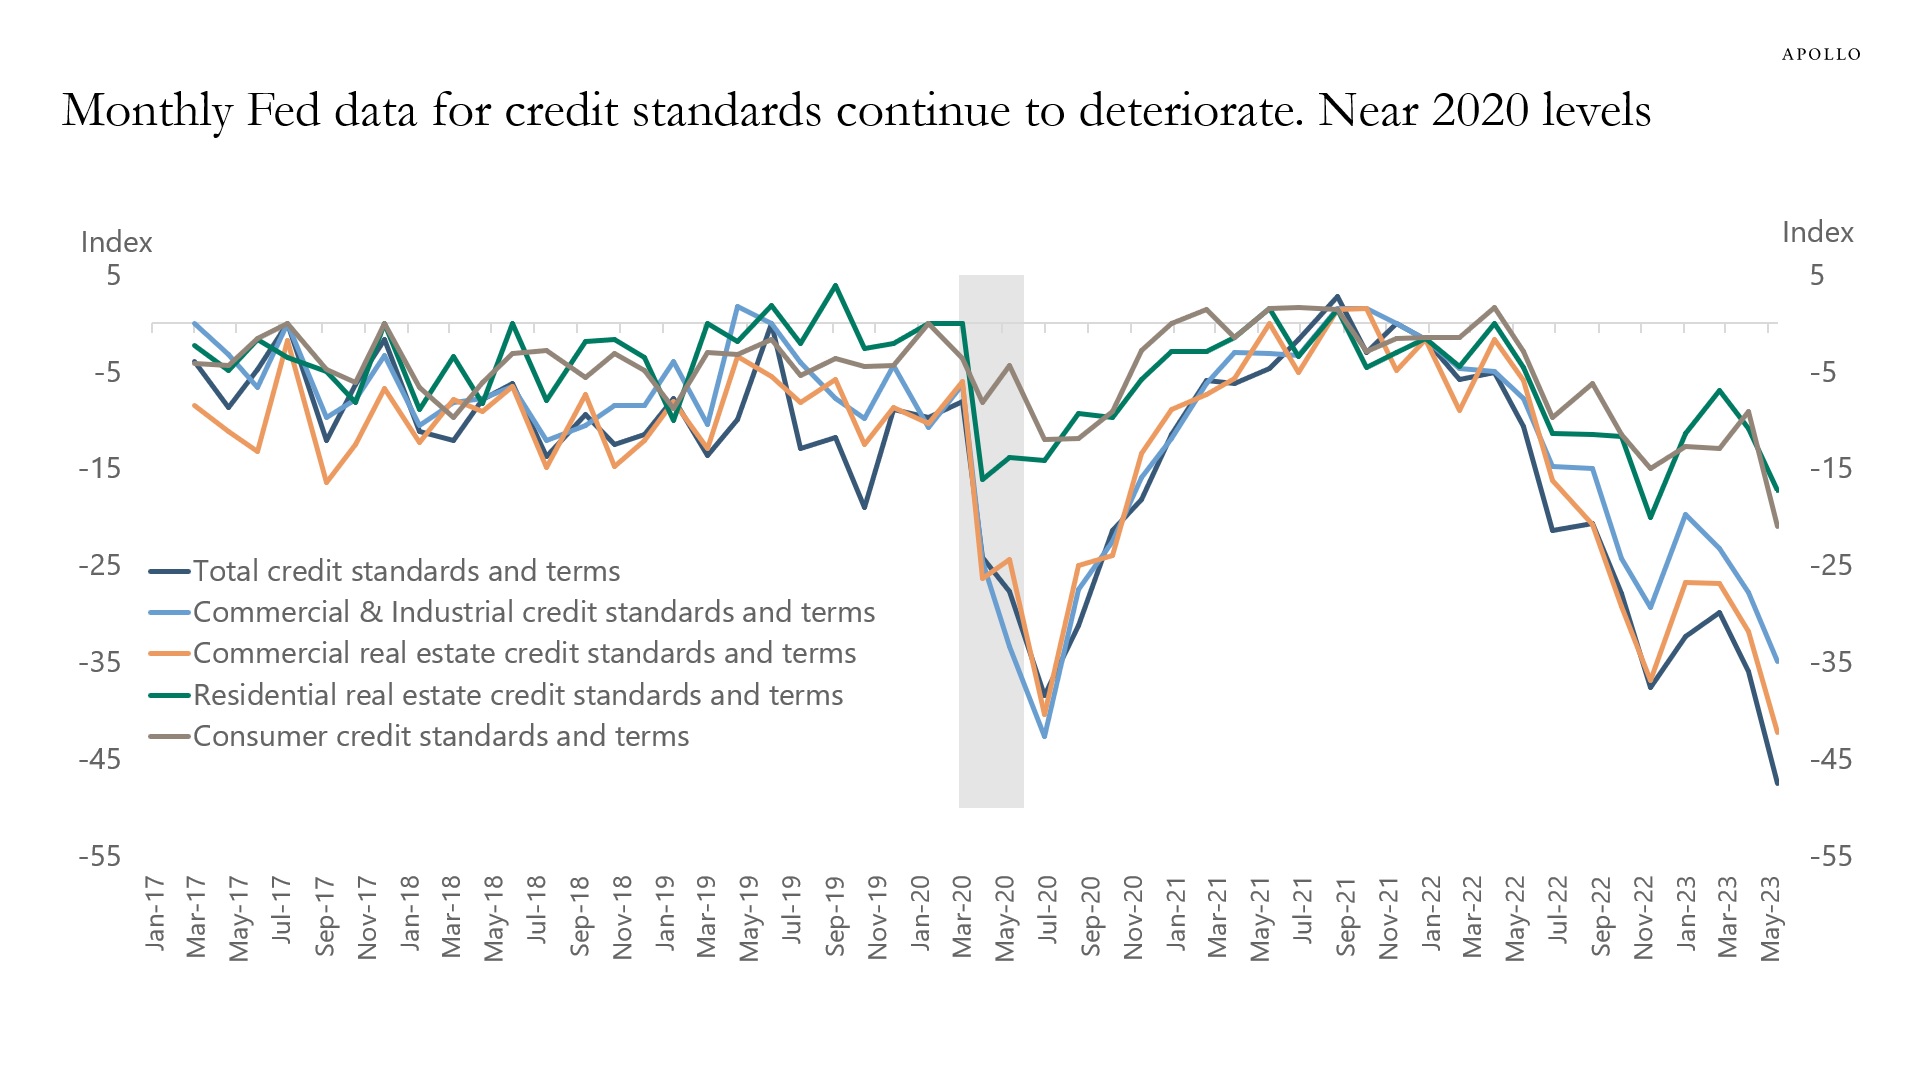
The Fed started raising rates last year, and credit growth continues to slow and credit conditions continue to deteriorate, which is what should be expected as the Fed tightens policy and continues to cool down the economy and inflation. This transmission of monetary policy will continue to drag down the economic data over the coming 12 to 18 months, see charts below and this presentation.
Source: Banking Conditions Survey, Federal Reserve Bank of Dallas, Apollo Chief Economist. Note: Data were collected May 2–10, and 67 financial institutions responded to the survey headquartered in the Eleventh Federal Reserve District. 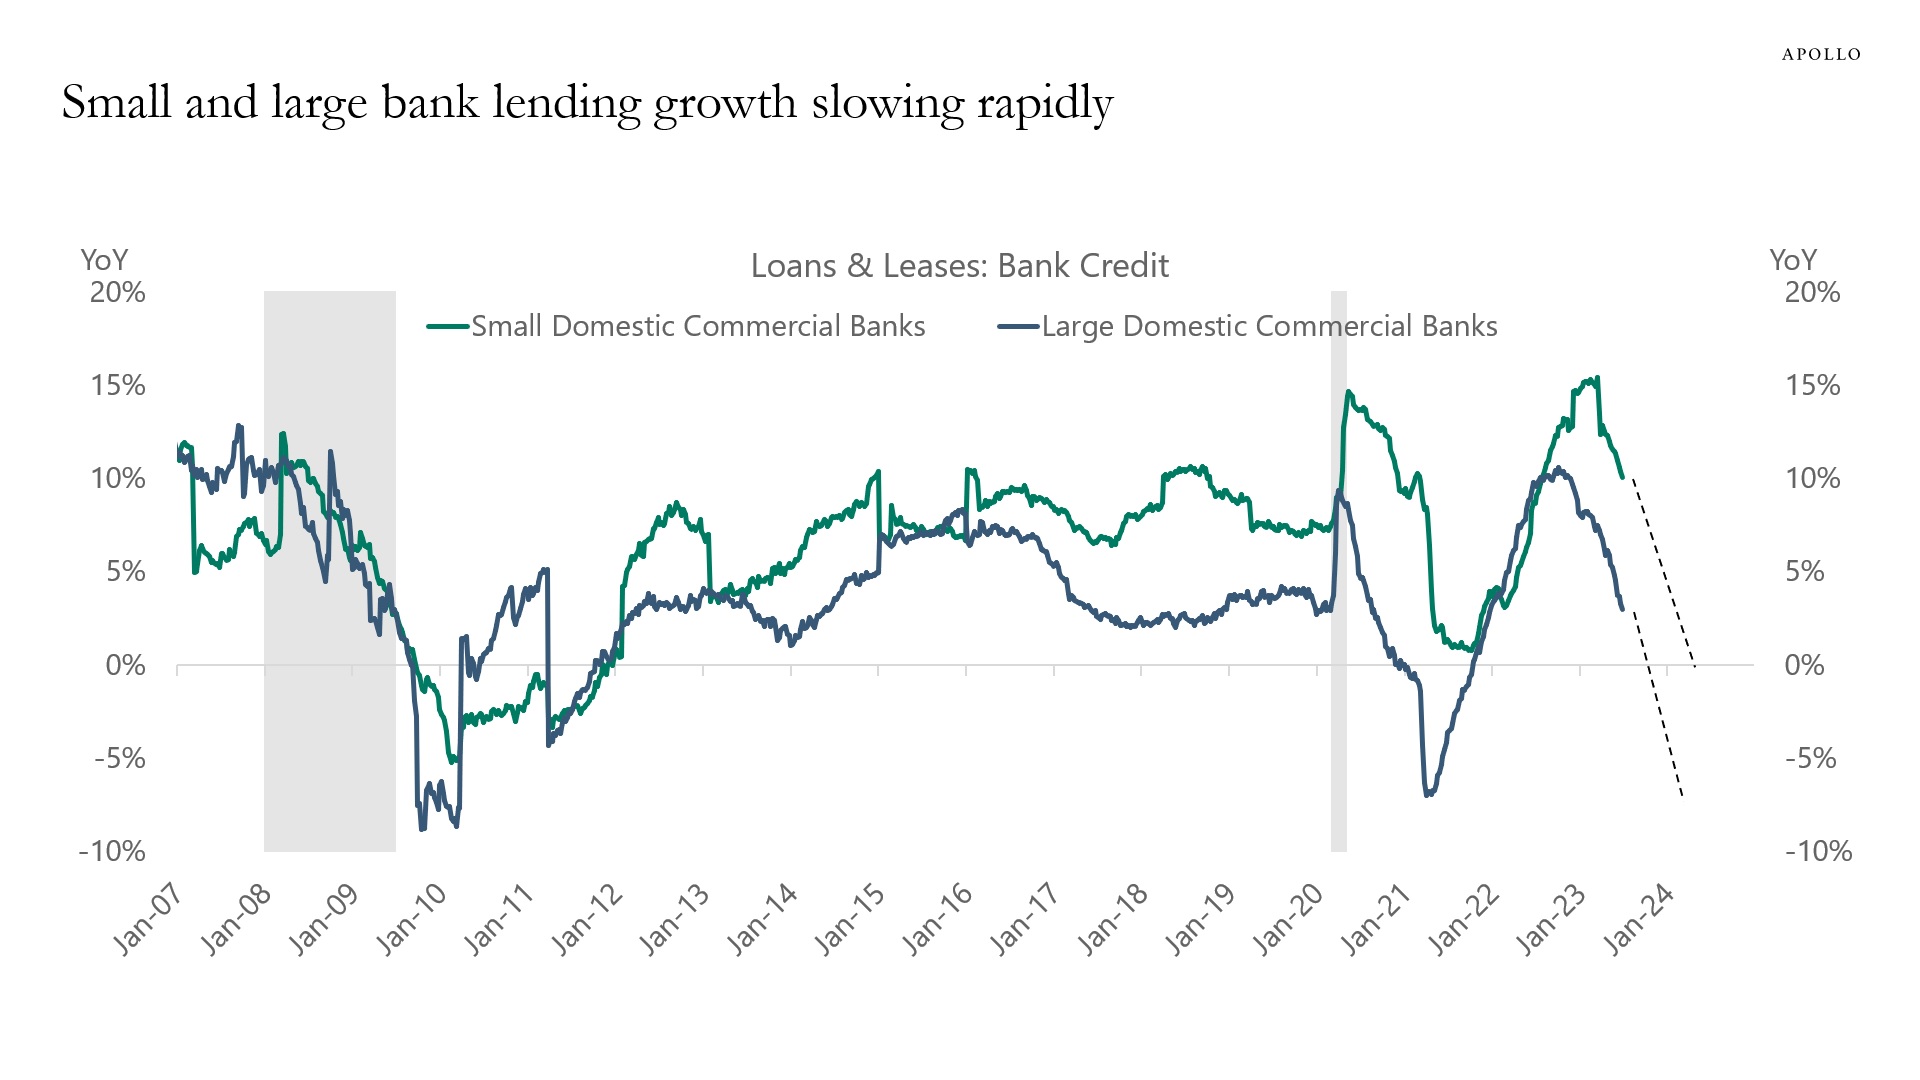
Source: Federal Reserve Board, Haver Analytics, Apollo Chief Economist 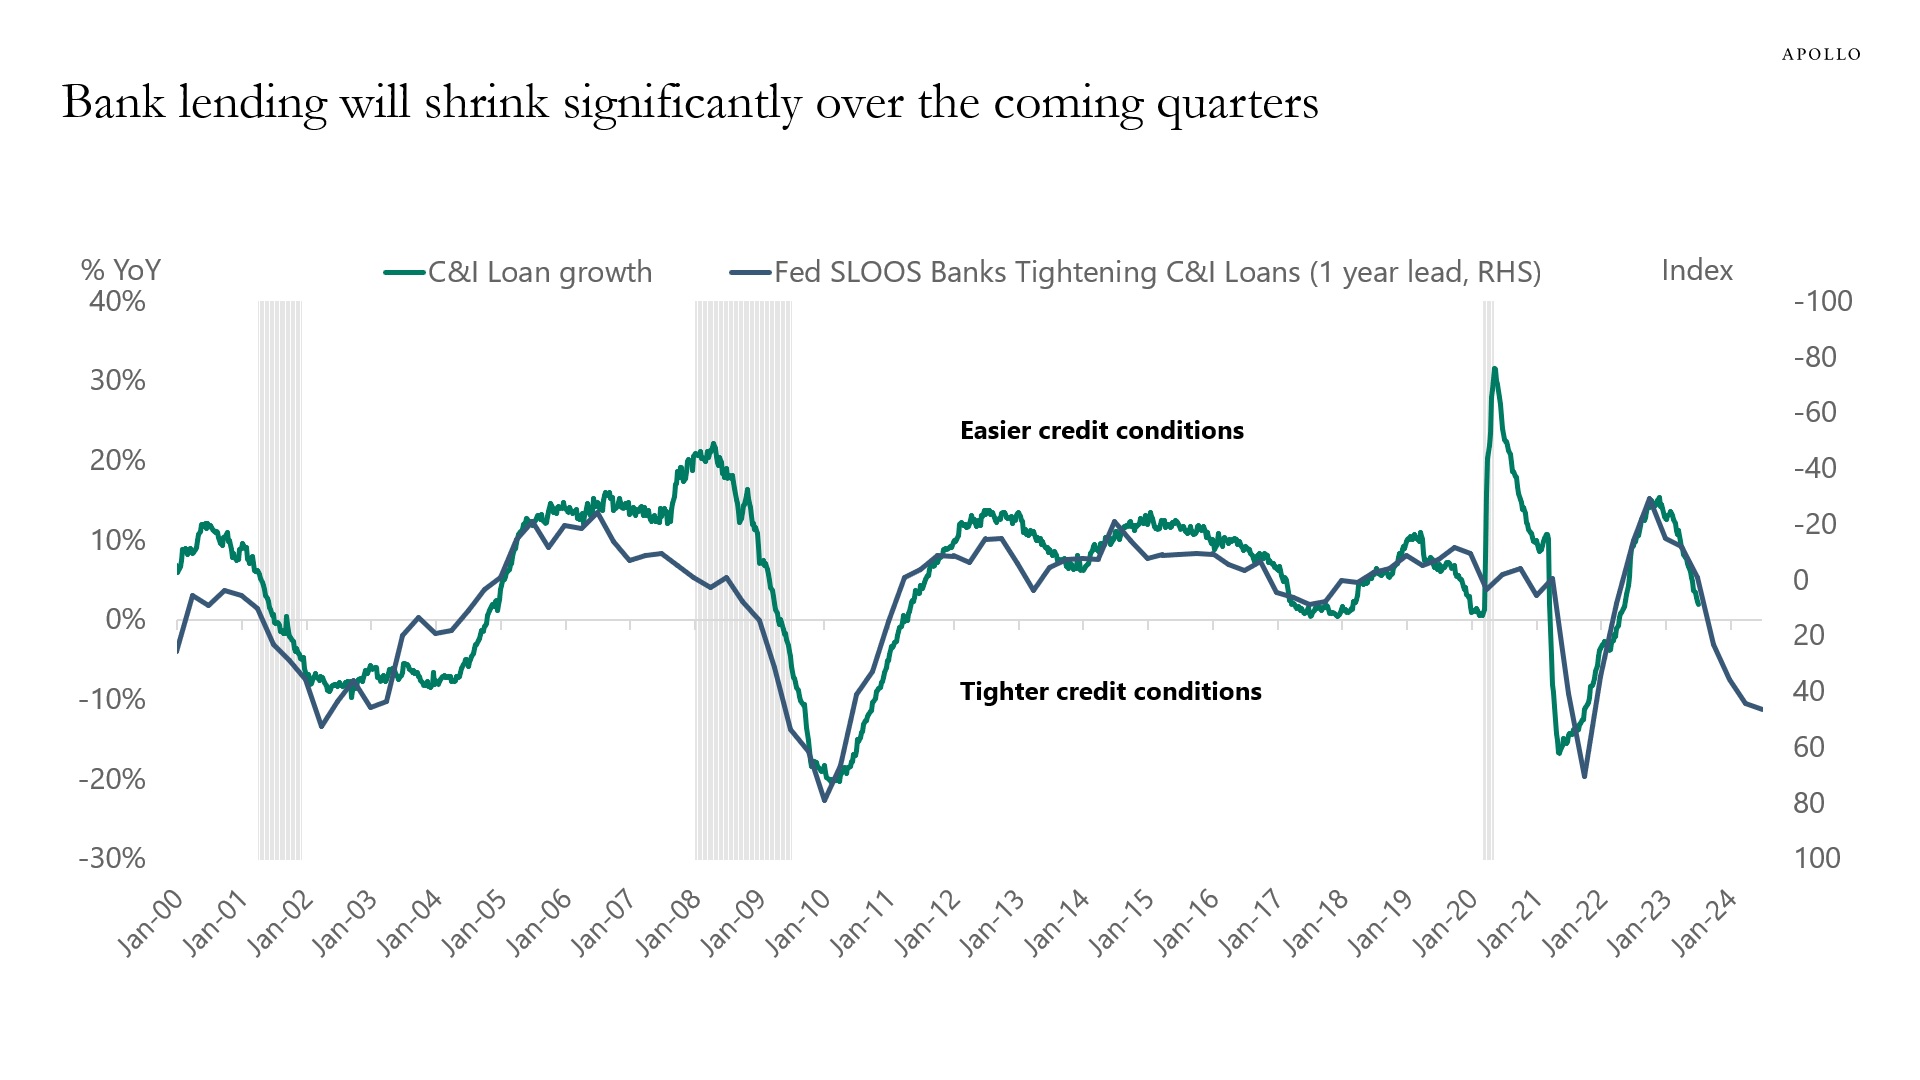
Source: FRB, Haver Analytics, Apollo Chief Economist 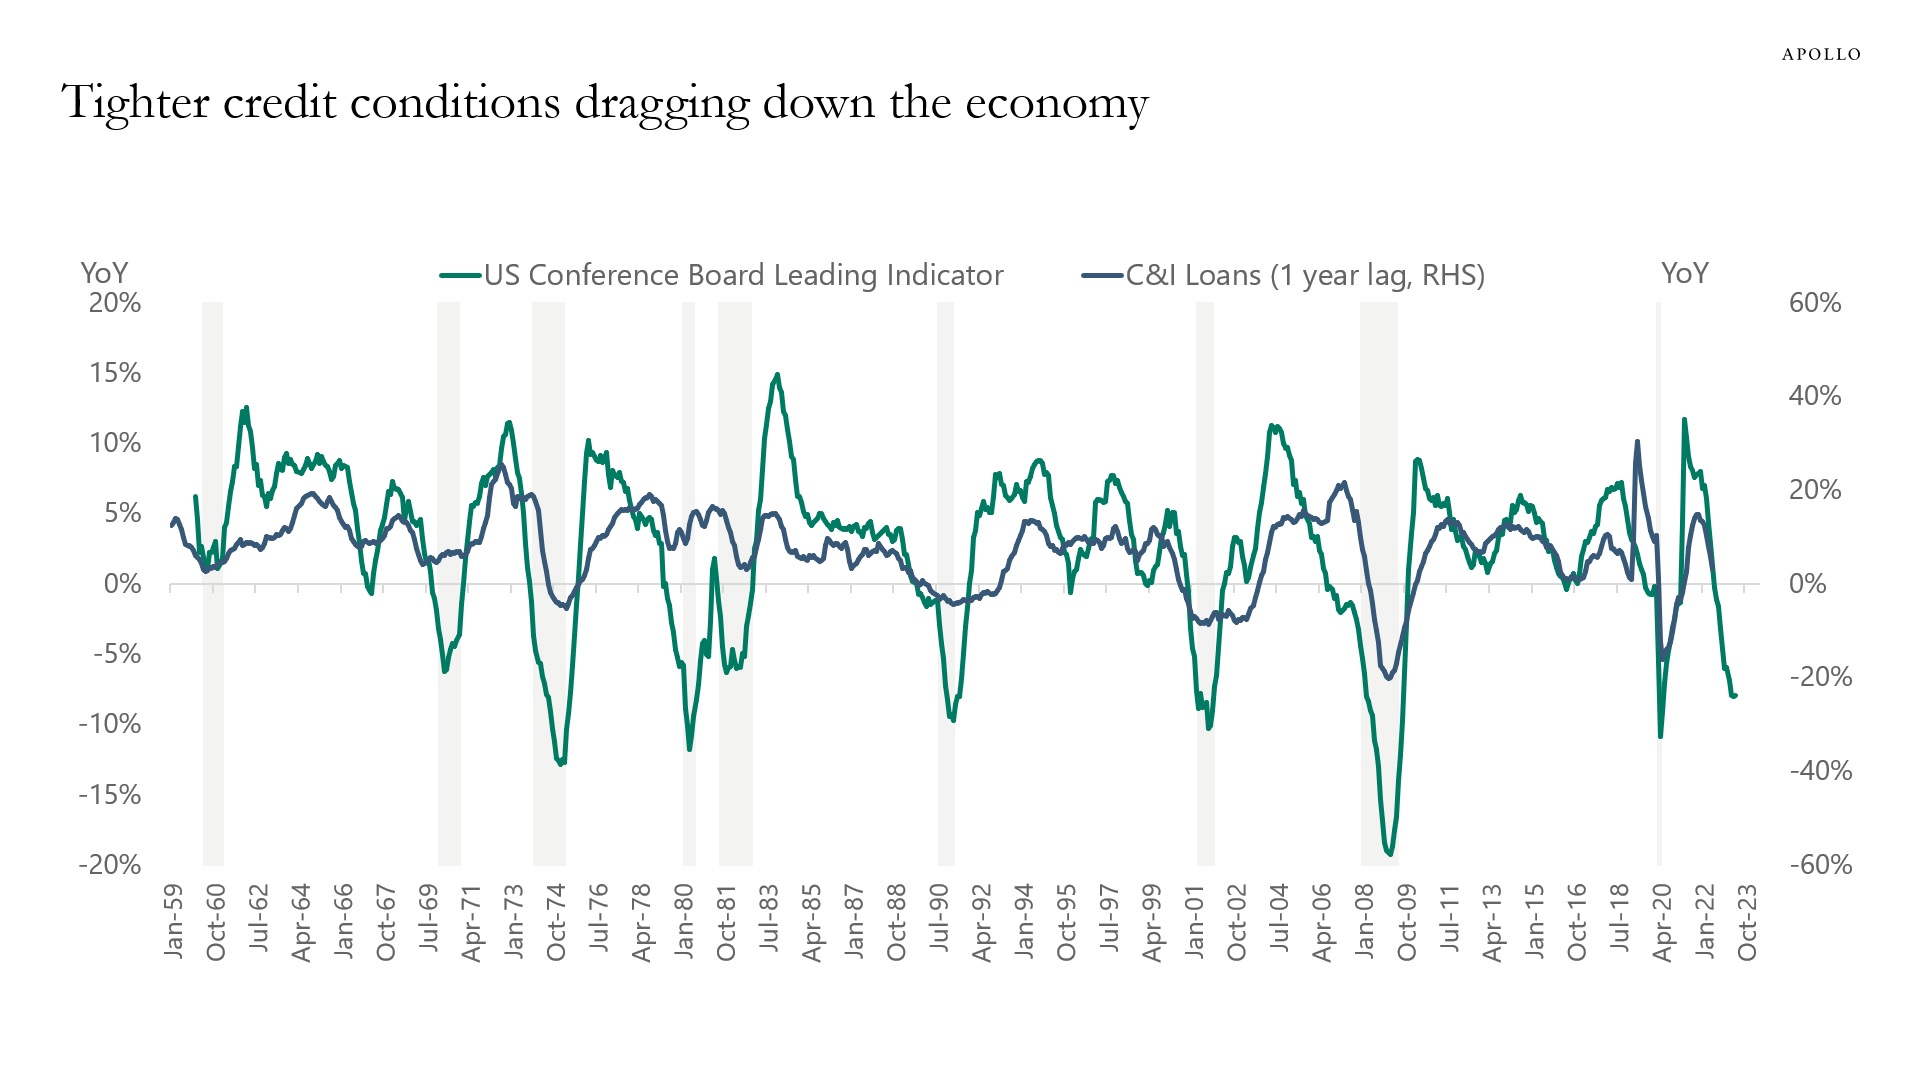
Source: Conference Board, FRB, Haver Analytics, Apollo Chief Economist 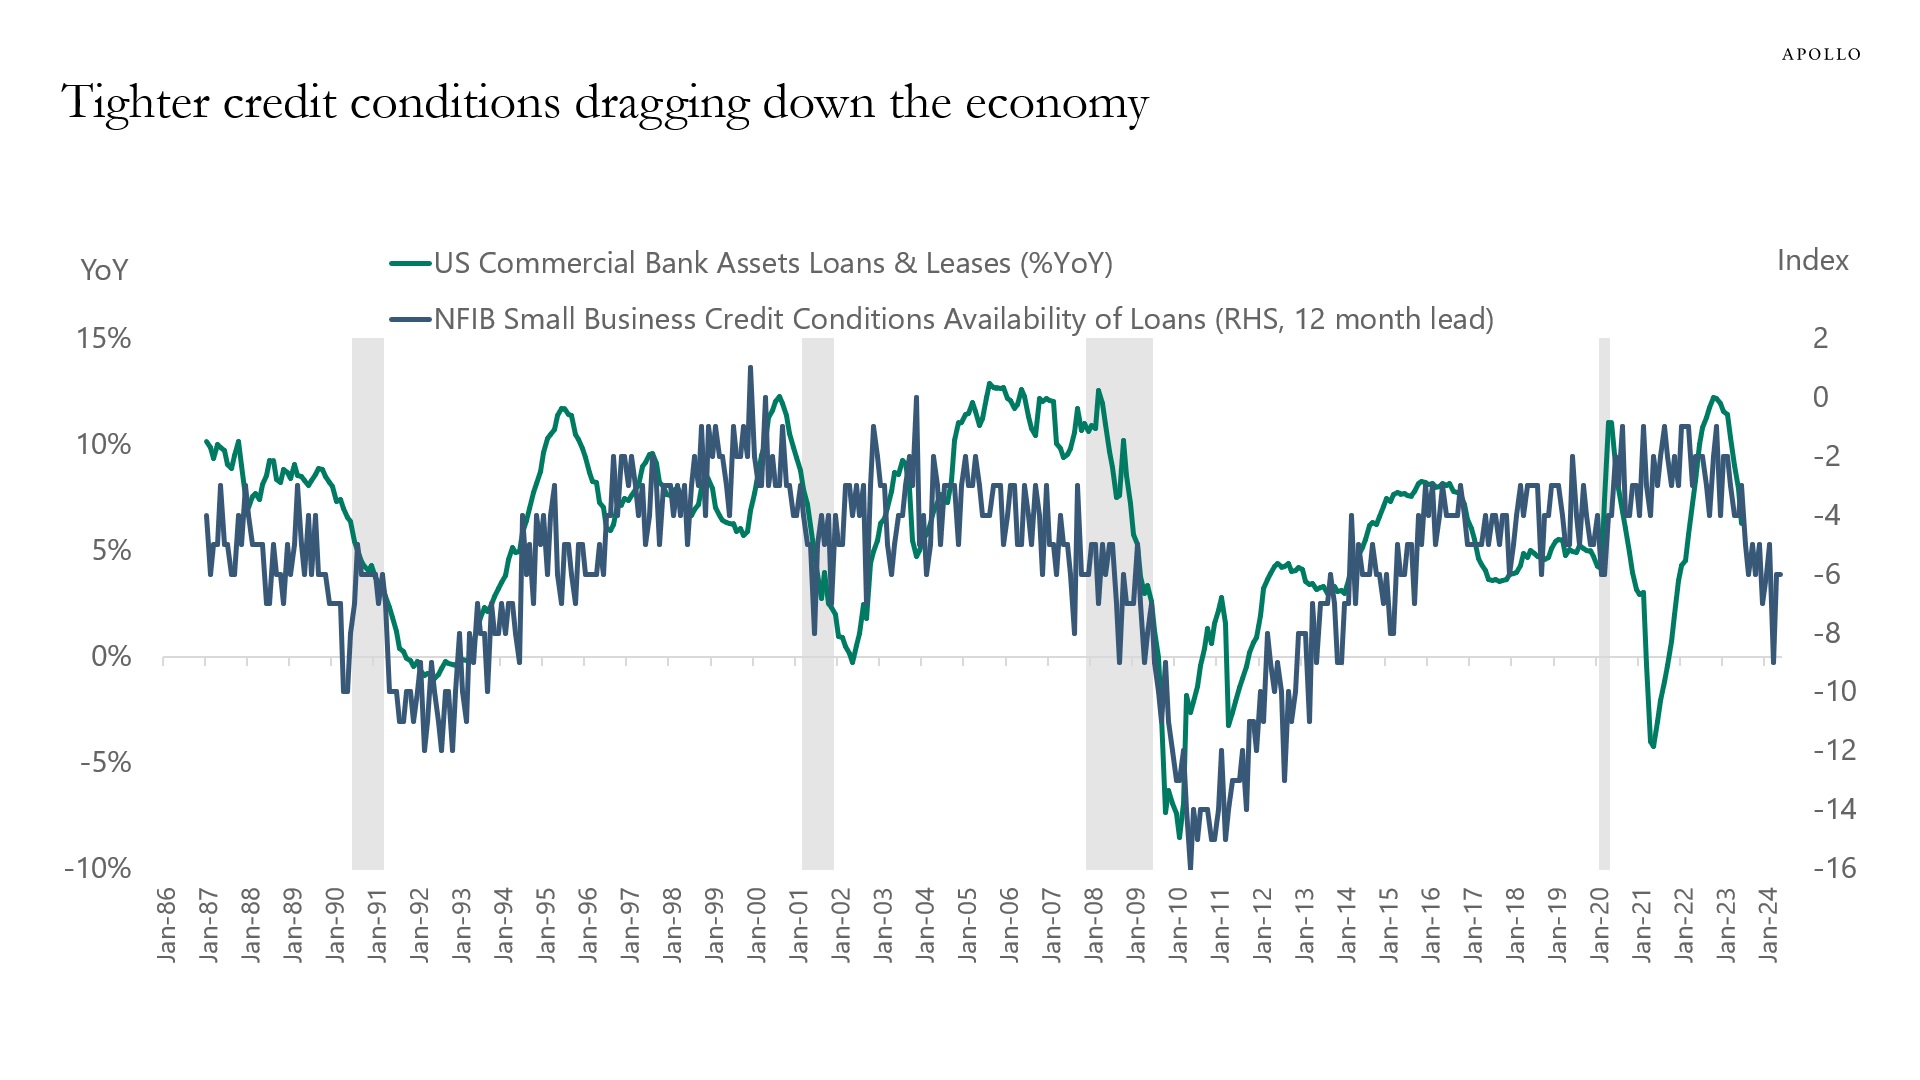
Source: NFIB, FRB, Bloomberg, Apollo Chief Economist 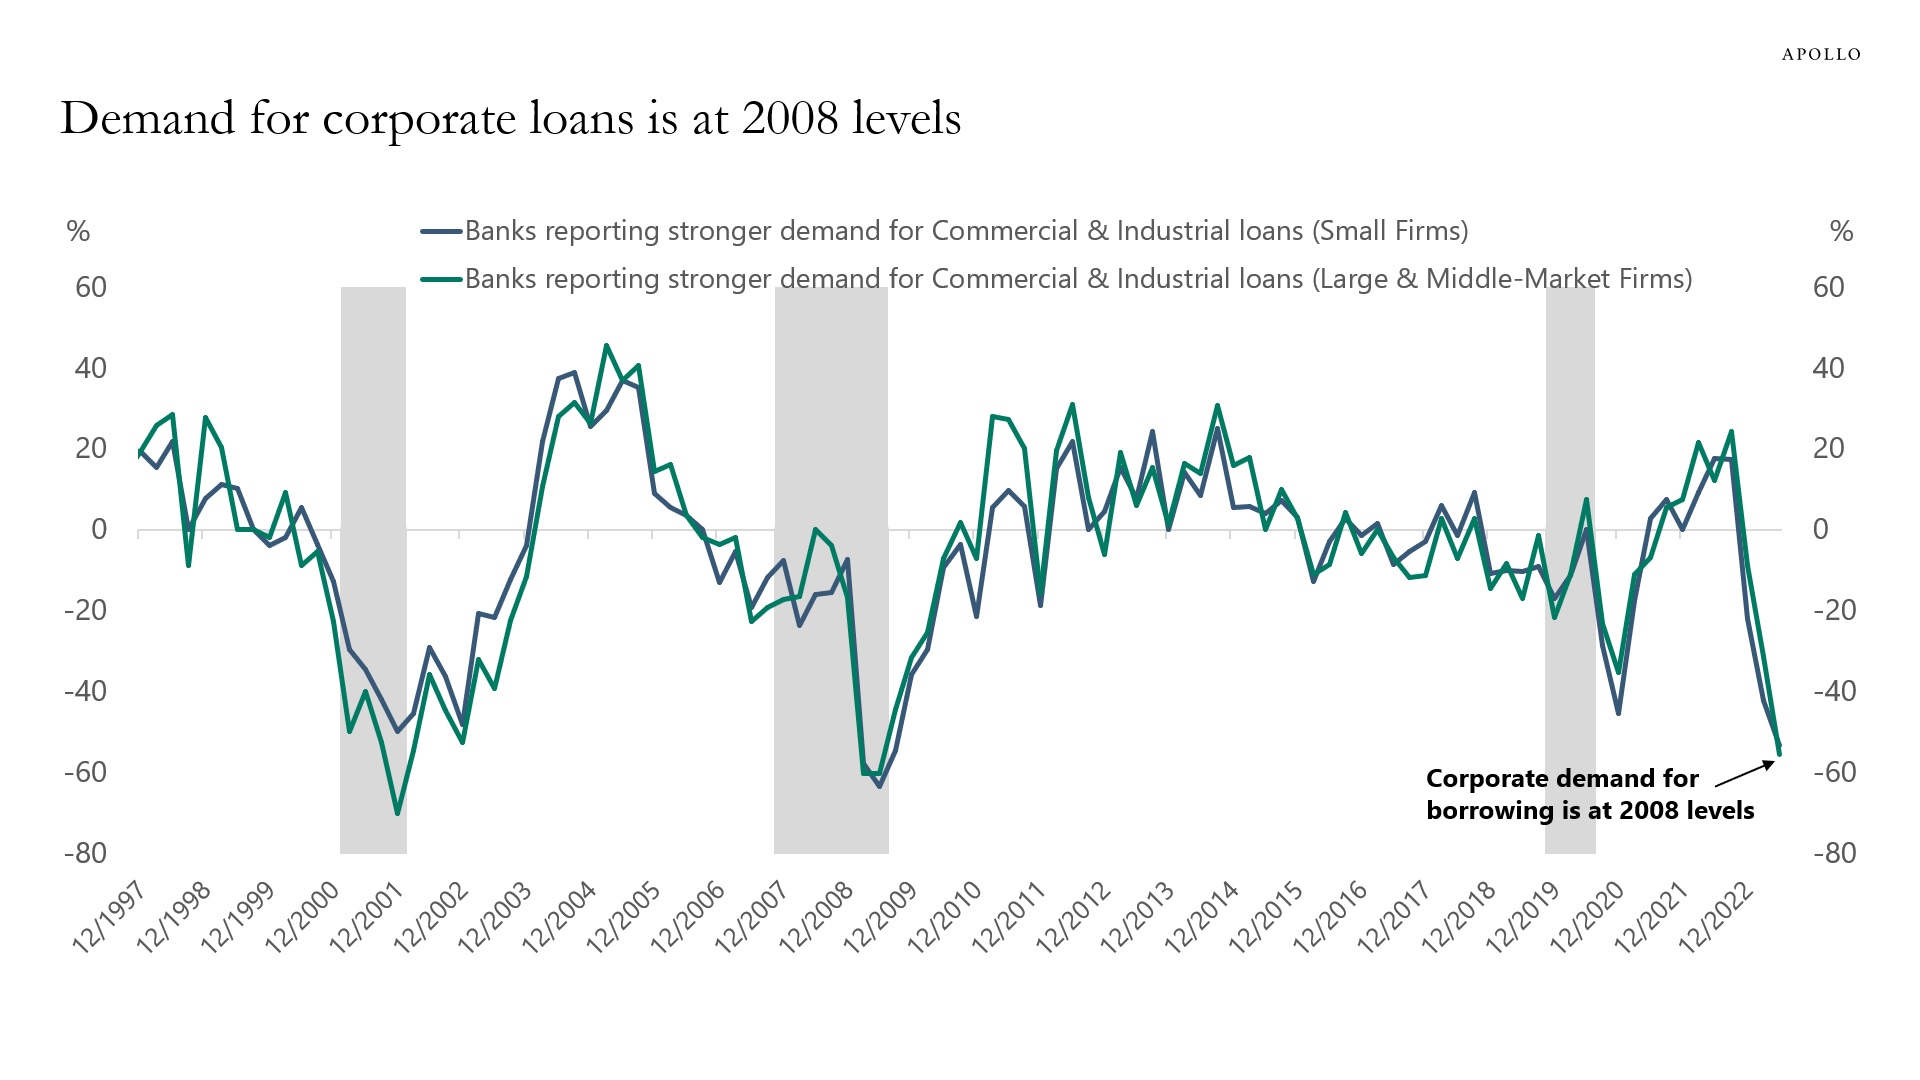
Source: FRB, Bloomberg, Apollo Chief Economist 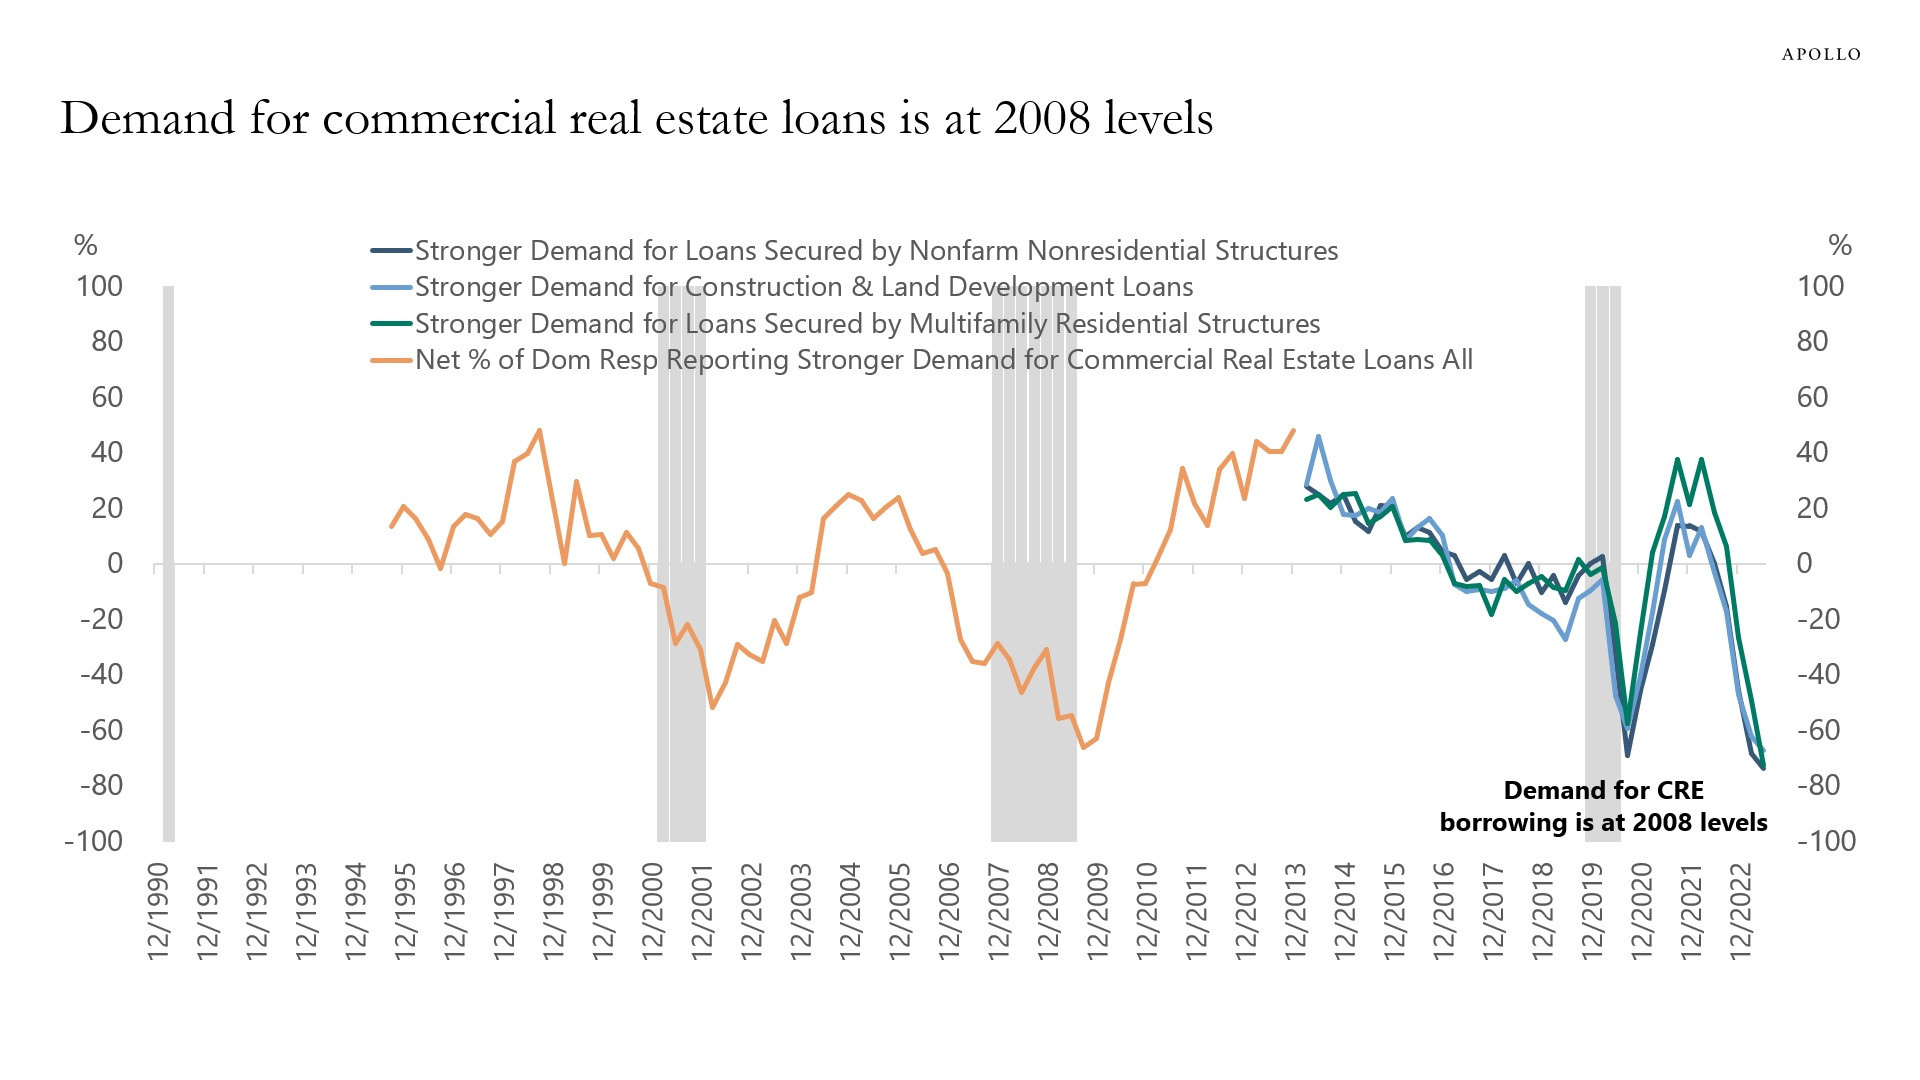
Source: FRB, Bloomberg, Apollo Chief Economist 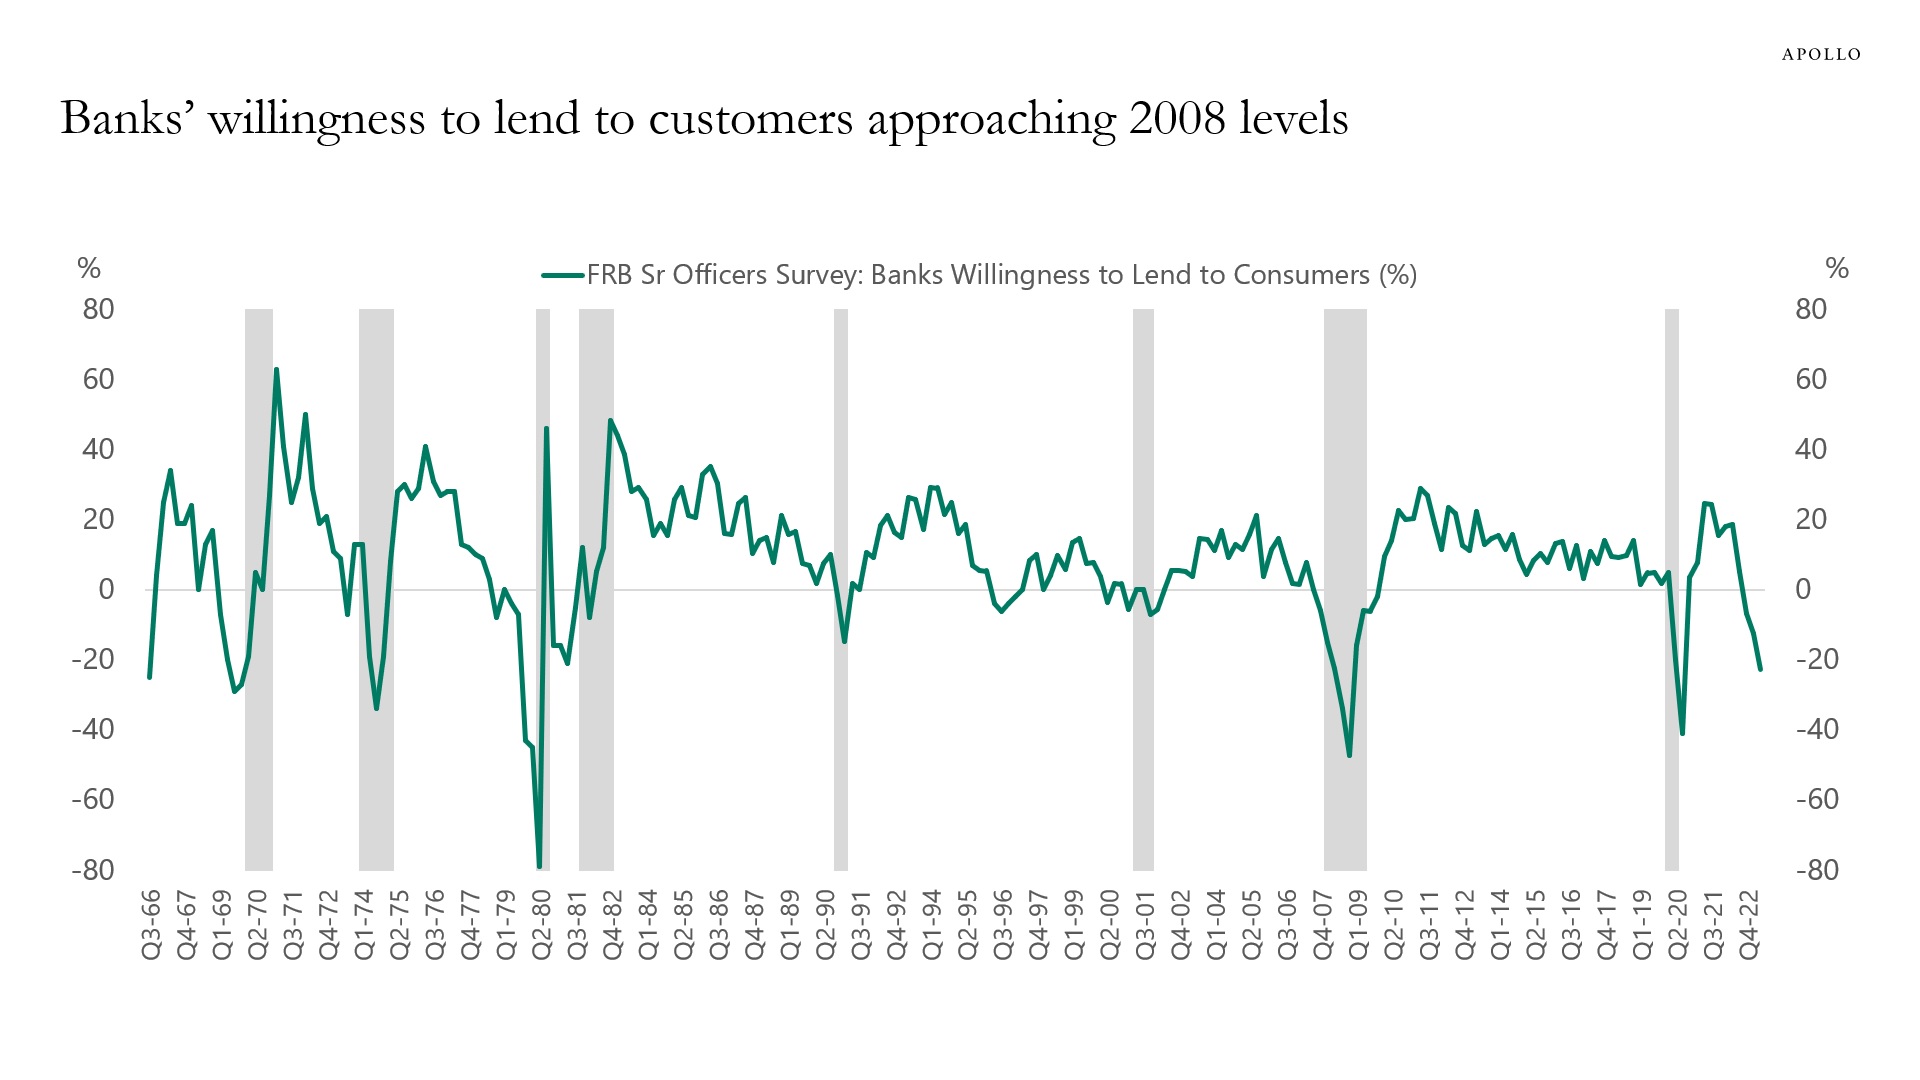
Source: FRB, Bloomberg, Apollo Chief Economist 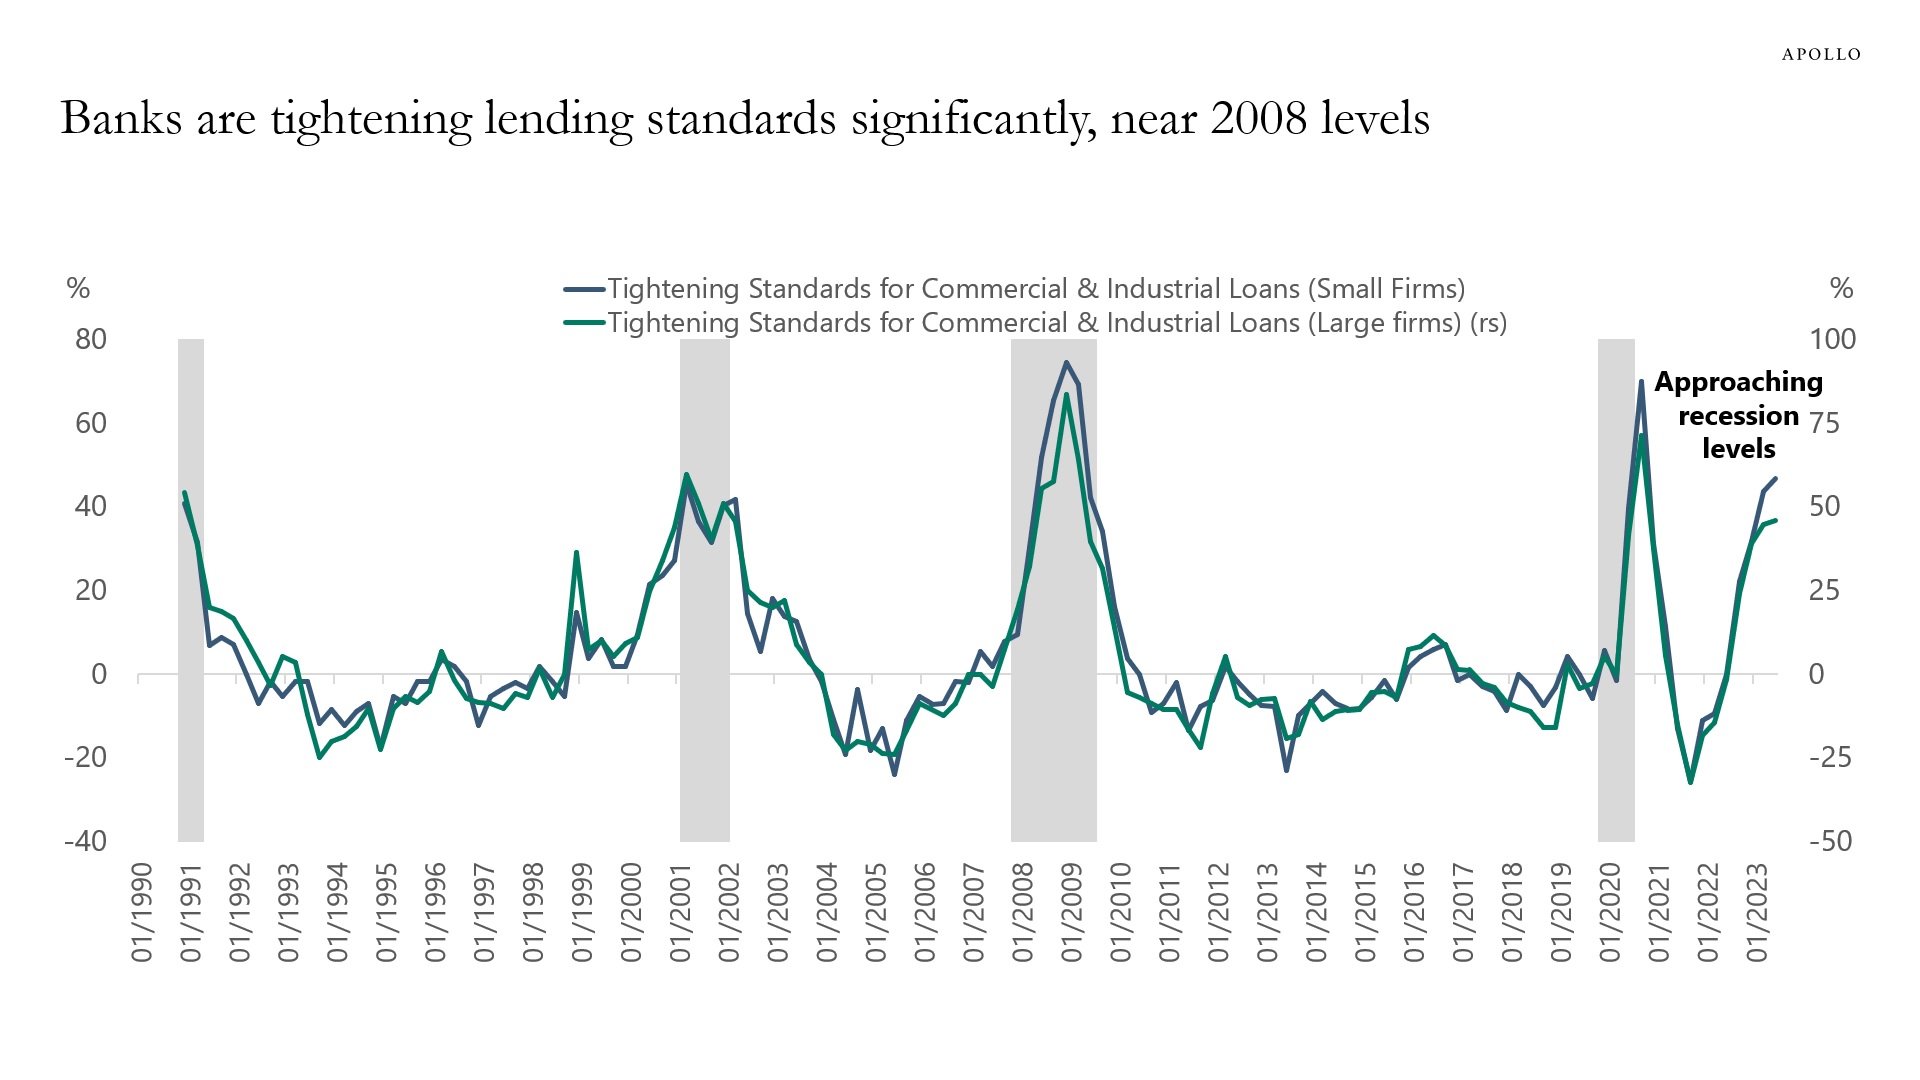
Source: FRB, Bloomberg, Apollo Chief Economist 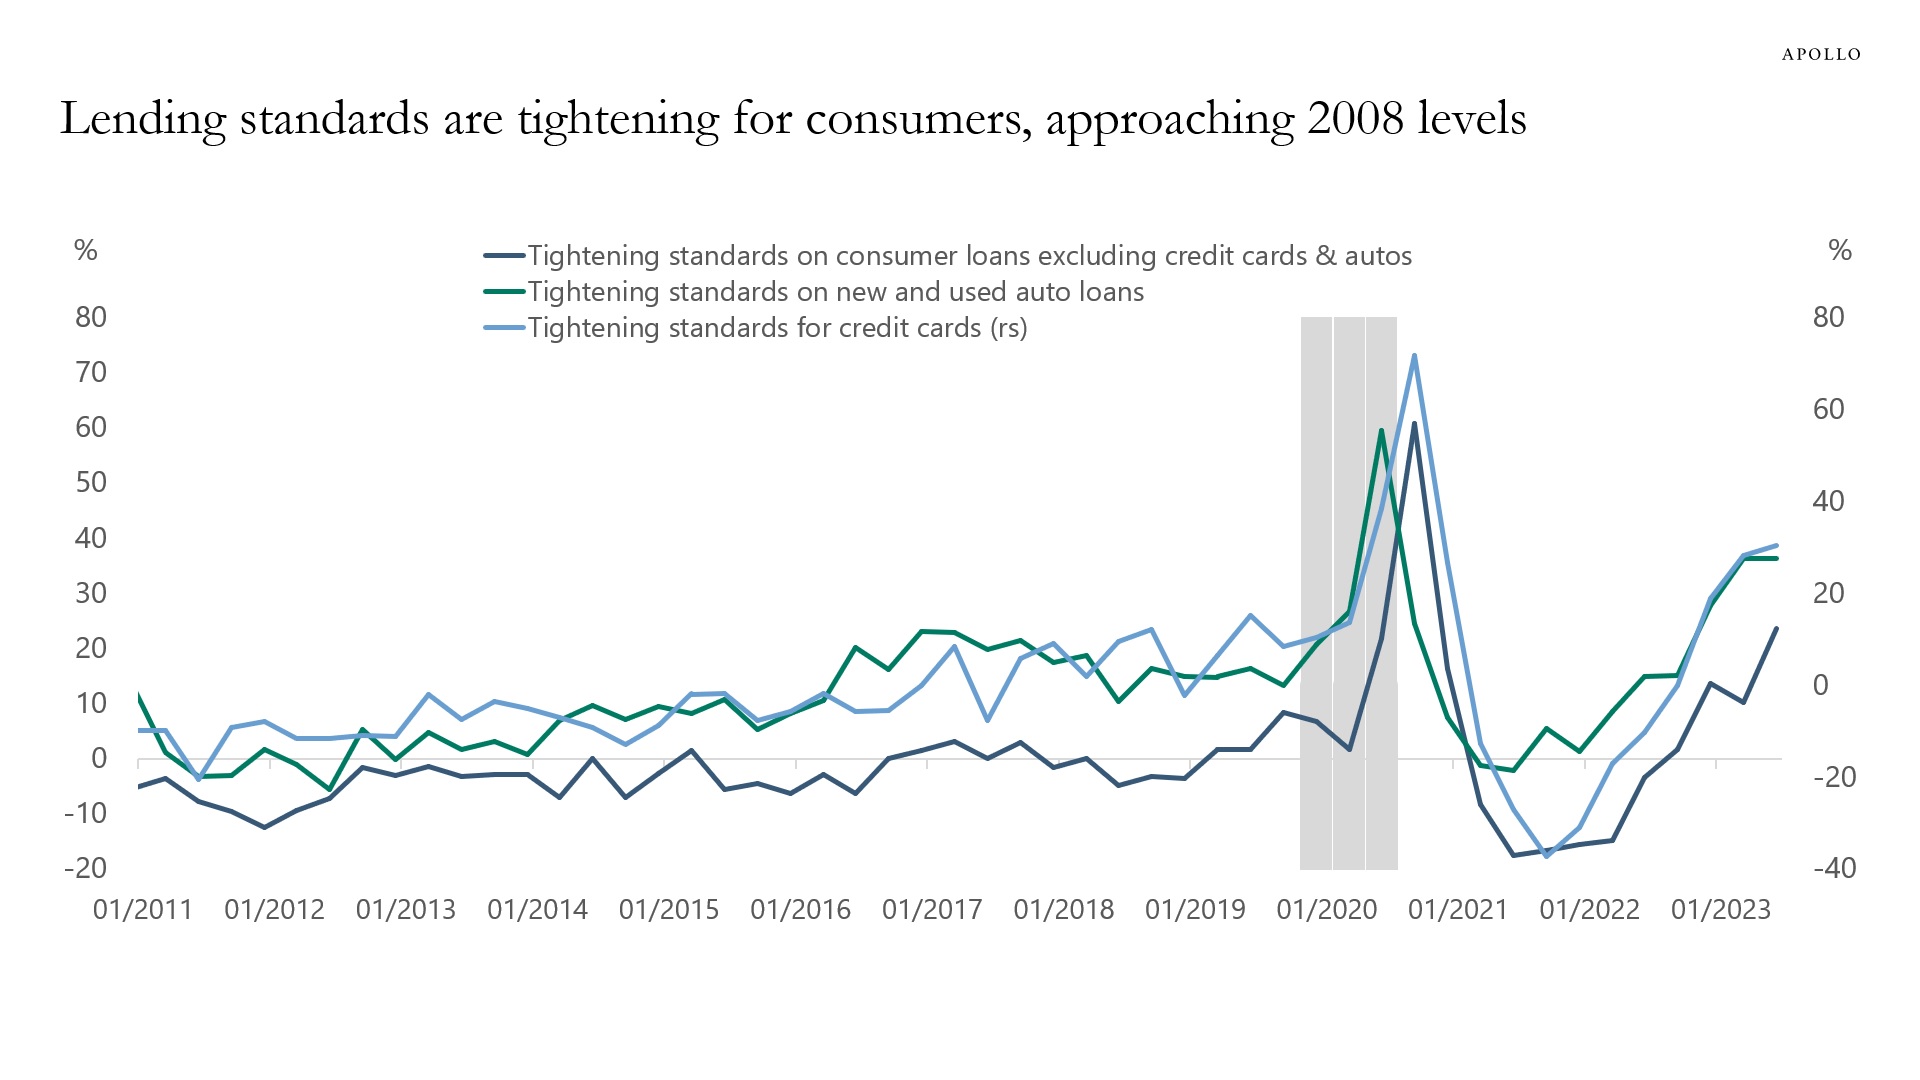
Source: FRB, Bloomberg, Apollo Chief Economist 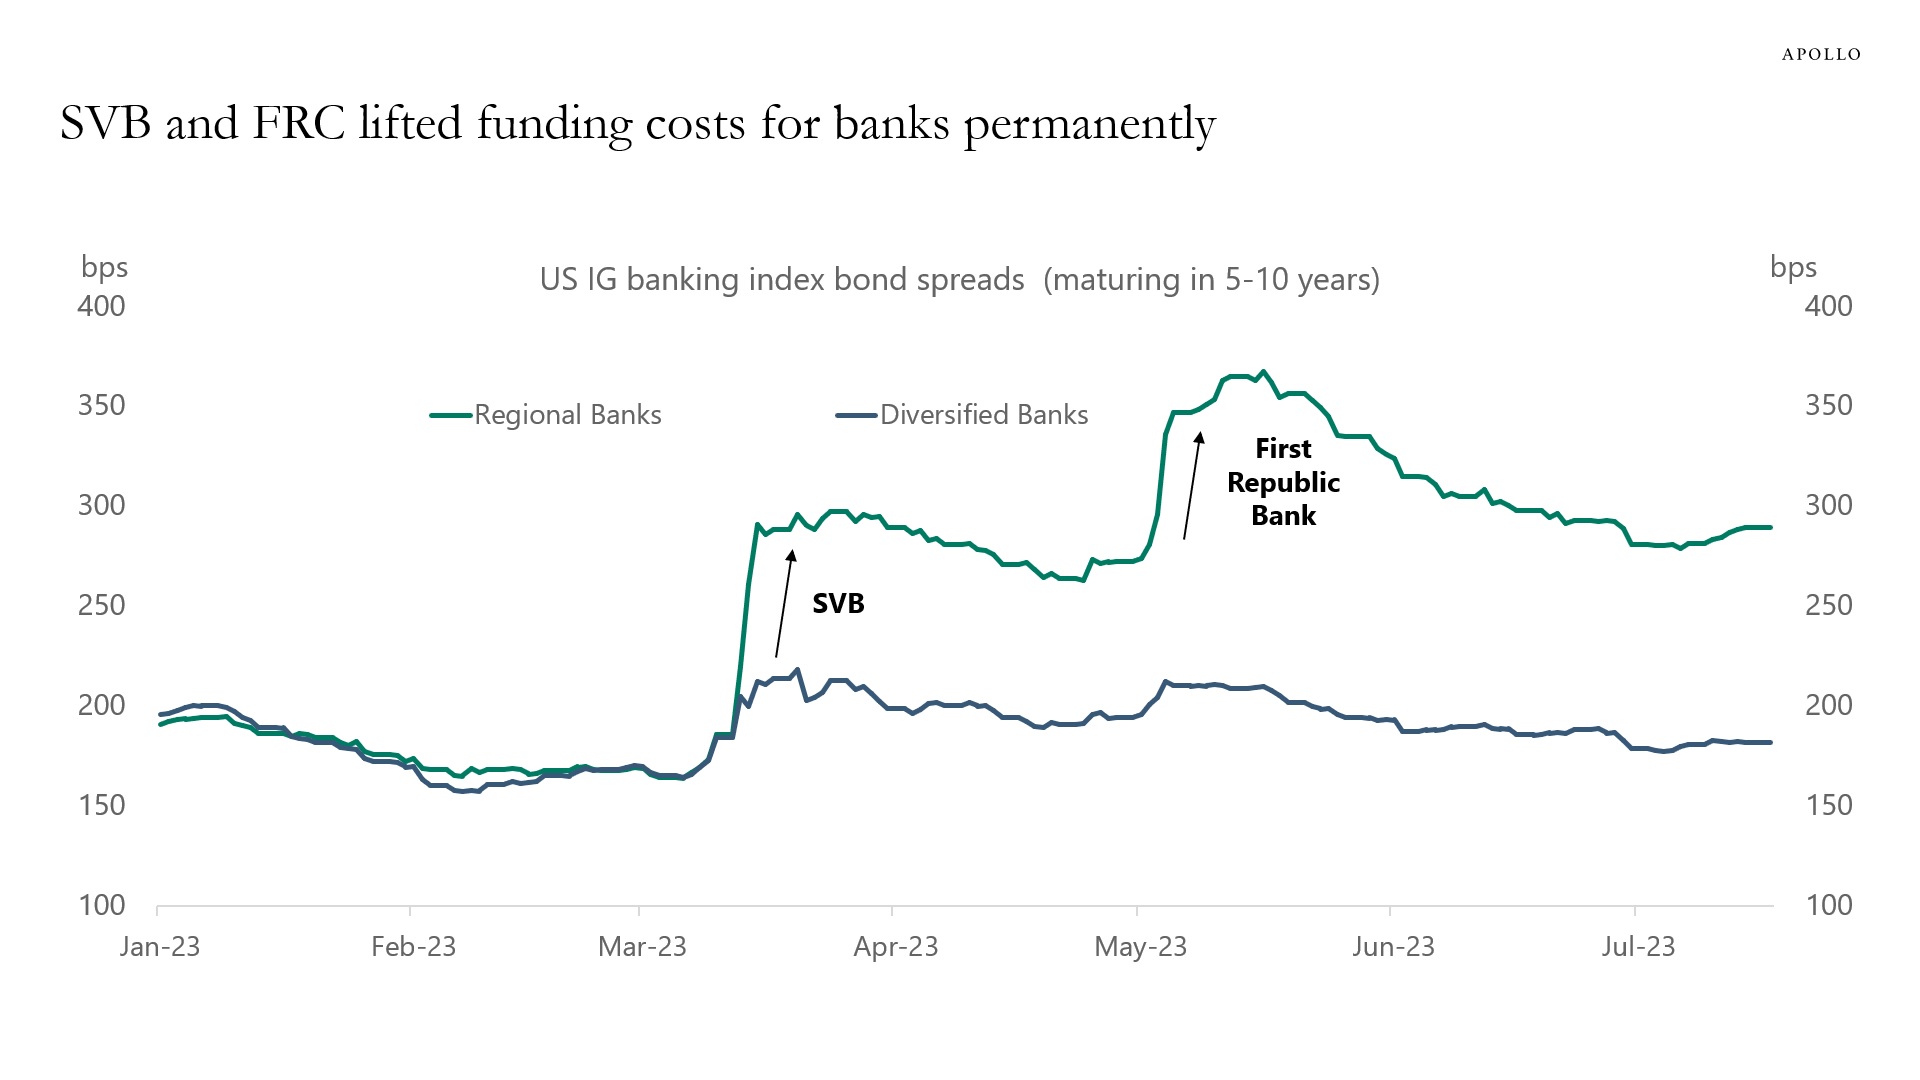
Source: ICE BofA, Bloomberg, Apollo Chief Economist. Note: Unweighted average spreads of bonds from ICE 5-10 Year US Banking Index, C6PX Index for bonds issued before 1st Jan 2023. There are 8 banks in the Regional index and 41 banks in the Diversified index, and Regional banks include BankUnited, Citizens Financial, Huntington, and Zions, and Diversified banks include JP Morgan, Citibank, and Bank of America. 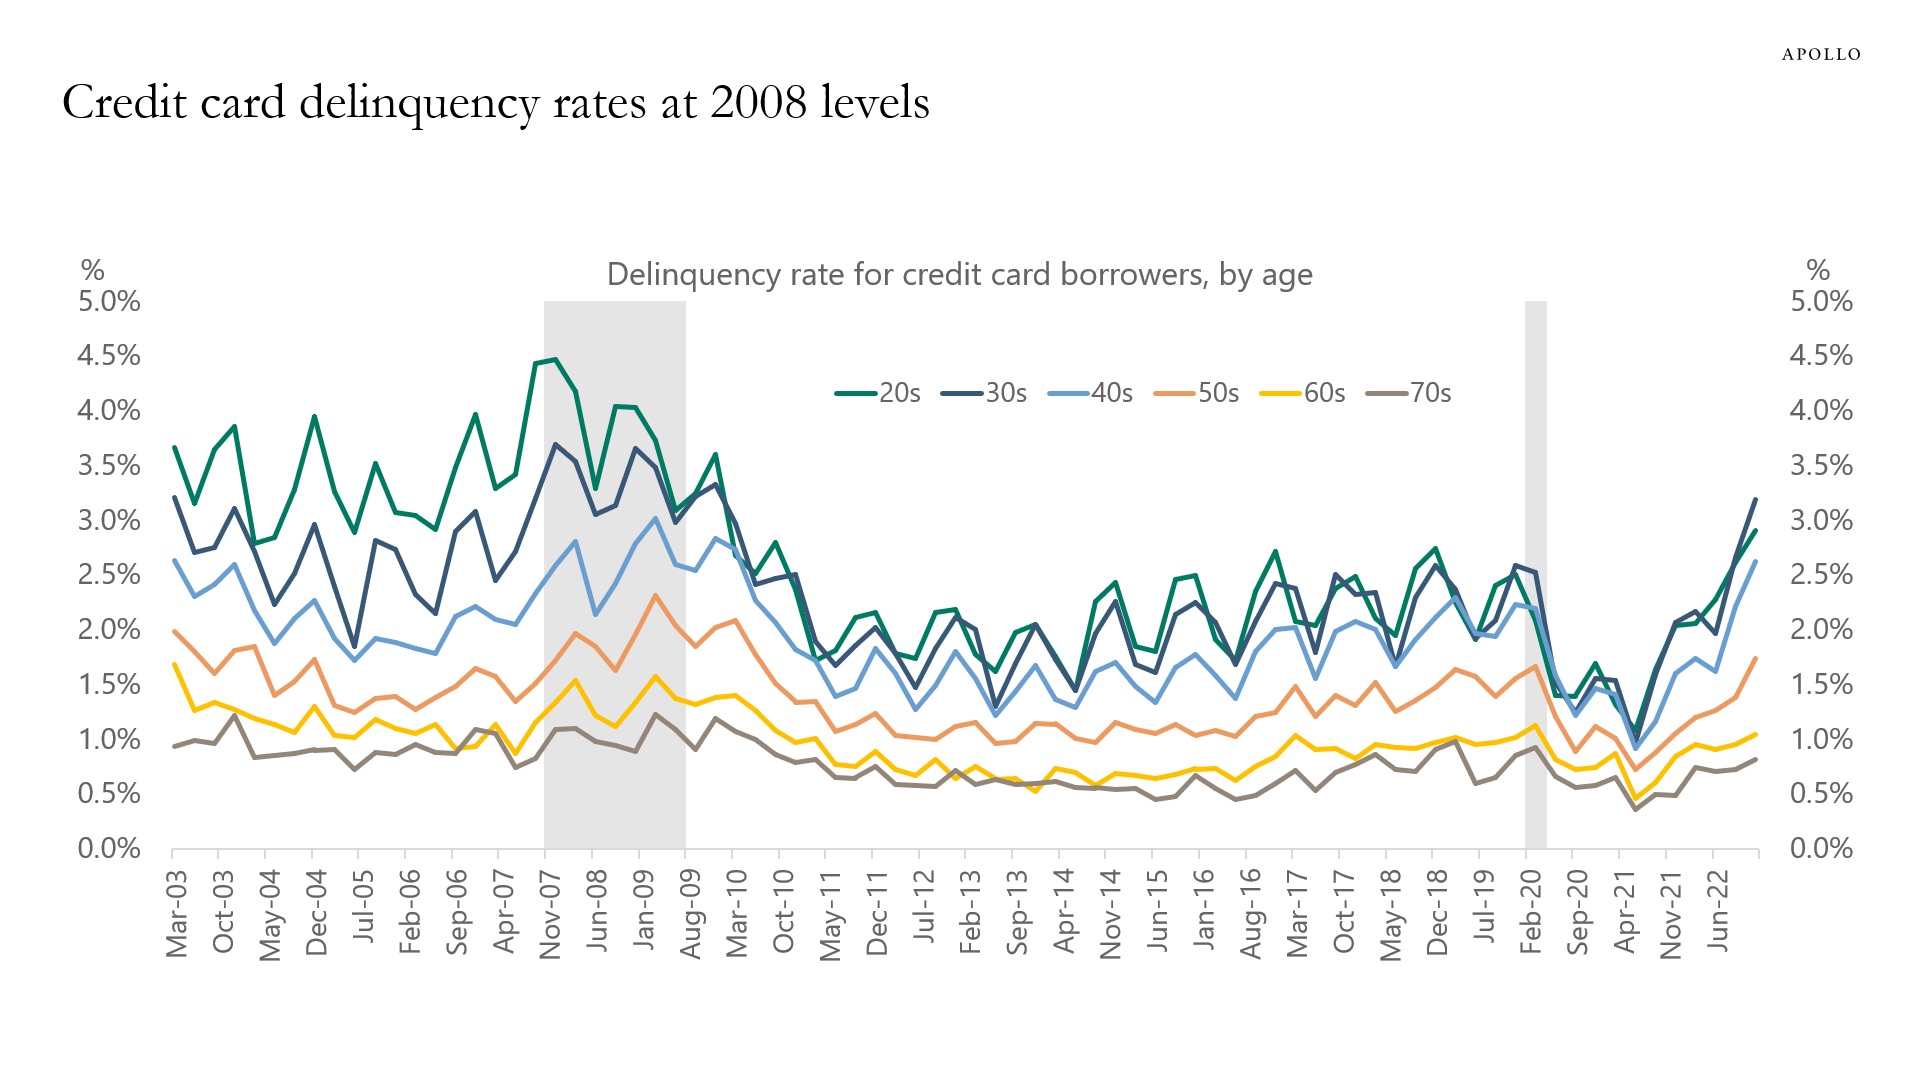
Source: New York Fed Consumer Credit Panel / Equifax, Apollo Chief Economist 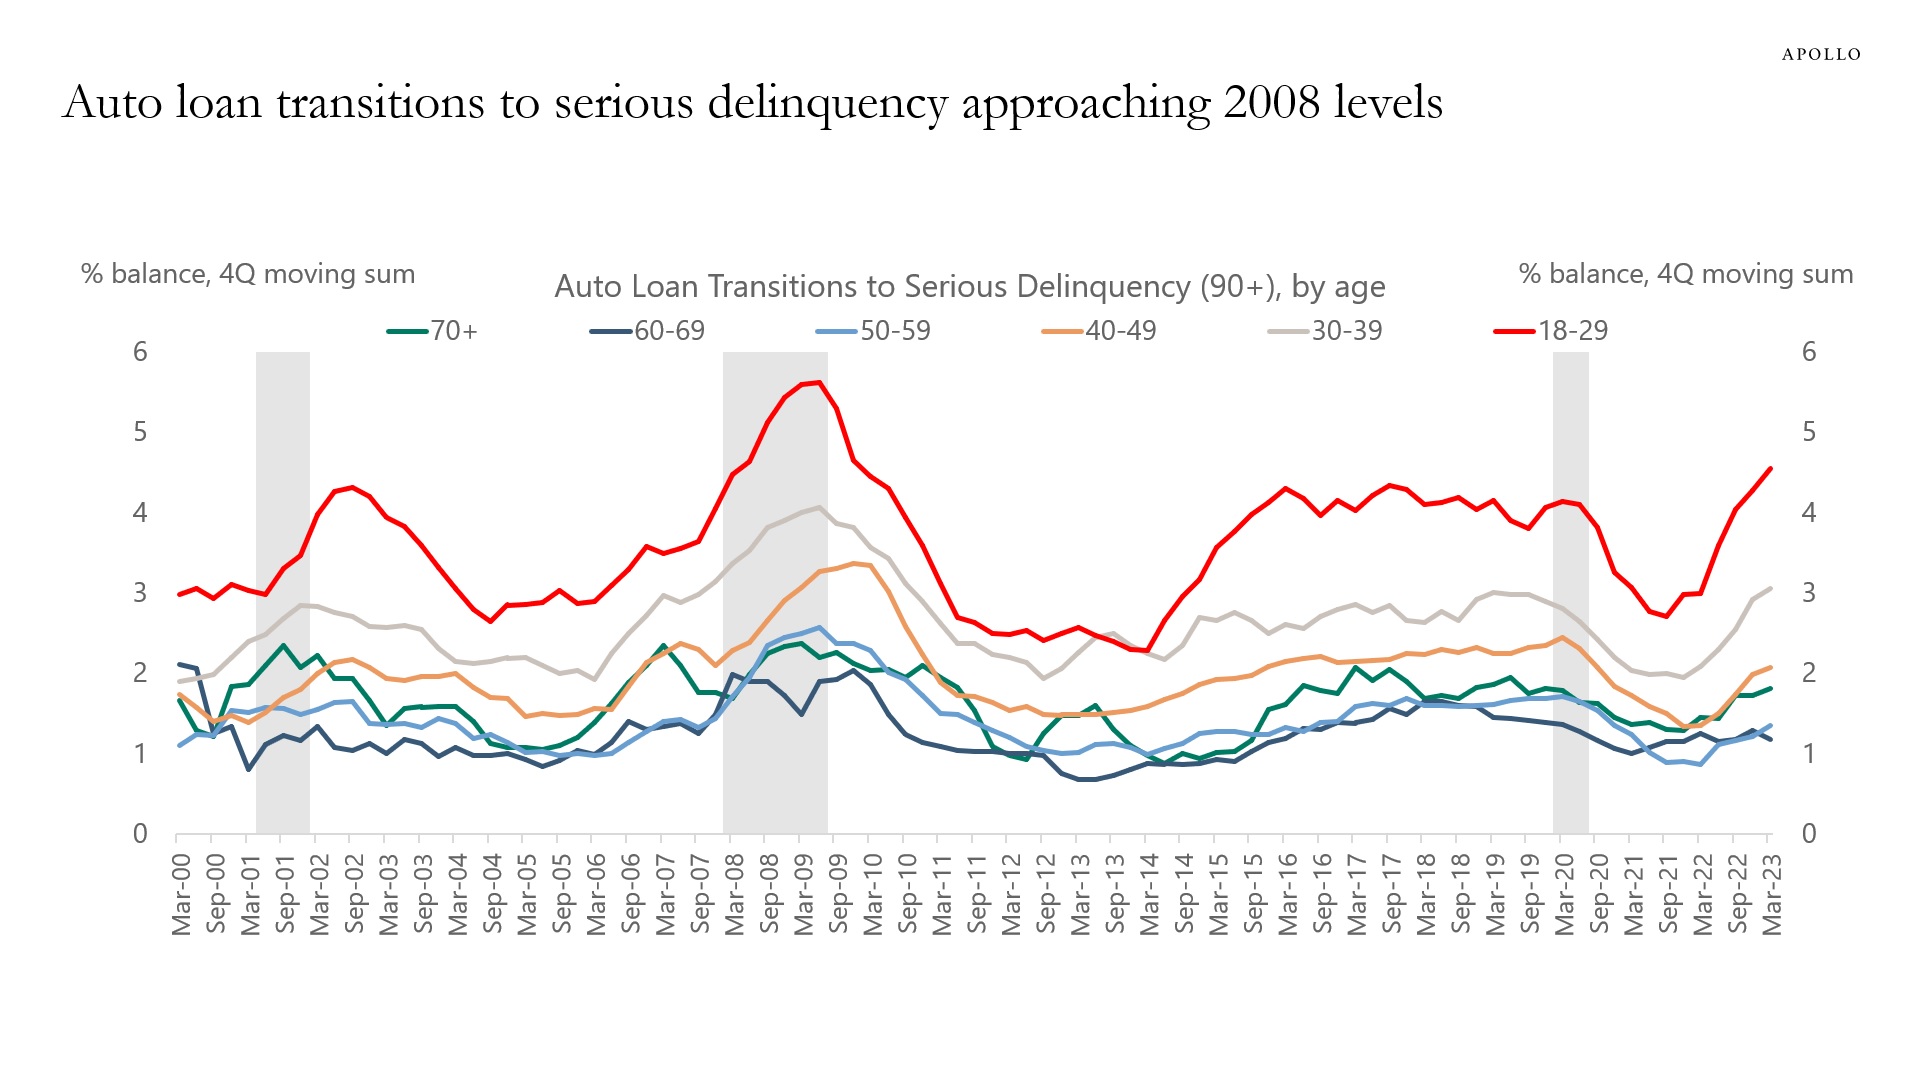
Source: FRBNY Consumer Credit Panel, Equifax, Haver Analytics, Apollo Chief Economist 
Source: FRB, Bloomberg, Apollo Chief Economist 
Source: FRB, Haver Analytics, Apollo Chief Economist 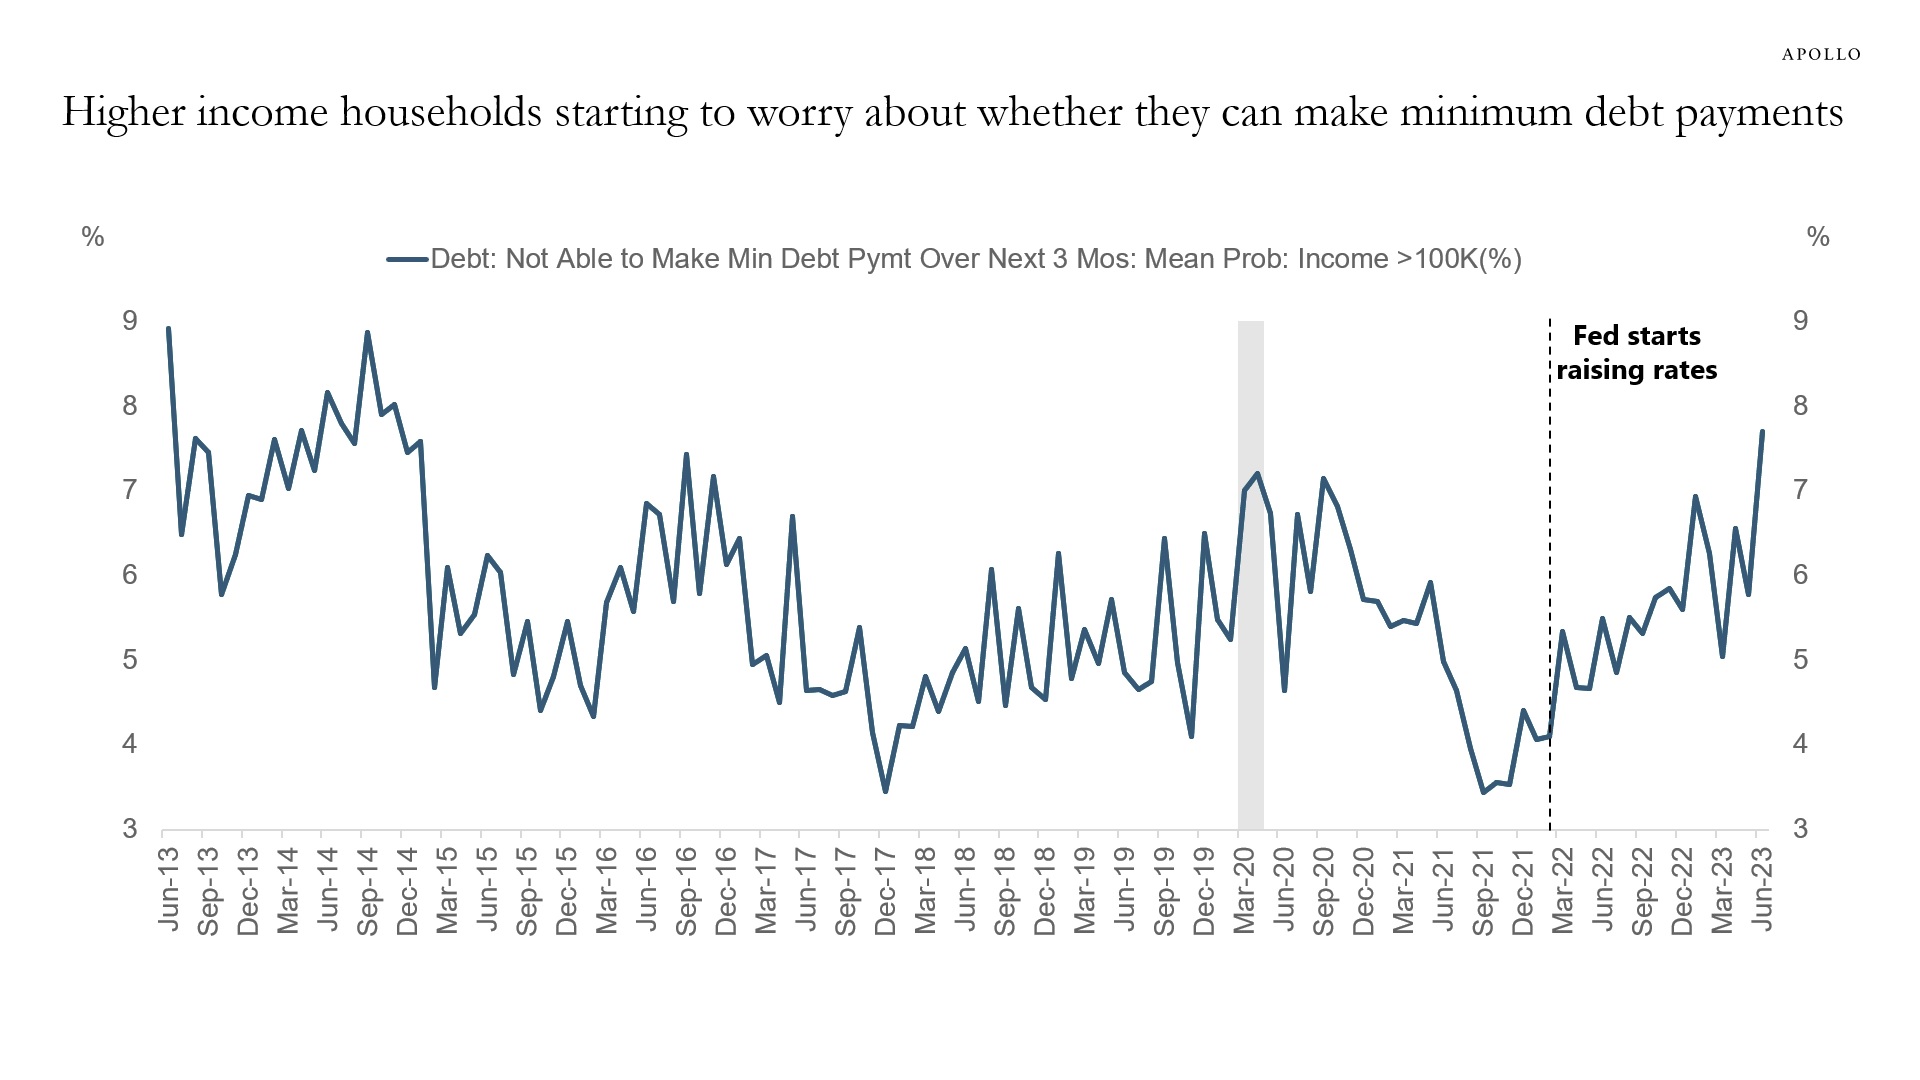
Source: FRBNY, Haver Analytics, Apollo Chief Economist. Note: The data shows the average probability of not being able to make minimum debt payment over the next three months for people earning (income) greater than $100K. 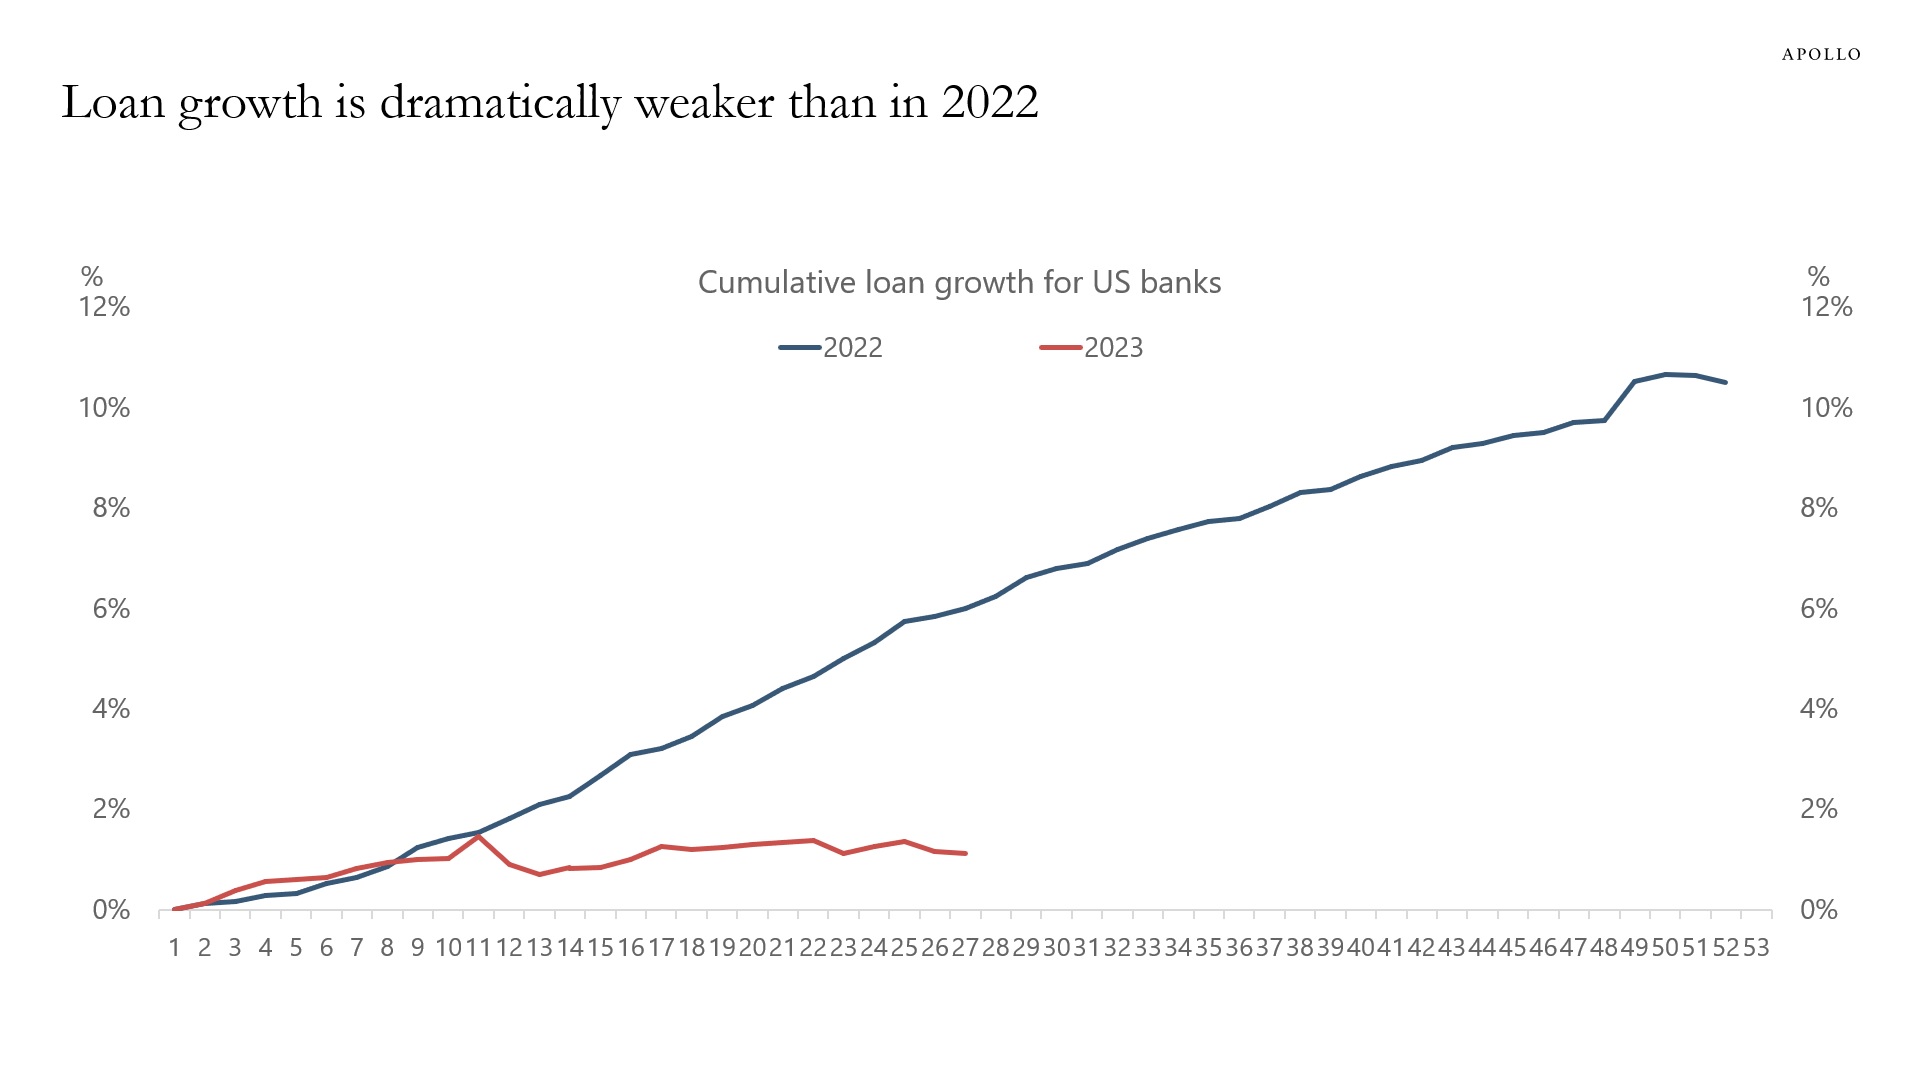
Source: FRB, Bloomberg, Apollo Chief Economist. X-axis represents weeks of year. 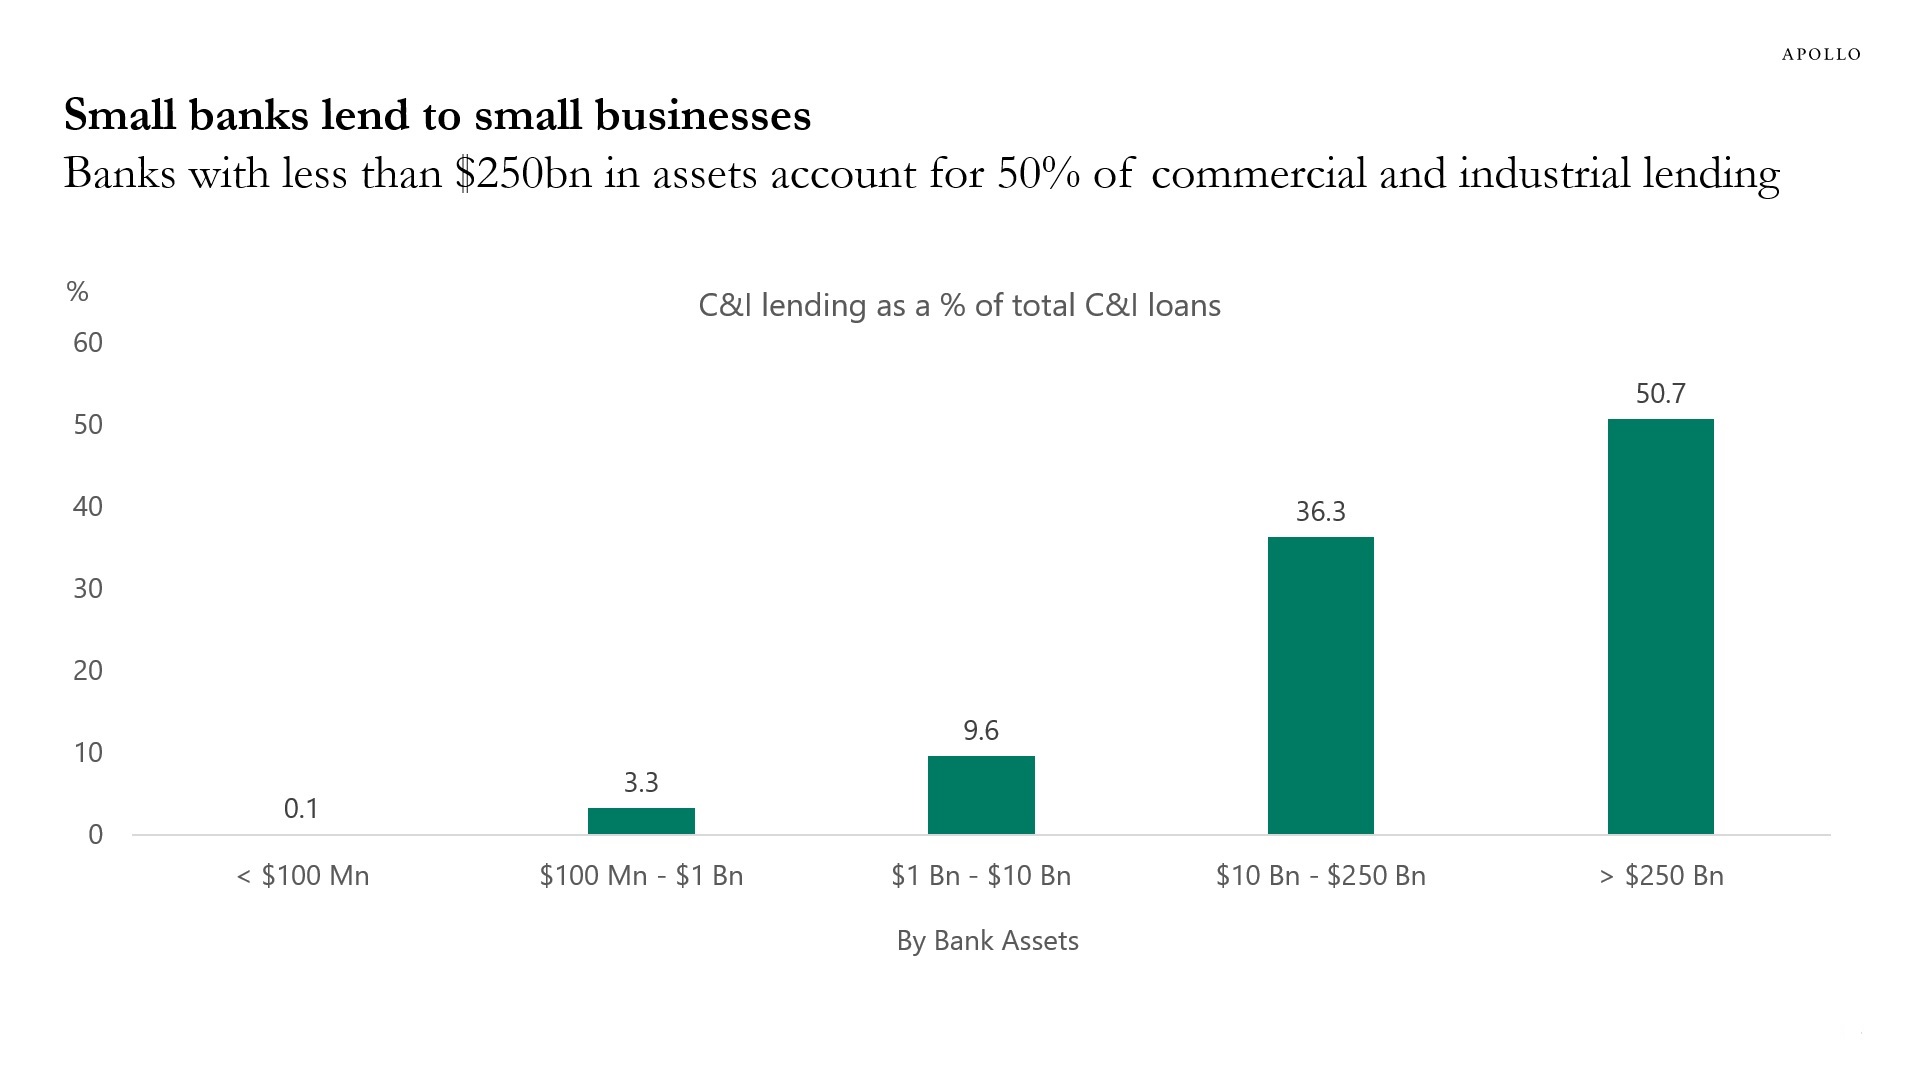
Source: FDIC, Apollo Chief Economist. Data as of Q3 2022. 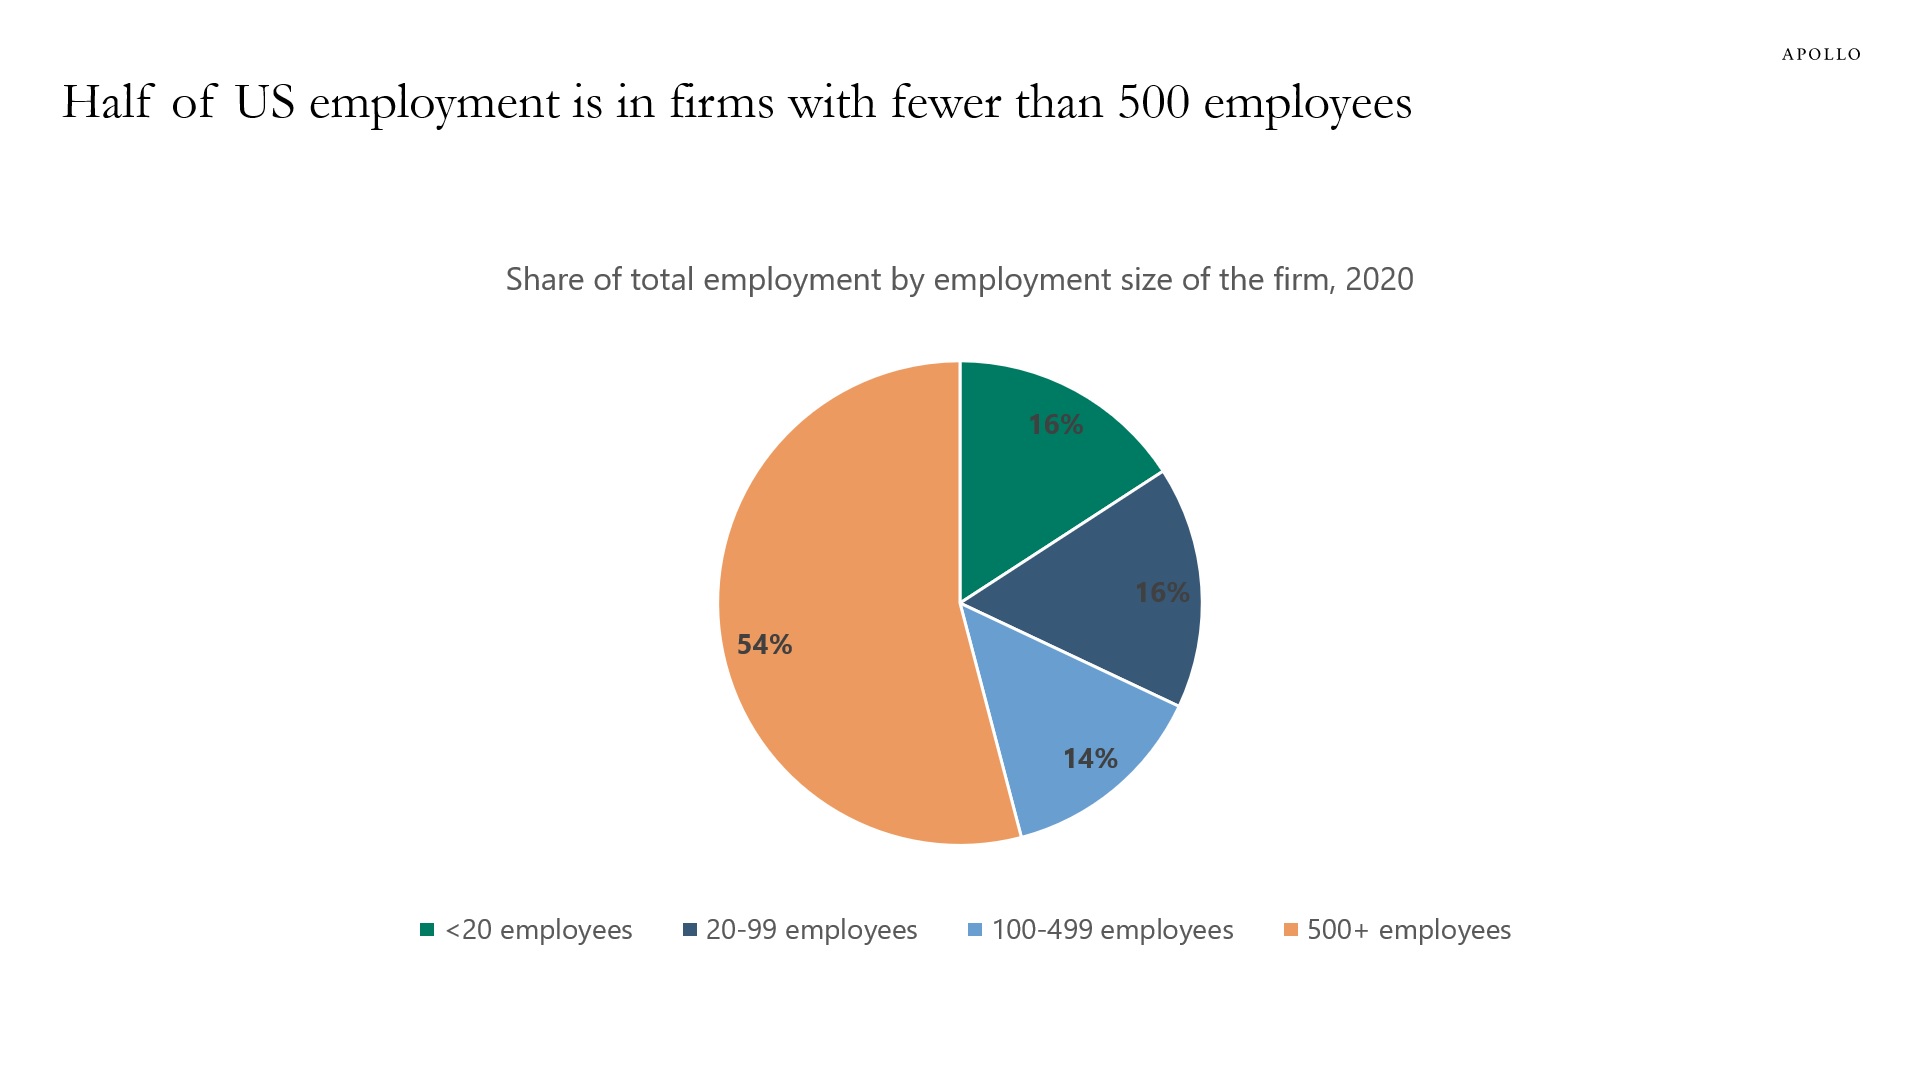
Source: Census, Apollo Chief Economist See important disclaimers at the bottom of the page.

This presentation may not be distributed, transmitted or otherwise communicated to others in whole or in part without the express consent of Apollo Global Management, Inc. (together with its subsidiaries, “Apollo”).
Apollo makes no representation or warranty, expressed or implied, with respect to the accuracy, reasonableness, or completeness of any of the statements made during this presentation, including, but not limited to, statements obtained from third parties. Opinions, estimates and projections constitute the current judgment of the speaker as of the date indicated. They do not necessarily reflect the views and opinions of Apollo and are subject to change at any time without notice. Apollo does not have any responsibility to update this presentation to account for such changes. There can be no assurance that any trends discussed during this presentation will continue.
Statements made throughout this presentation are not intended to provide, and should not be relied upon for, accounting, legal or tax advice and do not constitute an investment recommendation or investment advice. Investors should make an independent investigation of the information discussed during this presentation, including consulting their tax, legal, accounting or other advisors about such information. Apollo does not act for you and is not responsible for providing you with the protections afforded to its clients. This presentation does not constitute an offer to sell, or the solicitation of an offer to buy, any security, product or service, including interest in any investment product or fund or account managed or advised by Apollo.
Certain statements made throughout this presentation may be “forward-looking” in nature. Due to various risks and uncertainties, actual events or results may differ materially from those reflected or contemplated in such forward-looking information. As such, undue reliance should not be placed on such statements. Forward-looking statements may be identified by the use of terminology including, but not limited to, “may”, “will”, “should”, “expect”, “anticipate”, “target”, “project”, “estimate”, “intend”, “continue” or “believe” or the negatives thereof or other variations thereon or comparable terminology.