


Want it delivered daily to your inbox?
-
Consumer spending on goods is significantly higher than before the pandemic, and consumer spending on services is only modestly higher, see chart below.
The implication for markets is that there are still upside risks to consumer spending on services. And hence upside risks to service sector inflation.
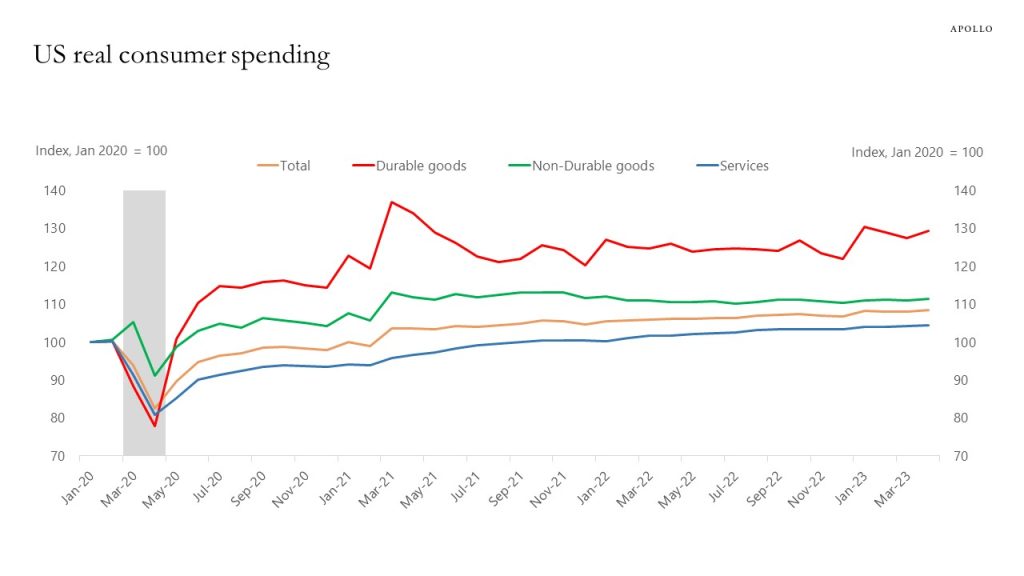
Source: BEA, Haver, Apollo Chief Economist See important disclaimers at the bottom of the page.
-
Goods inflation is coming down and approaching pre-pandemic levels. Service sector inflation is still not showing signs of moving lower, see chart below.
The debate in markets is whether a significant increase in the unemployment rate is needed to get service sector inflation down, and this new Fed paper says that the labor market is not a key driver of service sector inflation.
In other words, there is a risk of inflation becoming more sticky even if the labor market starts weakening.
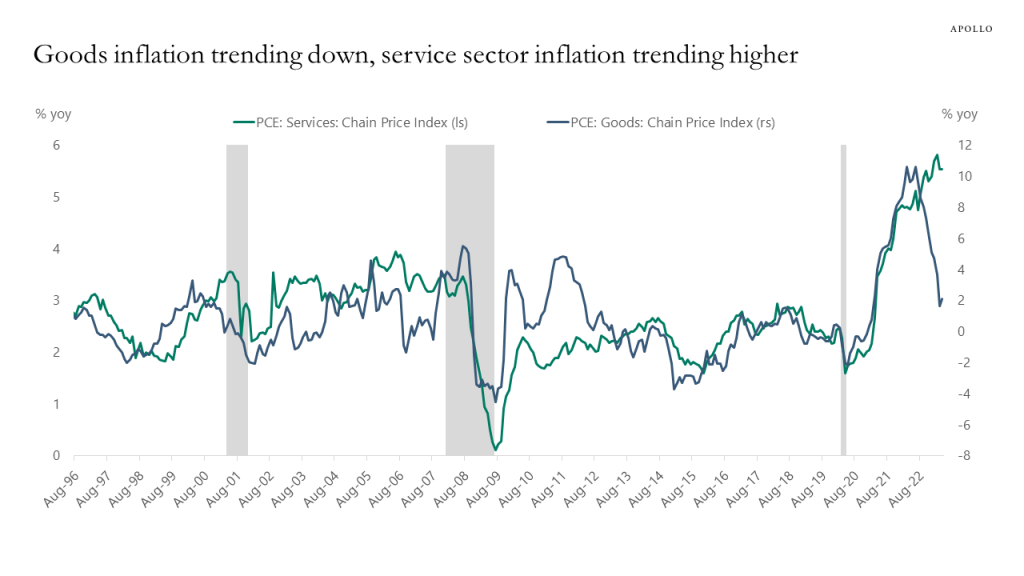
Source: BEA, Haver, Apollo Chief Economist See important disclaimers at the bottom of the page.
-
Inflation has been more sticky than the FOMC expected when they published their latest forecast in March, see chart below.
This argues for higher costs of capital for longer, which increases the probability of a harder landing.
Put differently, sticky inflation requires more demand destruction, which increases the downside risks to corporate earnings.
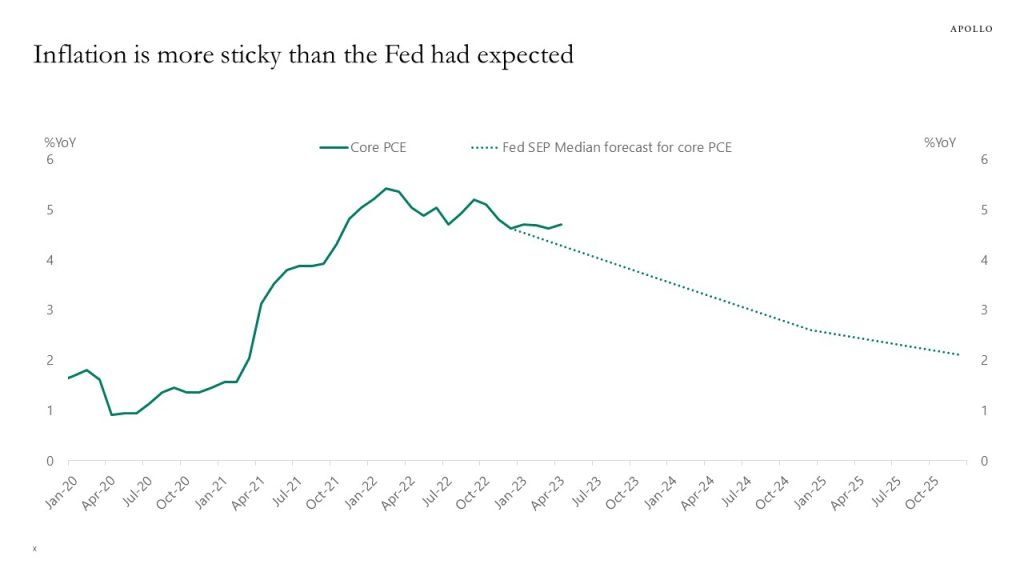
Source: BEA, FRB, Haver Analytics, Apollo Chief Economist See important disclaimers at the bottom of the page.
-
Delinquency rates for credit card borrowers are approaching 2008 levels across all age categories, see chart below.
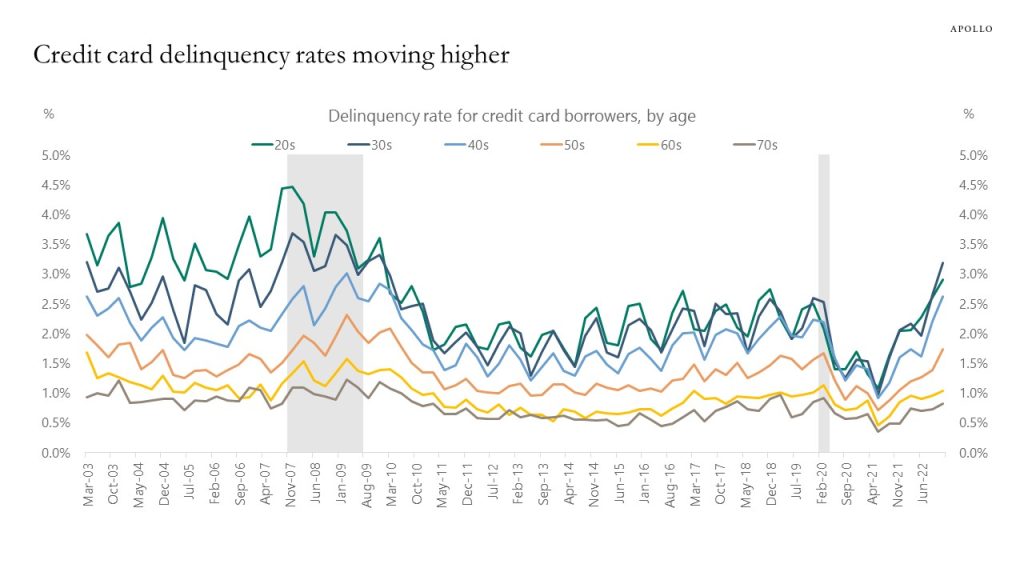
Source: New York Fed Consumer Credit Panel/Equifax, Apollo Chief Economist See important disclaimers at the bottom of the page.
-
As the Fed has been raising rates, US households have been big buyers of US Treasuries, see the first two charts below.
The appetite for Treasuries from foreigners has been more limited because of higher hedging costs. Foreigners have instead increased their holdings of equities by $3 trillion during the pandemic, see the third chart.
With a 5% budget deficit combined with QT and the Treasury’s need to replenish cash in the Treasury General Account, markets will soon begin to focus on who will be buyers of US government debt.
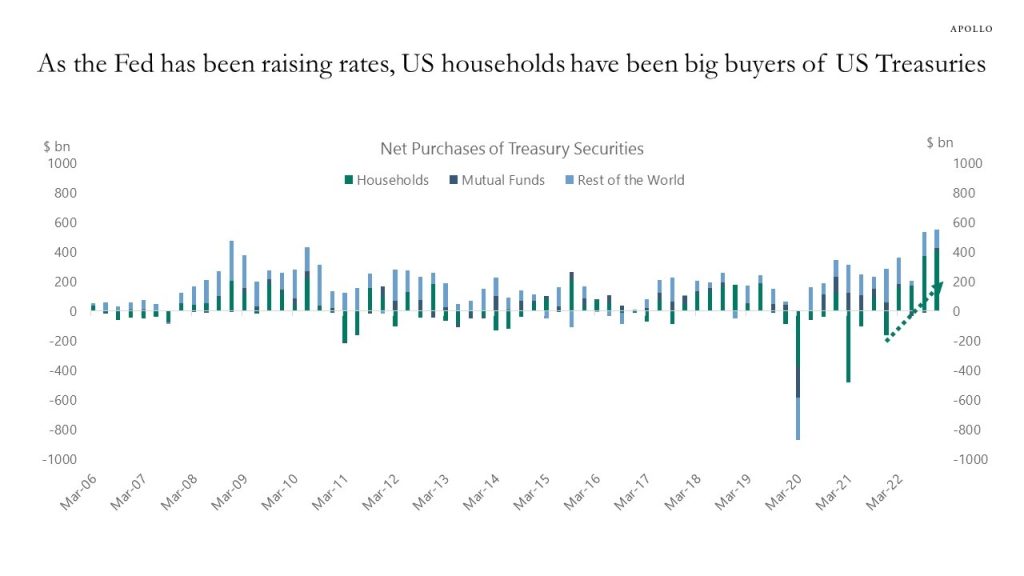
Source: FFUNDS, Haver, Apollo Chief Economist 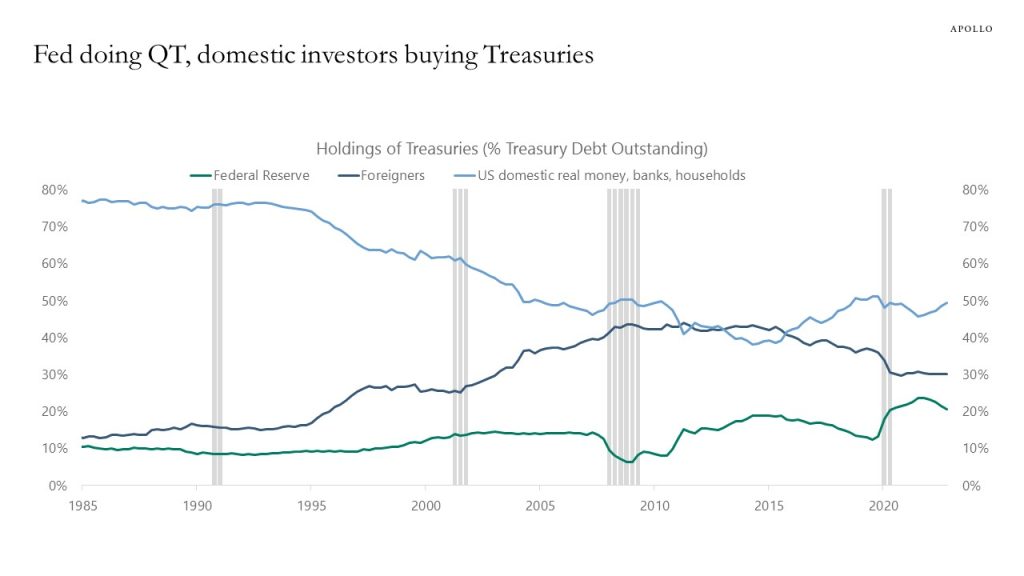
Source: FFUNDS, Haver, Apollo Chief Economist 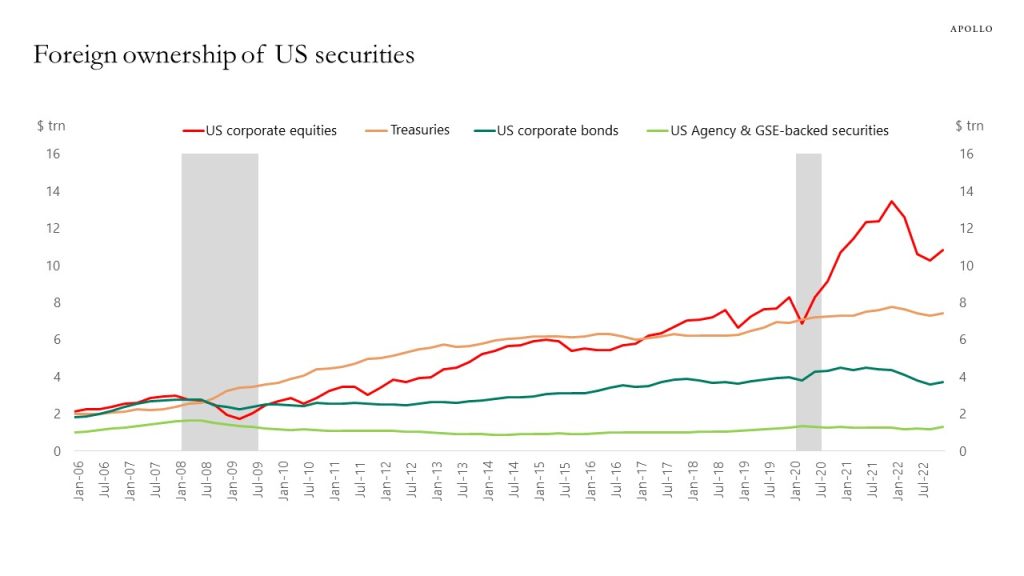
Source: FRB, Haver, Apollo Chief Economist See important disclaimers at the bottom of the page.
-
Indicators of restaurant activity are starting to show signs of weakness, see charts below. This is important because consumer services have so far been quite strong.
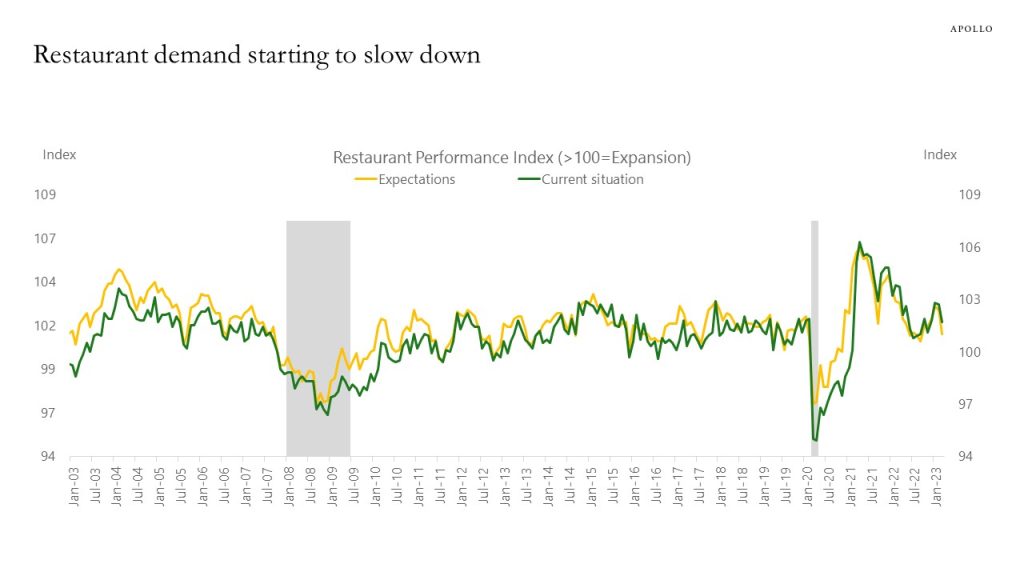
Source: National Restaurant Association, Haver, Apollo Chief Economist 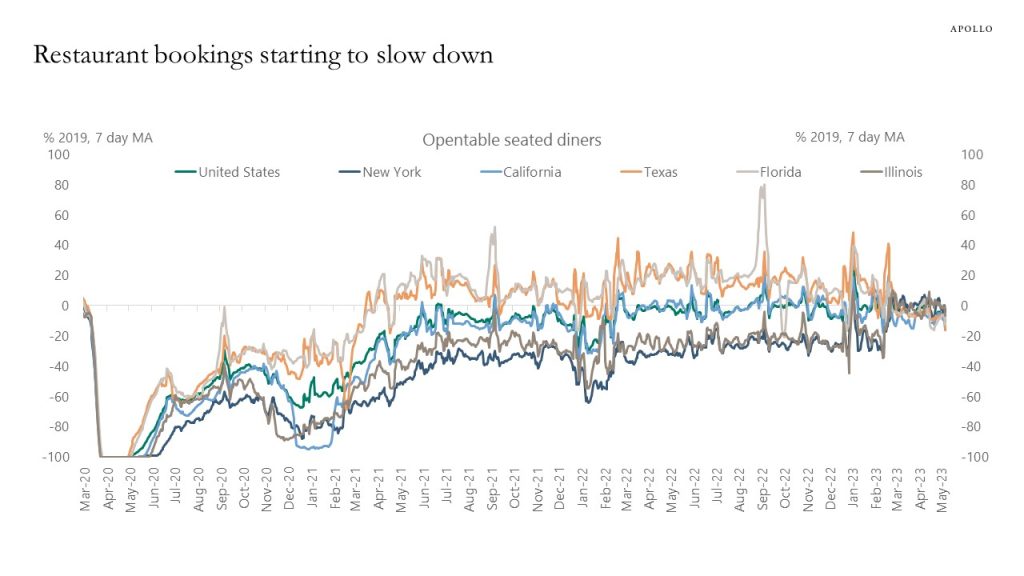
Source: OpenTable, Apollo Chief Economist See important disclaimers at the bottom of the page.
-
Auto loan transitions to serious delinquency are rising and approaching 2008 levels, in particular for younger borrowers, see chart below.
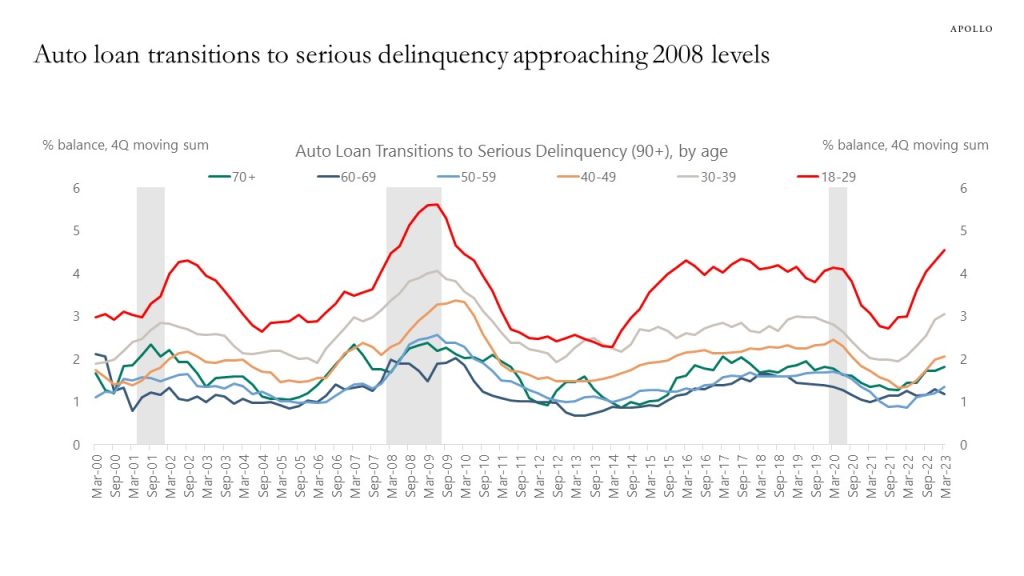
Source: FRBNY Consumer Credit Panel, Equifax, Haver Analytics, Apollo Chief Economist See important disclaimers at the bottom of the page.
-
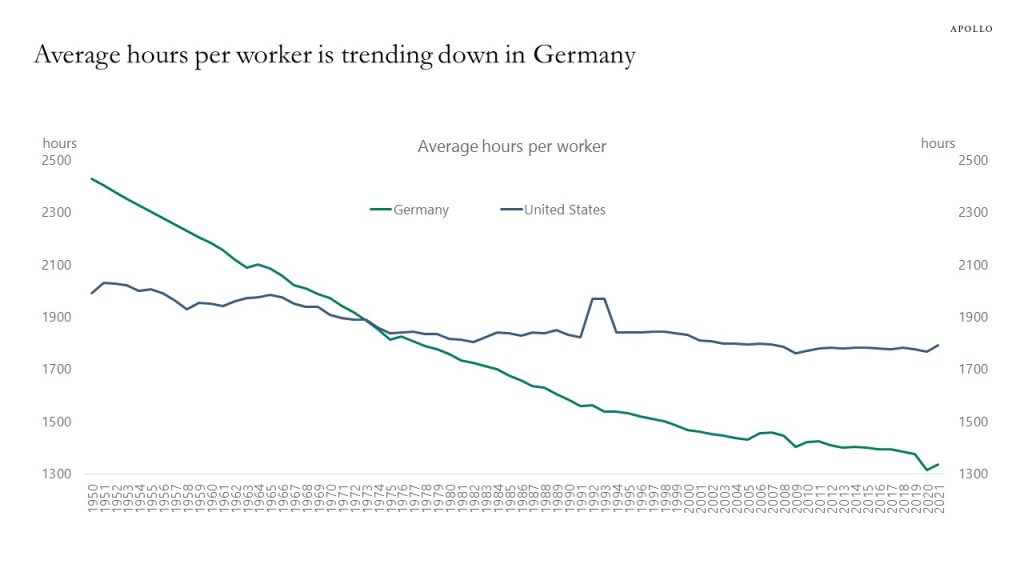
The average number of working hours per year has for decades been declining in Germany and moving sideways in the US, see chart below.
Source: Penn World Tables, OECD, Apollo Chief Economist See important disclaimers at the bottom of the page.
-
Key supply chain indicators are now fully back at 2019 levels, see charts below and in this presentation.
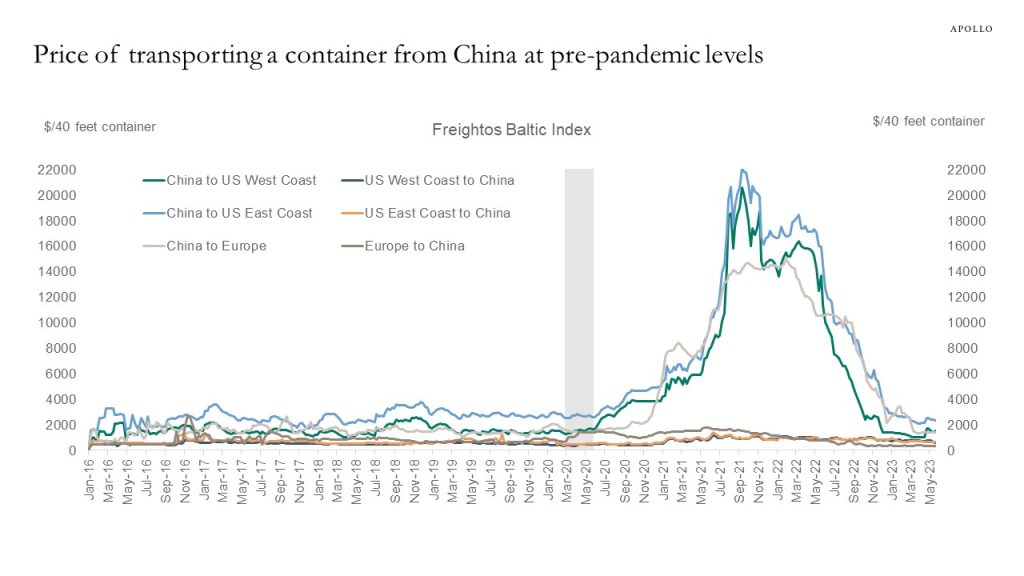
Source: Freightos, Bloomberg, Apollo Chief Economist 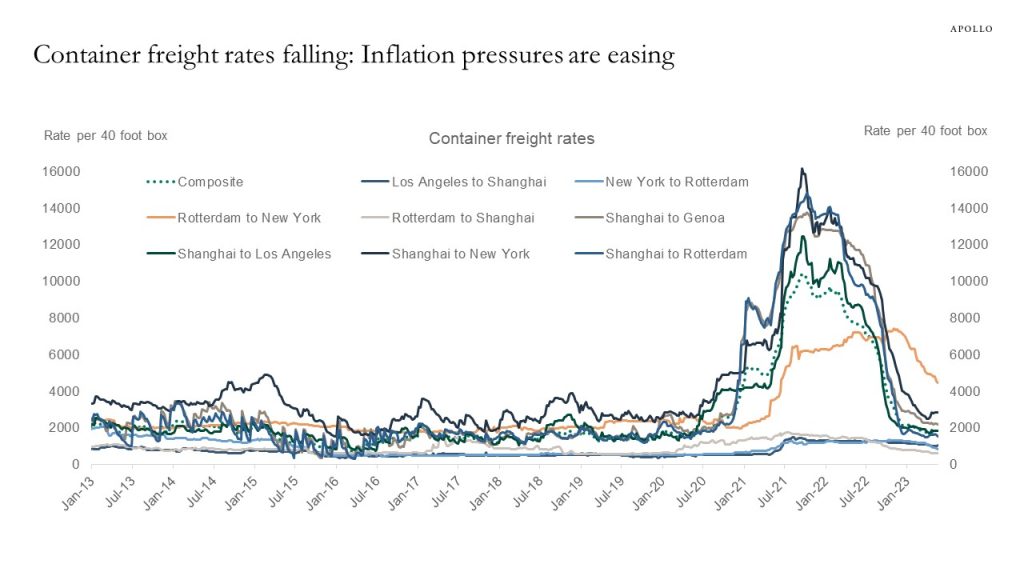
Source: WCI, Bloomberg, Apollo Chief Economist 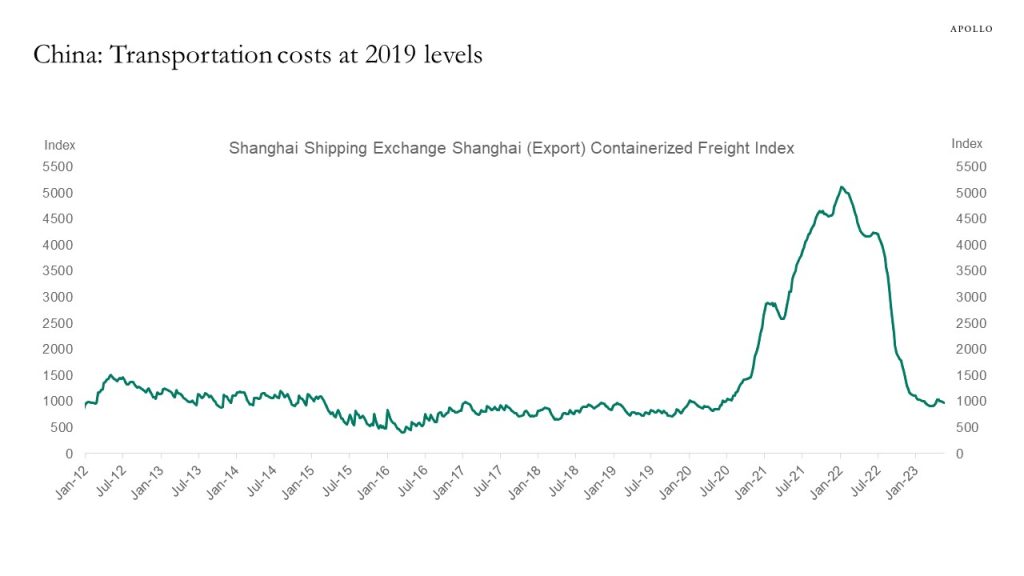
Source: Shanghai Shipping Exchange, Bloomberg, Apollo Chief Economist 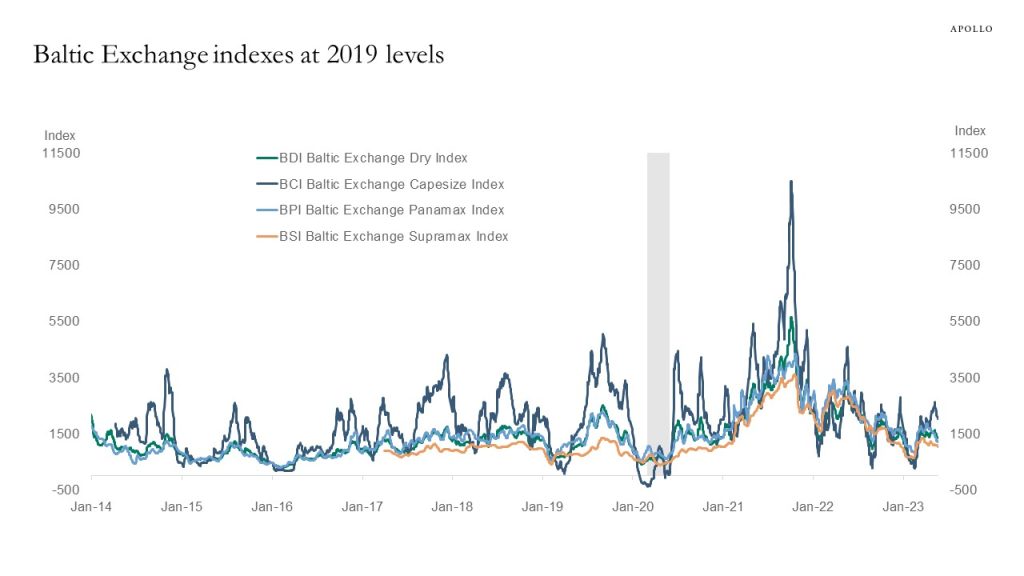
Source: Bloomberg, Apollo Chief Economist 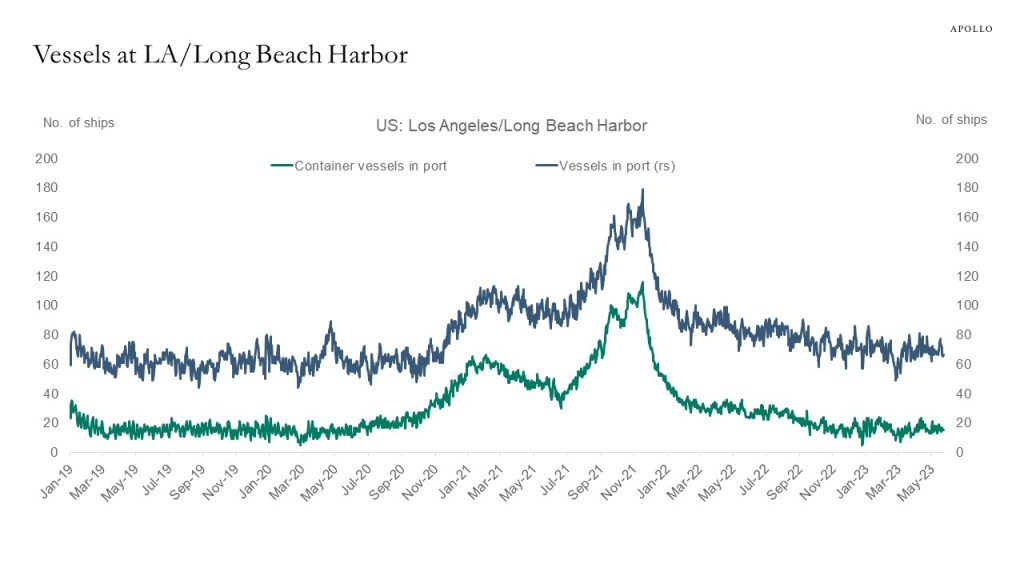
Source: The Marine Exchange of Los Angeles and Long Beach Harbors, Haver, Apollo Chief Economist 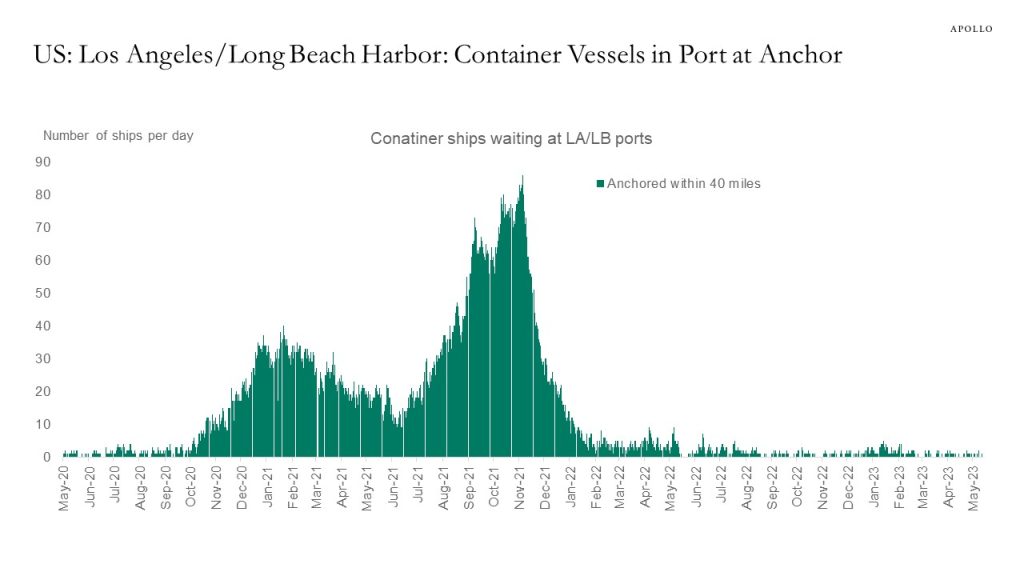
Source: Haver, Apollo Chief Economist 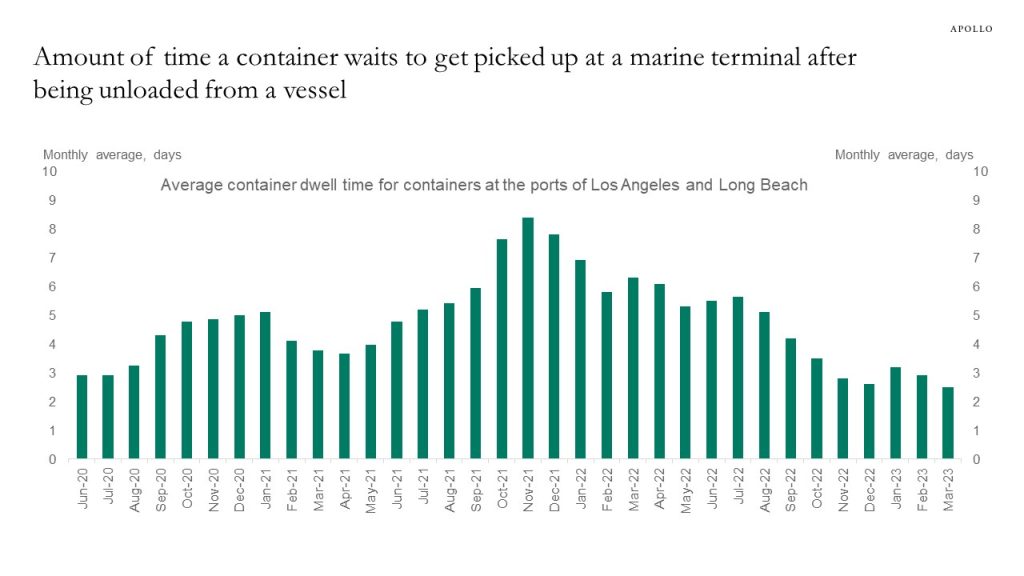
Source: Pacific Merchant Shipping Association, Apollo Chief Economist 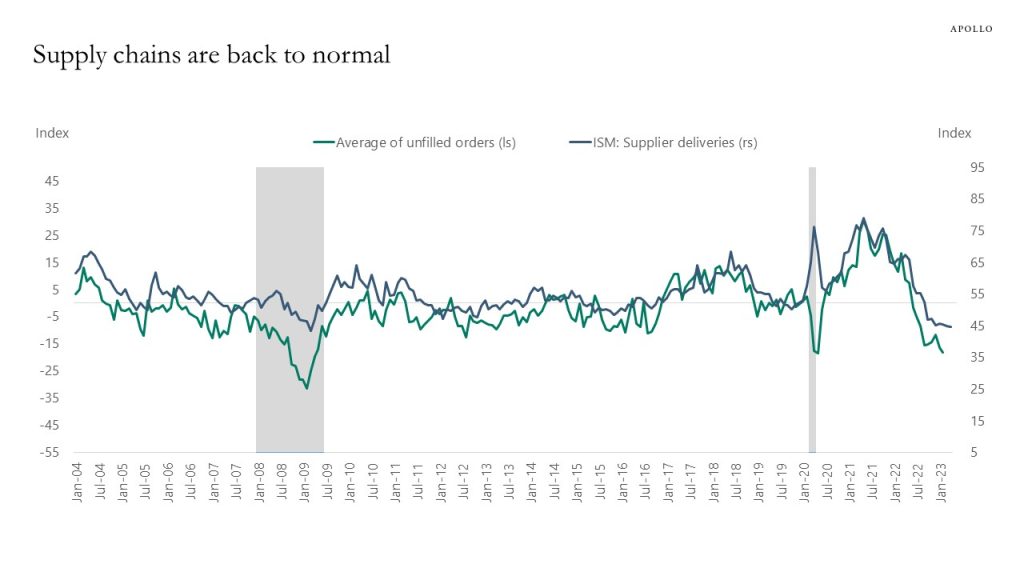
Source: Haver, Apollo Chief Economist (Note: Average of unfilled orders is average of Richmond Fed Mfg Survey: Current Manufacturing Order Backlogs, Philly Fed Mfg Business Outlook: Current Unfilled Orders, Empire State Mfg Survey: Delivery Time) 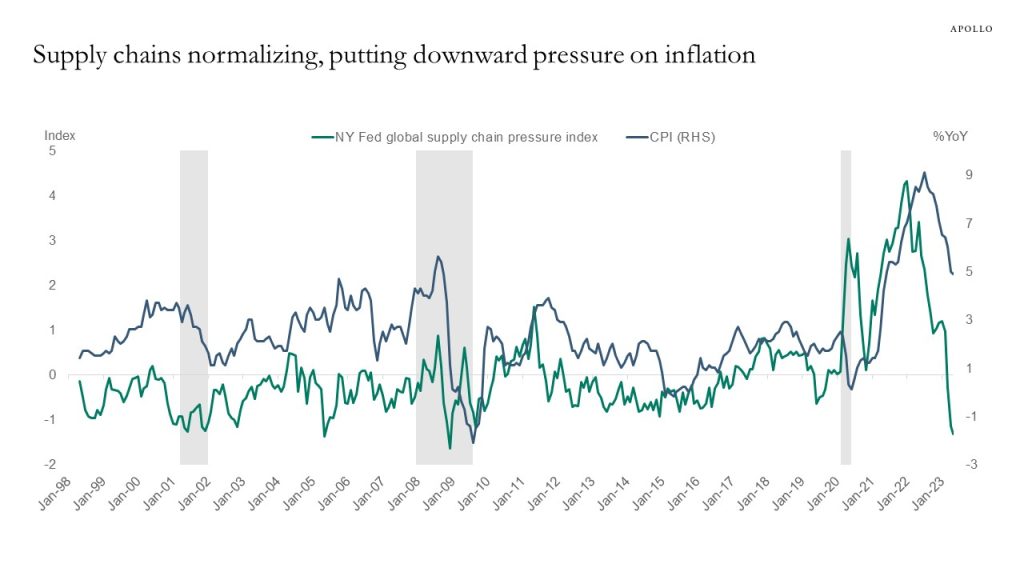
Source: NY Fed, BLS, Haver Analytics, Apollo Chief Economist See important disclaimers at the bottom of the page.
-
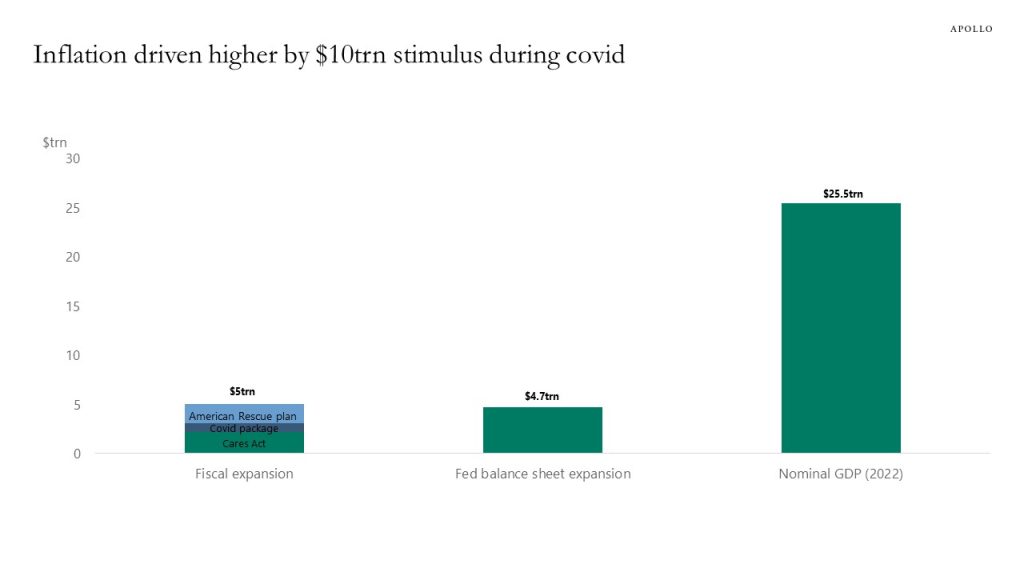
There is an ongoing debate about whether the current high levels of inflation are the result of aggressive monetary and fiscal policy or supply chain problems and lower labor supply.
A straightforward way to analyze this question is to look at what happened to aggregate demand and aggregate supply during covid.
Demand: The size of the fiscal and monetary policy response to covid at $10trn was very significant, or about 40% of 2022 GDP, see the first chart. The magnitude of these numbers suggests that demand is playing a key role as a driver of inflation.
Supply: The CBO estimates that the covid shock, combined with the fiscal and monetary response, has increased the overall capacity of the US economy, see the second chart which shows that the CBO’s current estimate of potential GDP in 2023 is higher than the estimate for potential GDP in 2023 they had in 2019. In other words, the covid shock did not lower the capacity of the US economy.
The bottom line is that while supply chain problems initially boosted inflation, the current high level of inflation is the result of easy money and fiscal policy, not because of a decline in the capacity of the US economy.
Source: FRB, BEA, Haver Analytics, Apollo Chief Economist 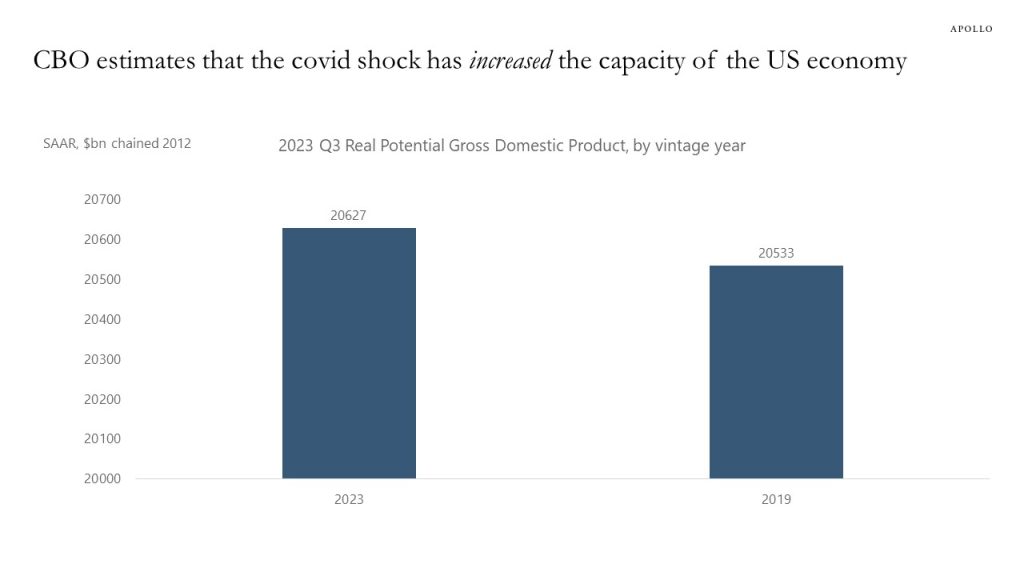
Source: CBO, Haver Analytics, Apollo Chief Economist See important disclaimers at the bottom of the page.

This presentation may not be distributed, transmitted or otherwise communicated to others in whole or in part without the express consent of Apollo Global Management, Inc. (together with its subsidiaries, “Apollo”).
Apollo makes no representation or warranty, expressed or implied, with respect to the accuracy, reasonableness, or completeness of any of the statements made during this presentation, including, but not limited to, statements obtained from third parties. Opinions, estimates and projections constitute the current judgment of the speaker as of the date indicated. They do not necessarily reflect the views and opinions of Apollo and are subject to change at any time without notice. Apollo does not have any responsibility to update this presentation to account for such changes. There can be no assurance that any trends discussed during this presentation will continue.
Statements made throughout this presentation are not intended to provide, and should not be relied upon for, accounting, legal or tax advice and do not constitute an investment recommendation or investment advice. Investors should make an independent investigation of the information discussed during this presentation, including consulting their tax, legal, accounting or other advisors about such information. Apollo does not act for you and is not responsible for providing you with the protections afforded to its clients. This presentation does not constitute an offer to sell, or the solicitation of an offer to buy, any security, product or service, including interest in any investment product or fund or account managed or advised by Apollo.
Certain statements made throughout this presentation may be “forward-looking” in nature. Due to various risks and uncertainties, actual events or results may differ materially from those reflected or contemplated in such forward-looking information. As such, undue reliance should not be placed on such statements. Forward-looking statements may be identified by the use of terminology including, but not limited to, “may”, “will”, “should”, “expect”, “anticipate”, “target”, “project”, “estimate”, “intend”, “continue” or “believe” or the negatives thereof or other variations thereon or comparable terminology.