


Want it delivered daily to your inbox?
-
The yield on BBB credit is at the highest levels in 15 years relative to the earnings yield on the S&P500, see chart below.
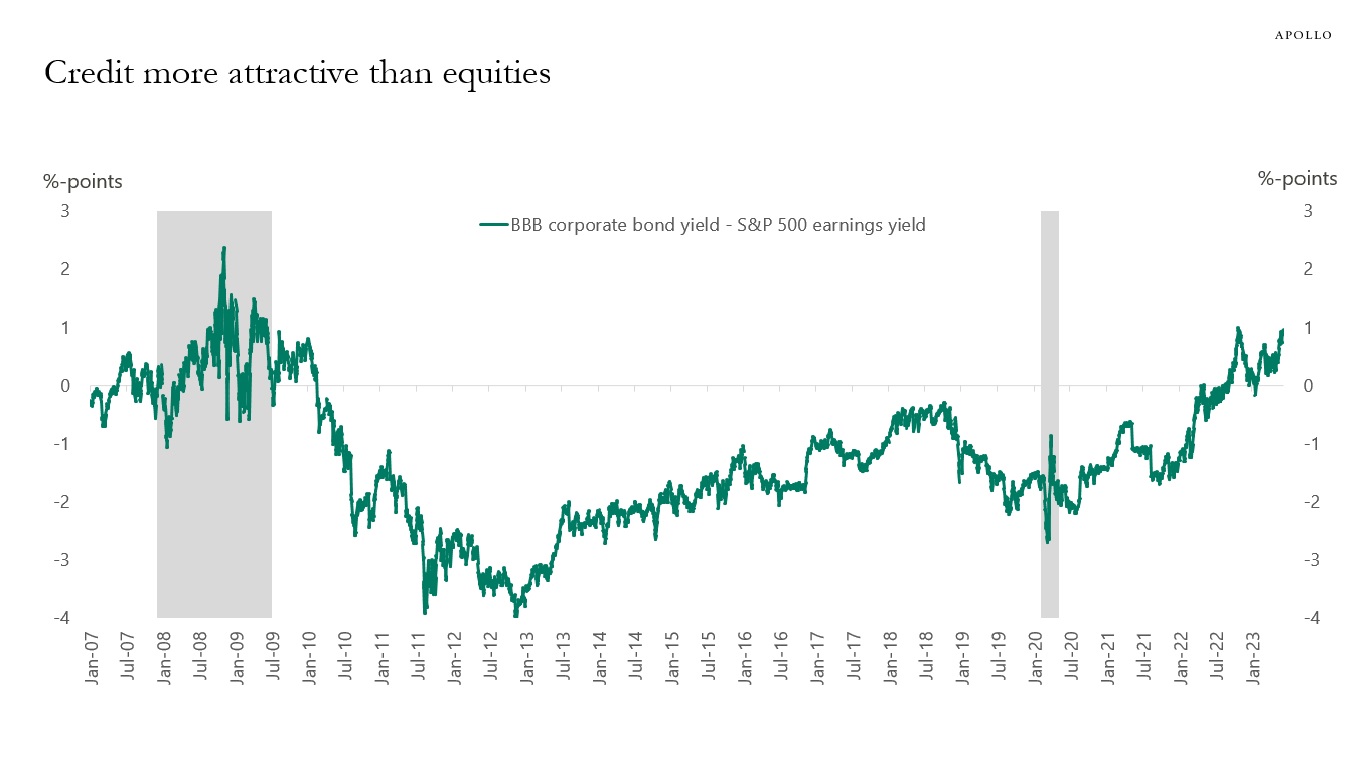
Source: Bloomberg, Apollo Chief Economist See important disclaimers at the bottom of the page.
-
The stock market thinks we have the worst behind us, see chart below, which shows that earnings growth is expected to bottom this quarter and then improve quite rapidly over the coming four quarters.
This forecast will only be correct if core inflation moves quickly down towards 2%. If core inflation remains around 5%, then the Fed will have to put additional downward pressure on demand in the economy and ultimately earnings.
If core inflation remains sticky around 5%, we will likely remain longer in a period with high capital costs and low earnings growth.
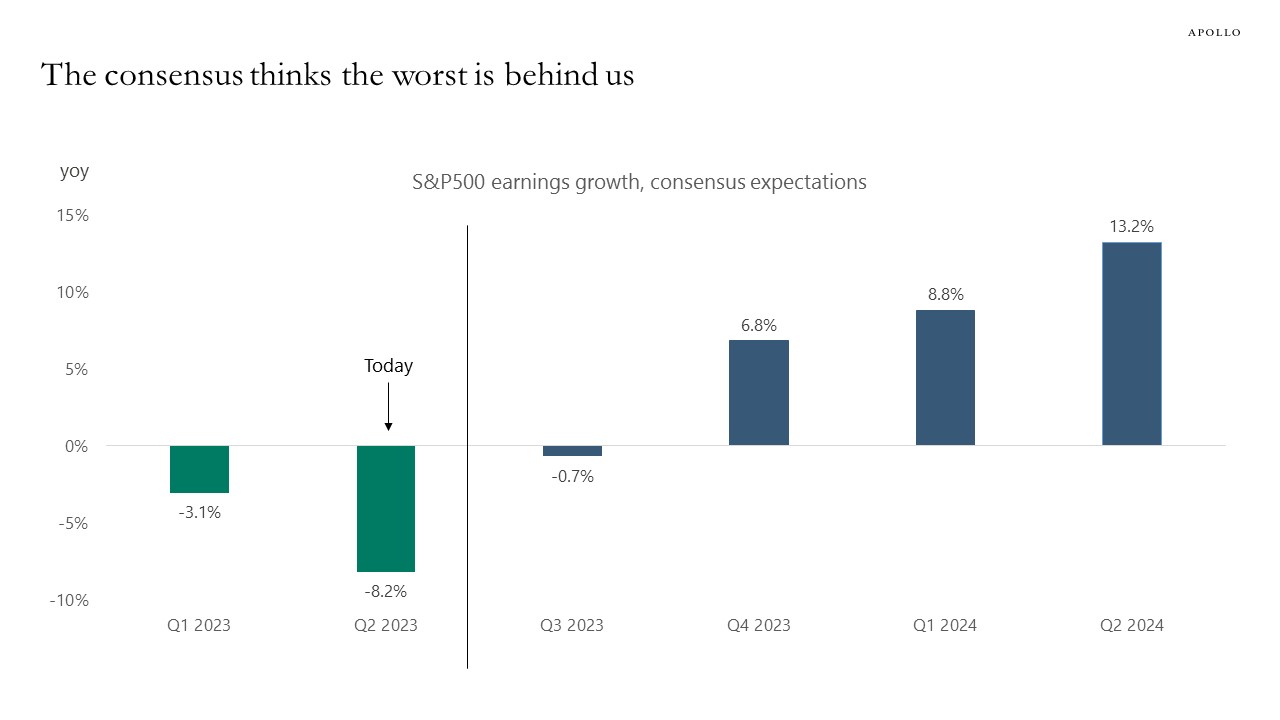
Source: Bloomberg (forecast as of June 9), Apollo Chief Economist See important disclaimers at the bottom of the page.
-
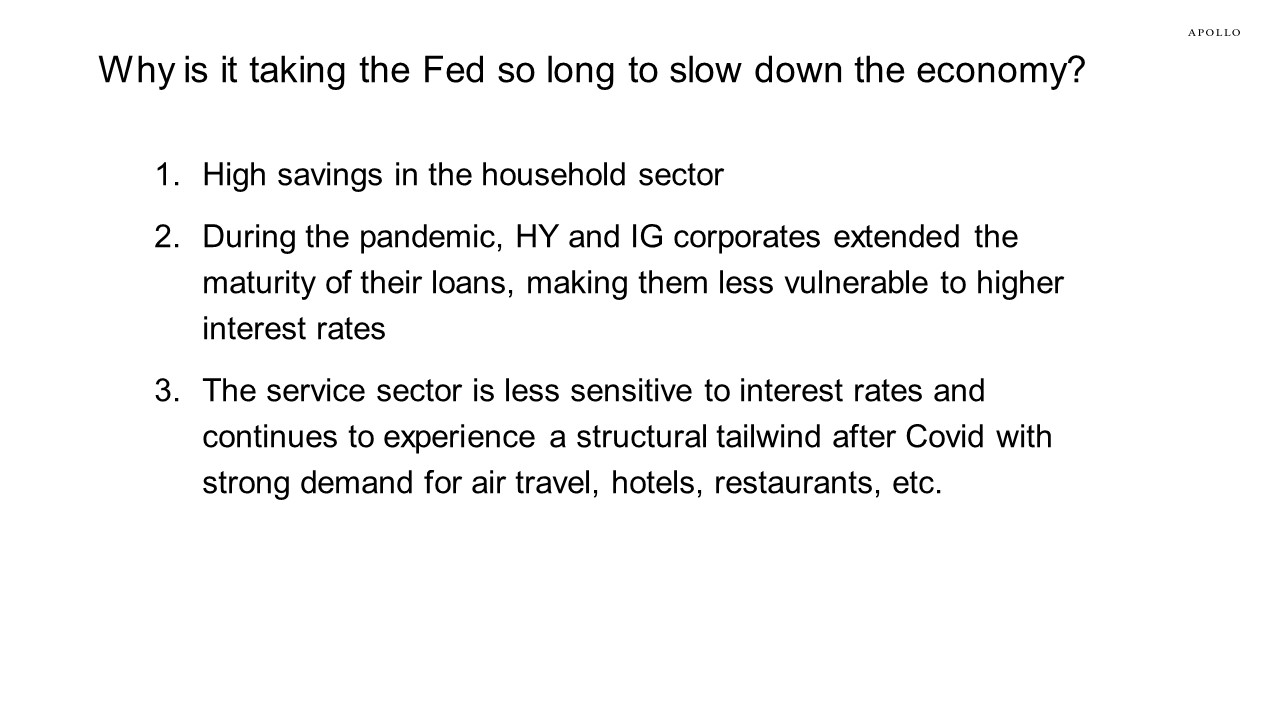
Why is the economy still so strong, and why are Fed hikes not having a bigger negative effect on the economy?
There are three reasons:
1. High savings in the household sector.
2. During the pandemic, IG and HY corporates extended the maturity of their loans, making them less vulnerable to higher rates.
3. The service sector is less sensitive to interest rates and continues to experience a structural tailwind after Covid with strong demand for air travel, hotels, restaurants, etc.
The bottom line is that the weaker transmission mechanism of monetary policy will keep the costs of capital higher for longer because that is what is needed for the Fed to get inflation down from currently 5% to the Fed’s 2% inflation target.
Source: Apollo Chief Economist See important disclaimers at the bottom of the page.
-
Foreigners own about 30% of Japanese equities outstanding, see chart below. Japanese households also hold around 30%, and Japanese pension and insurance only hold 15%.
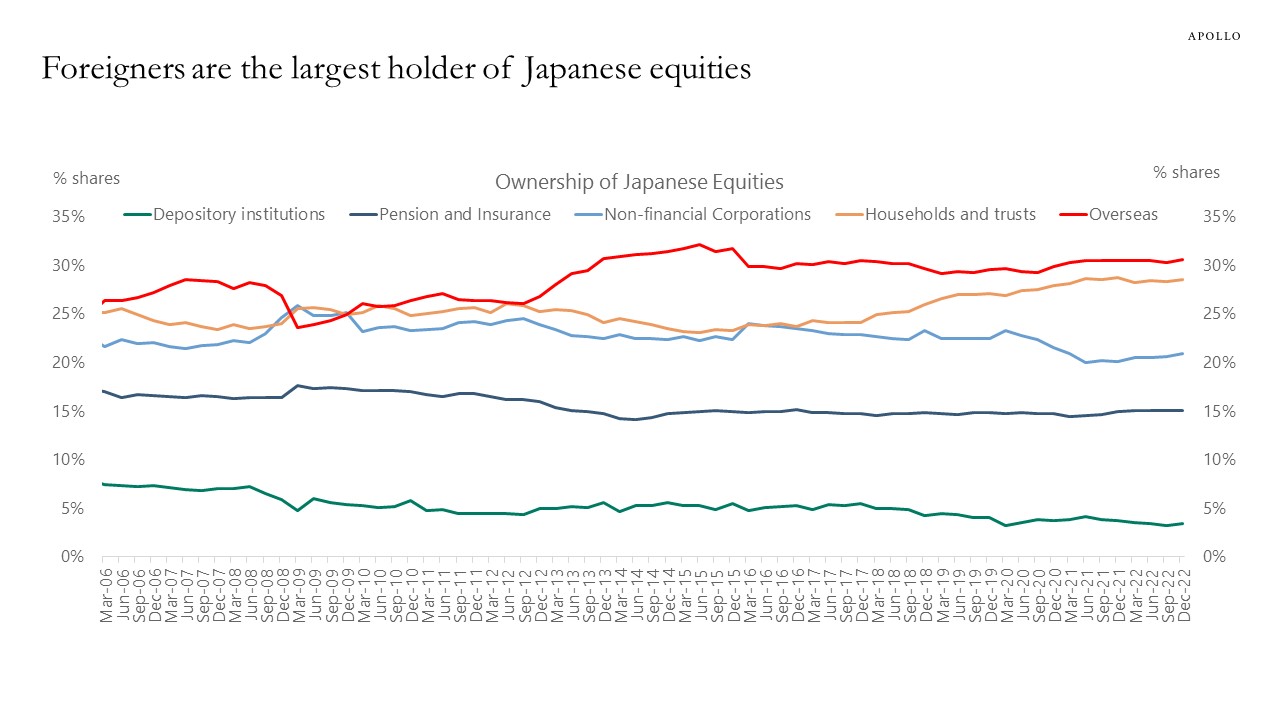
Source: BoJ, Bloomberg, Apollo Chief Economist See important disclaimers at the bottom of the page.
-
The latest data shows a modest improvement in credit card delinquency rates and auto loan delinquency rates for subprime, near prime, and prime borrowers, see chart below. This is the opposite of what would be expected with the Fed trying to tighten financial conditions.
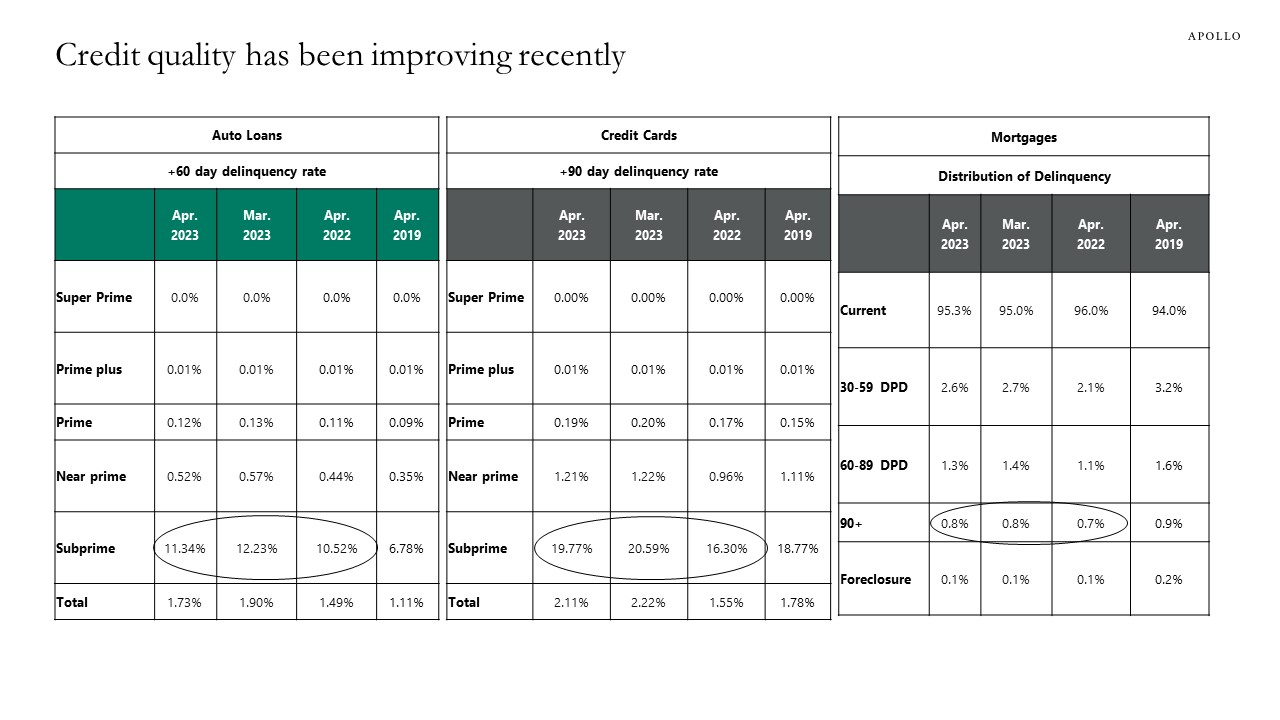
Source: Transunion Monthly Industry Snapshot April 2023 See important disclaimers at the bottom of the page.
-
We built a small vector autoregressive model with GDP growth, loan growth, and bank lending standards, and giving a one standard deviation shock to bank lending standards using a standard Cholesky decomposition shows that it takes six quarters before tighter credit conditions have a maximum negative impact on GDP, see chart below. In other words, the negative impact of the SVB collapse on tighter lending standards will continue to accumulate until the second half of 2024 because it takes time for banks to repair their balance sheets.
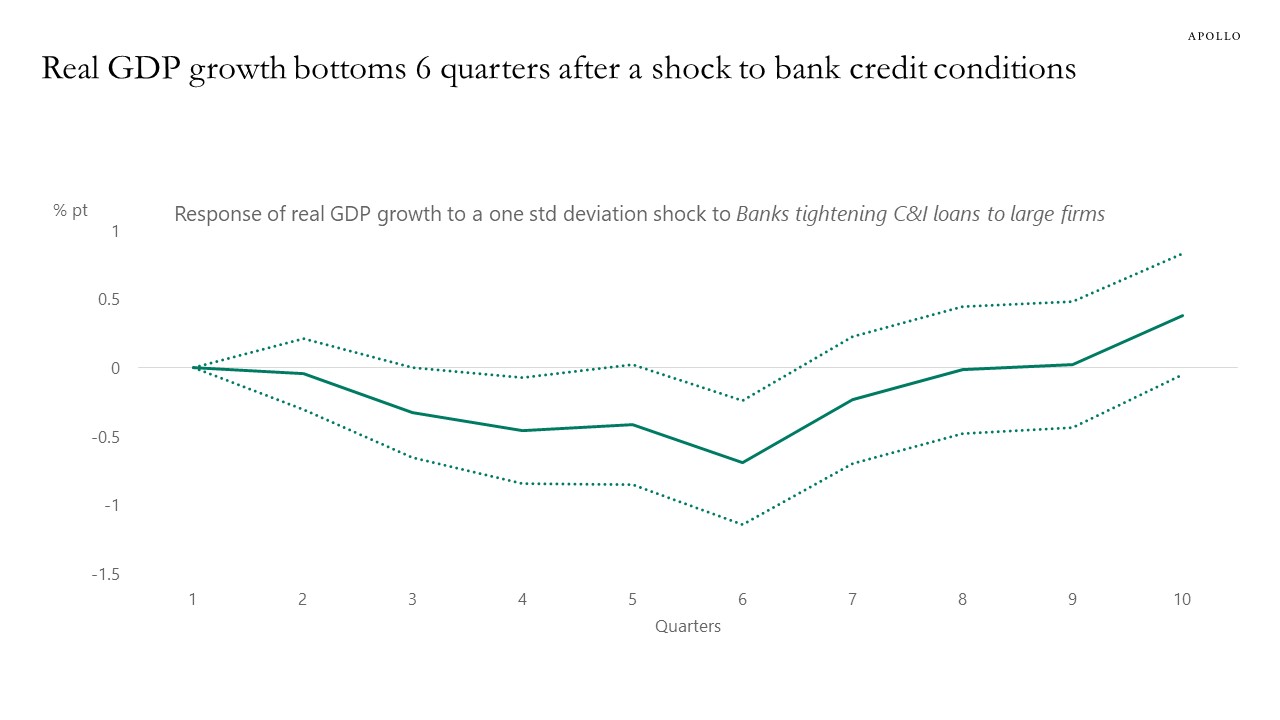
Source: FRB, Haver Analytics, Apollo Chief Economist. Note: Impulse response from the VAR model with variables Loan growth (YoY), GDP growth (YoY) and SLOOS tightening (Banks Tightening C&I Loans to Large Firms). One standard deviation shock to bank tightening leads to -0.7% pt. decline in real GDP growth bottoming in six quarters. One standard deviation for bank tightening is 10.2 pts. See important disclaimers at the bottom of the page.
-
In Europe, there are three times as many publicly held companies as there are PE-backed companies, see chart below.
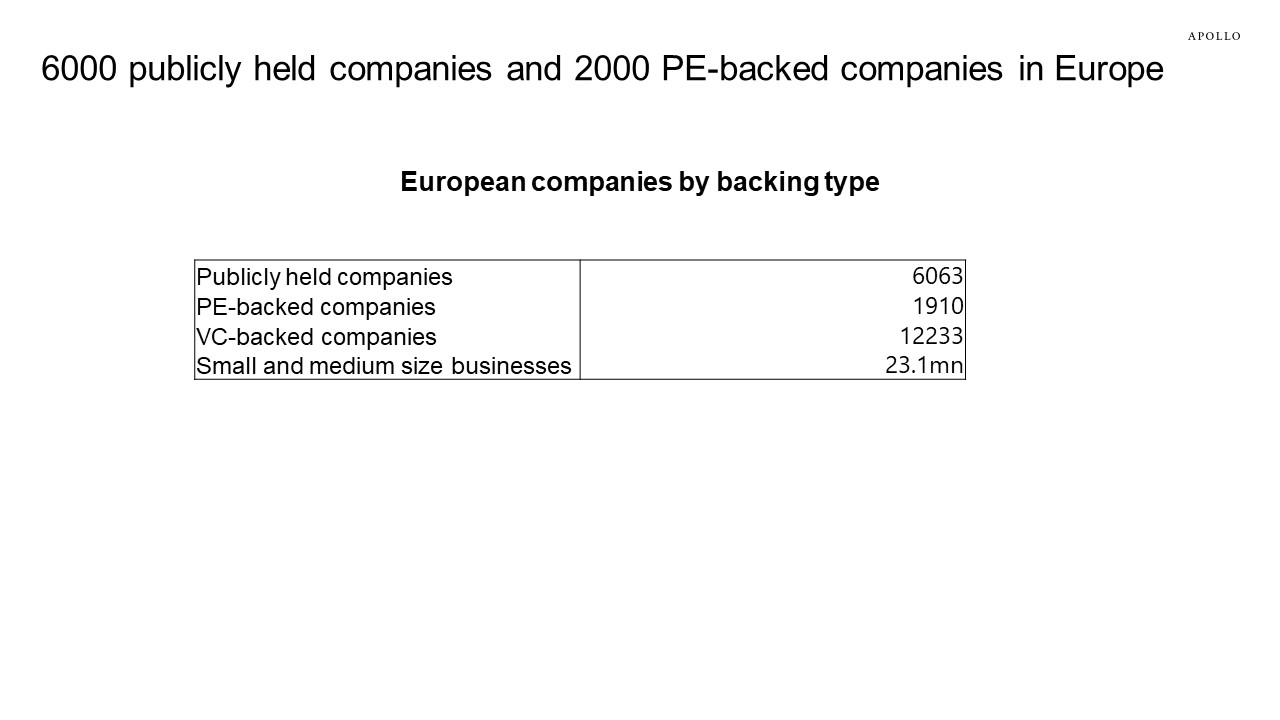
Source: Pitchbook, Statista, Apollo Chief Economist. Note: Data as of 31st March 2023. See important disclaimers at the bottom of the page.
-
The number of publicly held companies is shrinking, and there are about three times as many PE-backed firms in the US as there are publicly held companies, see chart below.
With inflation remaining elevated, the costs of capital will also remain elevated, which will continue to put downward pressure on tech, growth, and venture capital.
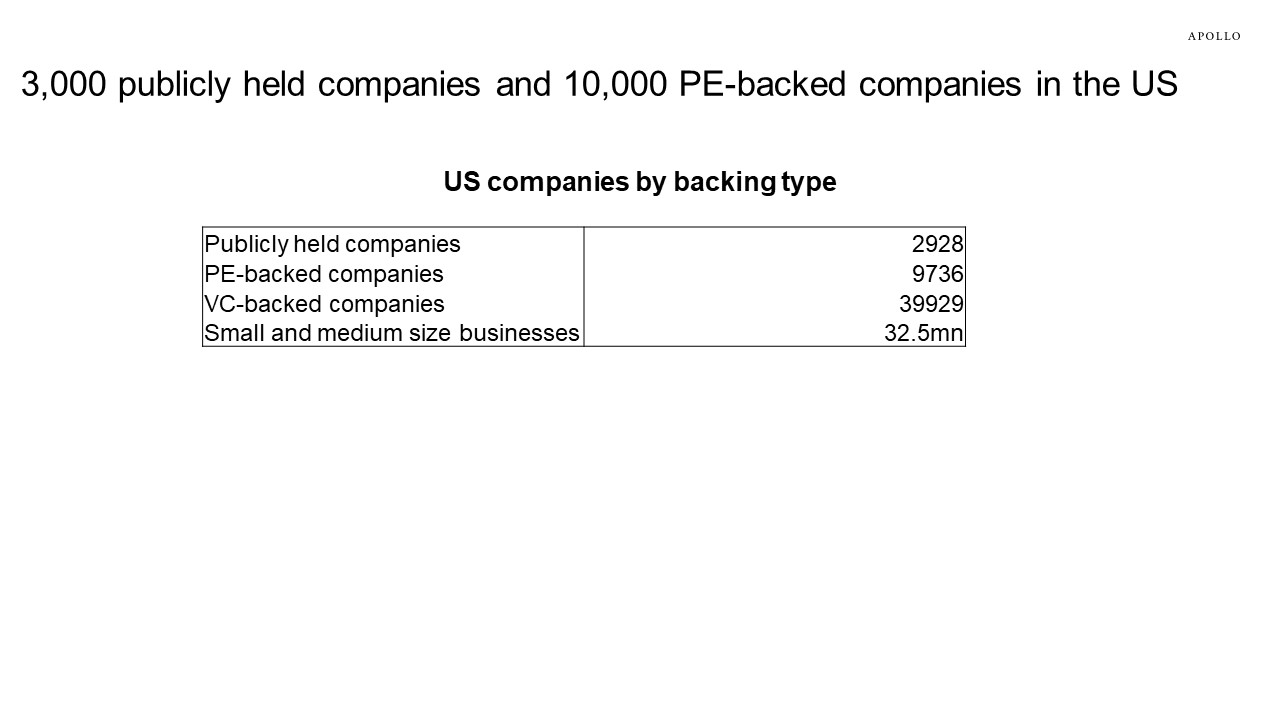
Source: Pitchbook, Small Business Administration, Apollo Chief Economist. Note: Data as of 31st March 2023. See important disclaimers at the bottom of the page.
-
M&A activity has declined over the past two years, and this trend will continue, driven lower by central banks increasing the costs of capital as they continue to fight inflation.
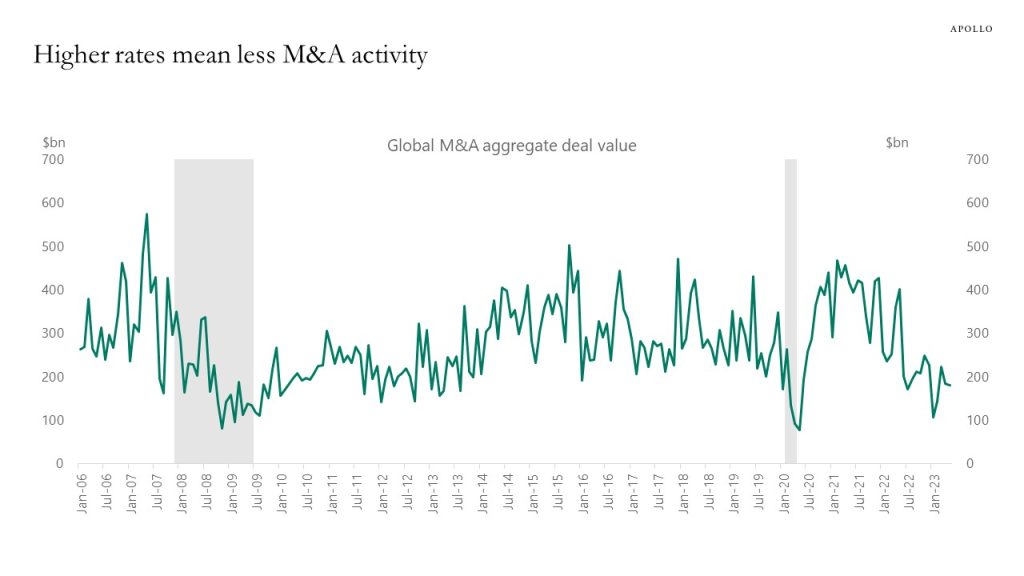
Source: S&P Capital IQ, Apollo Chief Economist. Note: M&A transactions include announced and completed transactions. See important disclaimers at the bottom of the page.
-
Two years ago, the number of banks exceeding the FDIC’s CRE loan concentration guidelines was about 300. Today there are almost 700, see chart below.
In other words, US banks have become much more vulnerable to a decline in commercial real estate prices.
Our latest credit market outlook is available here.
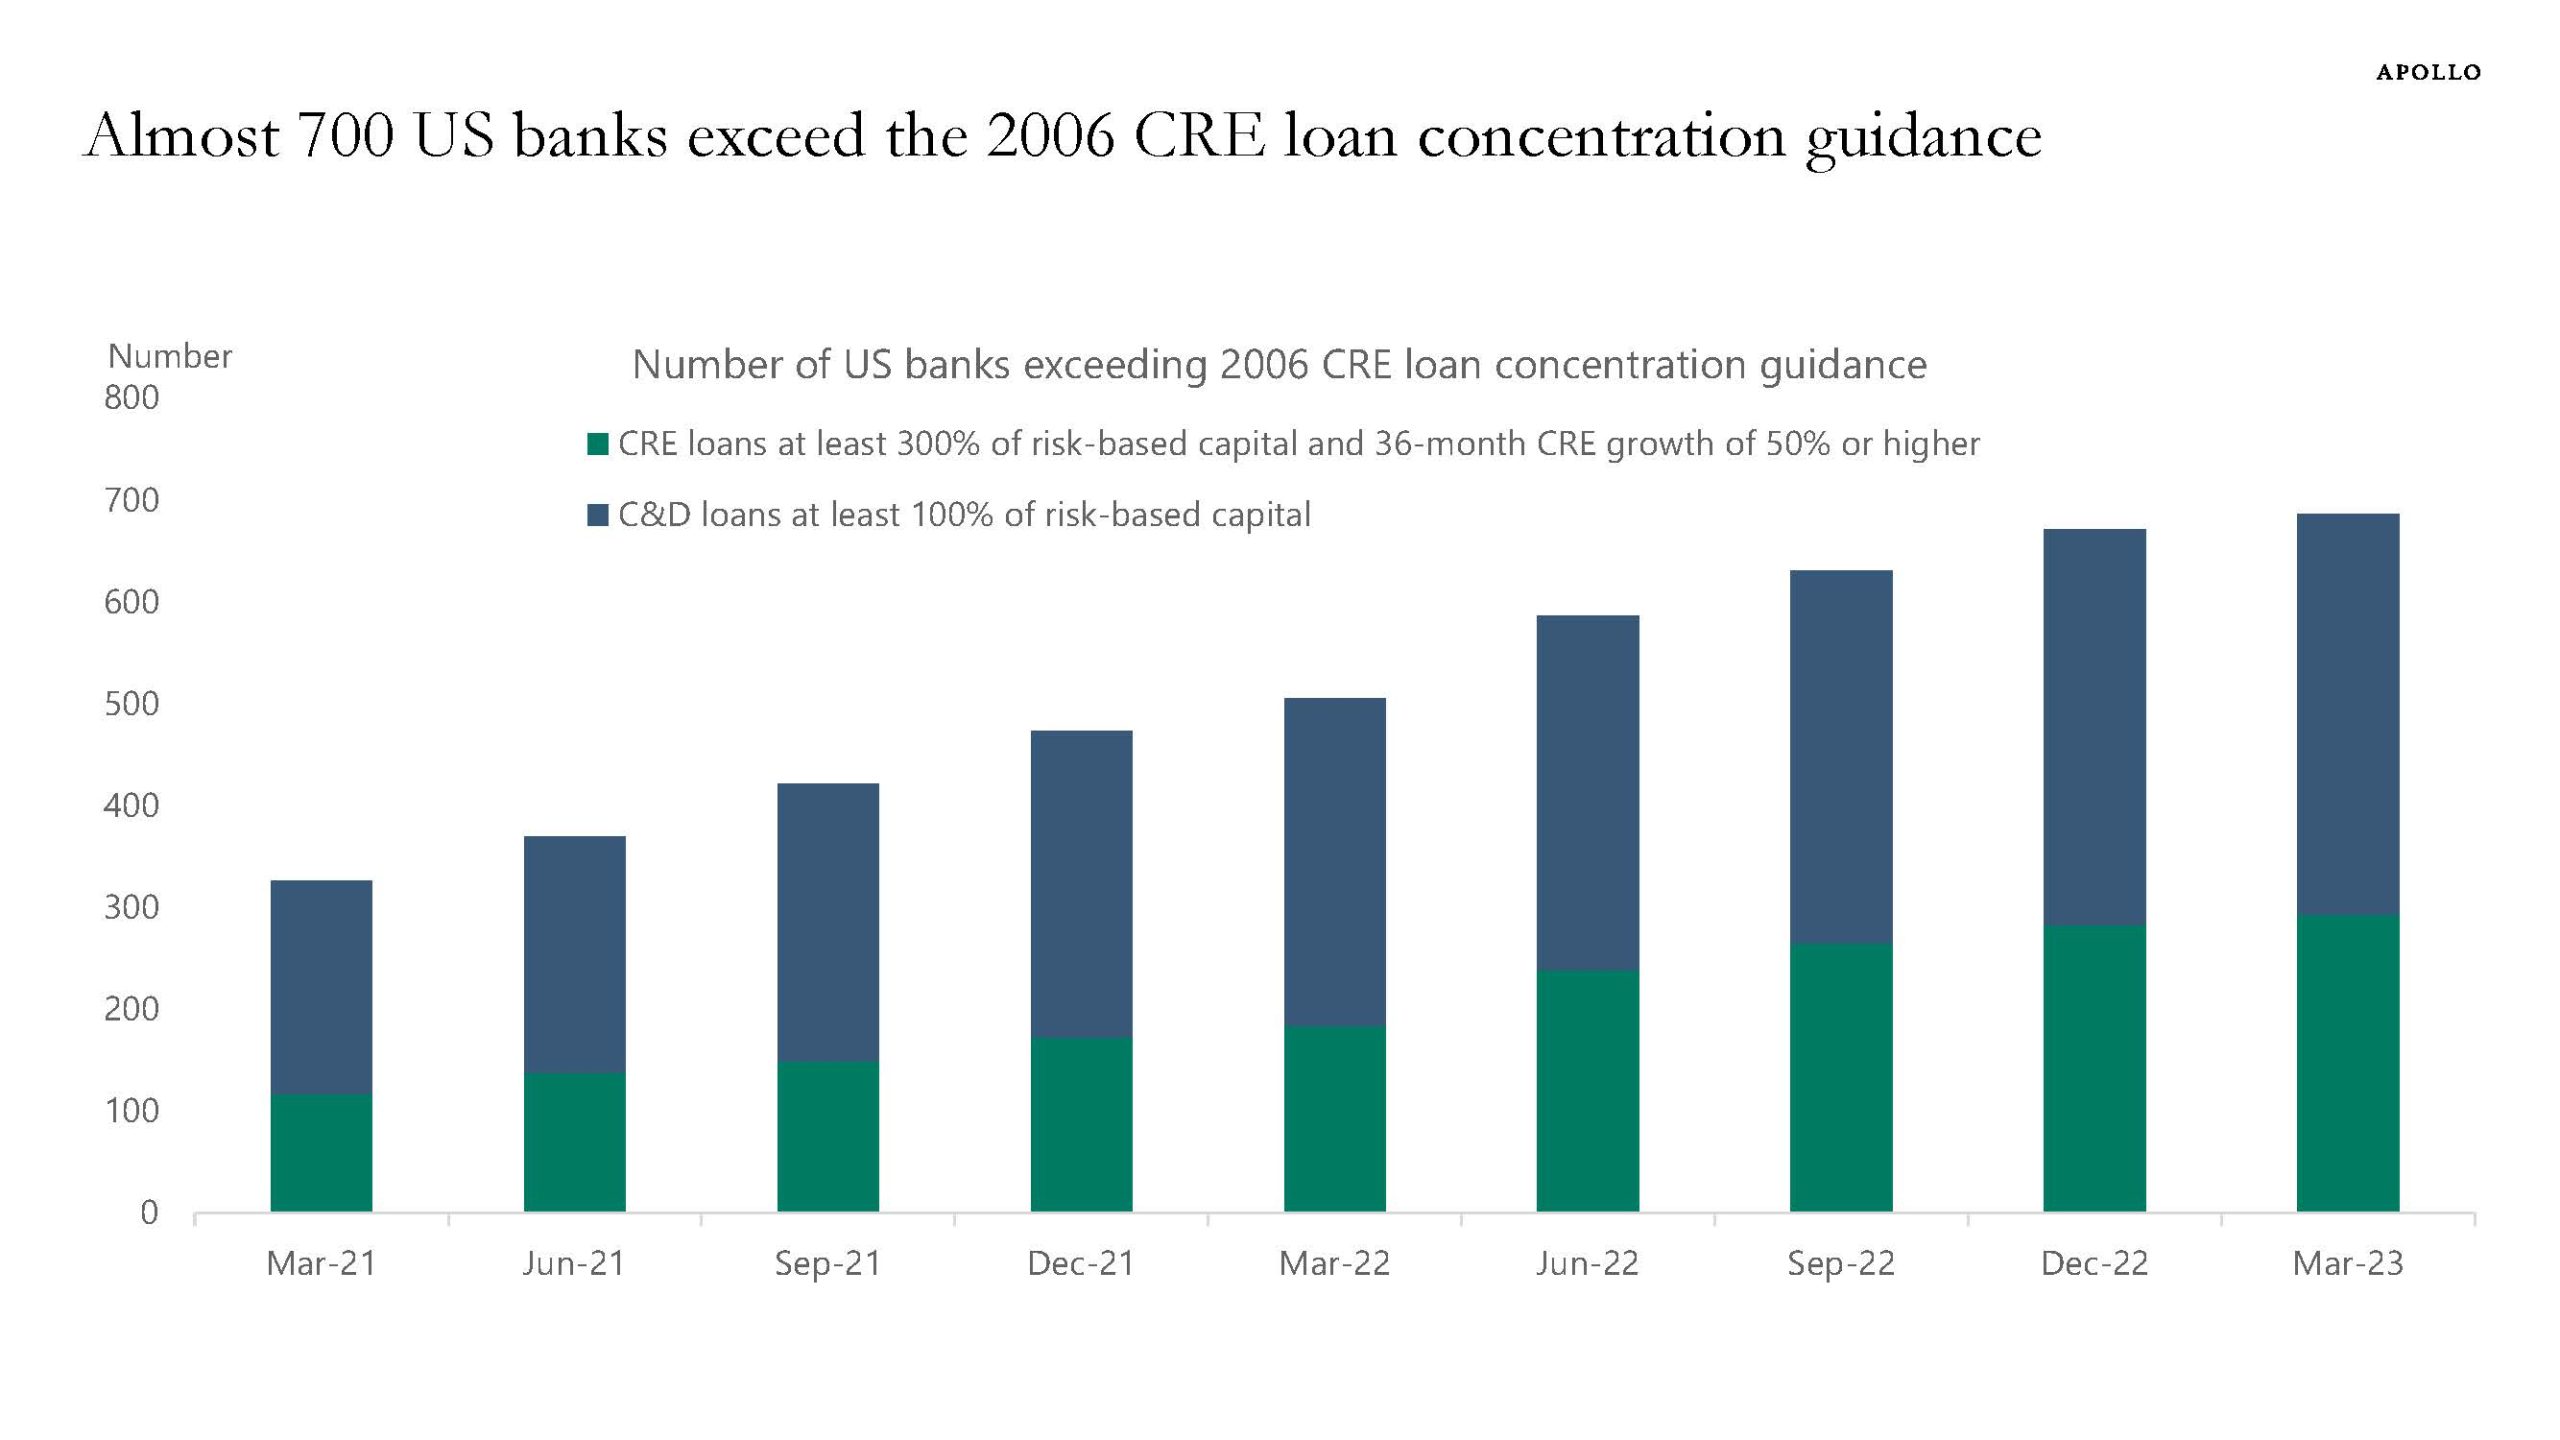
Source: S&P Global Market Intelligence, Apollo Chief Economist. Note: C&D = Construction and Development, data as of May 2023 and based on regulatory filings. See important disclaimers at the bottom of the page.

This presentation may not be distributed, transmitted or otherwise communicated to others in whole or in part without the express consent of Apollo Global Management, Inc. (together with its subsidiaries, “Apollo”).
Apollo makes no representation or warranty, expressed or implied, with respect to the accuracy, reasonableness, or completeness of any of the statements made during this presentation, including, but not limited to, statements obtained from third parties. Opinions, estimates and projections constitute the current judgment of the speaker as of the date indicated. They do not necessarily reflect the views and opinions of Apollo and are subject to change at any time without notice. Apollo does not have any responsibility to update this presentation to account for such changes. There can be no assurance that any trends discussed during this presentation will continue.
Statements made throughout this presentation are not intended to provide, and should not be relied upon for, accounting, legal or tax advice and do not constitute an investment recommendation or investment advice. Investors should make an independent investigation of the information discussed during this presentation, including consulting their tax, legal, accounting or other advisors about such information. Apollo does not act for you and is not responsible for providing you with the protections afforded to its clients. This presentation does not constitute an offer to sell, or the solicitation of an offer to buy, any security, product or service, including interest in any investment product or fund or account managed or advised by Apollo.
Certain statements made throughout this presentation may be “forward-looking” in nature. Due to various risks and uncertainties, actual events or results may differ materially from those reflected or contemplated in such forward-looking information. As such, undue reliance should not be placed on such statements. Forward-looking statements may be identified by the use of terminology including, but not limited to, “may”, “will”, “should”, “expect”, “anticipate”, “target”, “project”, “estimate”, “intend”, “continue” or “believe” or the negatives thereof or other variations thereon or comparable terminology.