


Want it delivered daily to your inbox?
-
Weekly data for corporate bankruptcy filings has started to meaningfully deteriorate in recent weeks, see chart below. The faster speed of slowing in the weekly data is not consistent with the gradual rise in the monthly default rates seen in HY, IG, and loans.
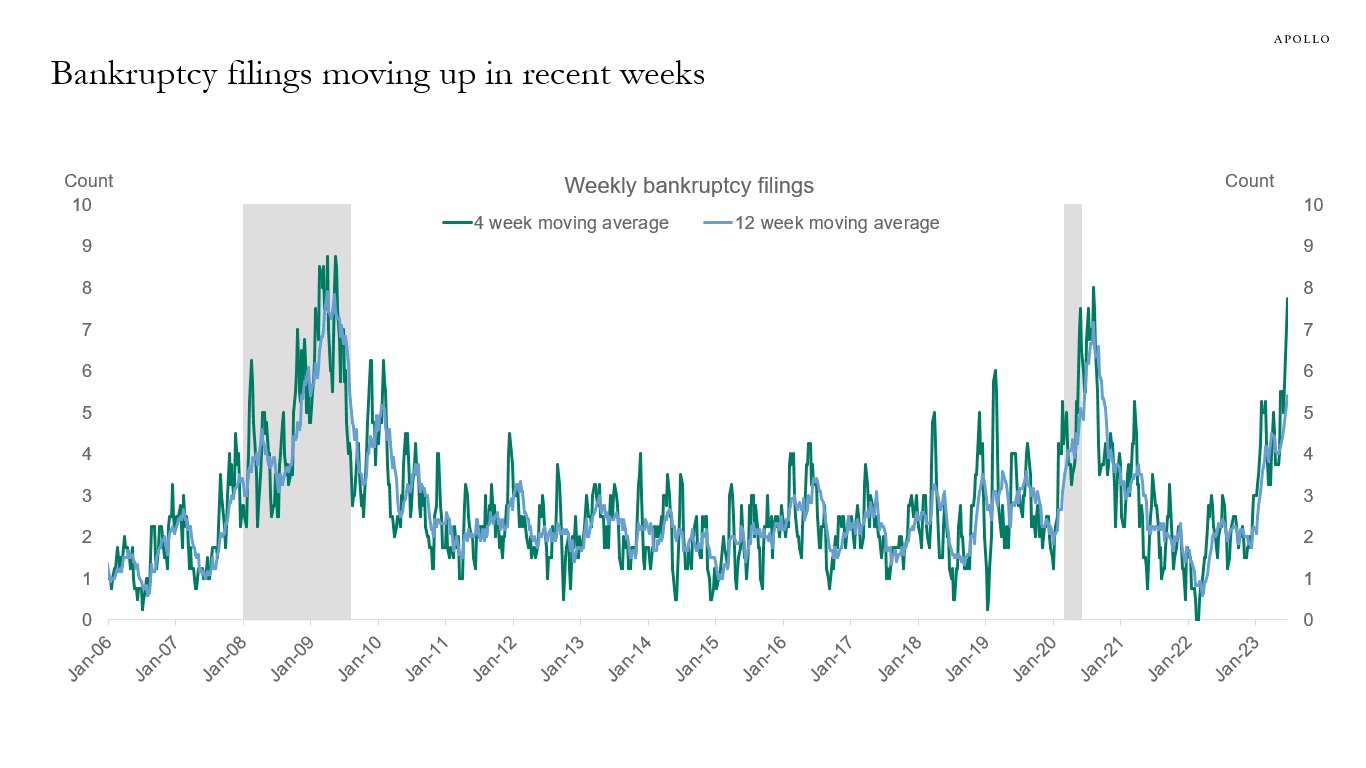
Source: Bloomberg, Apollo Chief Economist. Note: Filings are for companies with more than $50 million in liabilities. For week ending June 21, 2023. See important disclaimers at the bottom of the page.
-
The quality of auto loans and mortgages originated today is significantly higher than auto loans and mortgages originated before the GFC in 2006, see charts below.
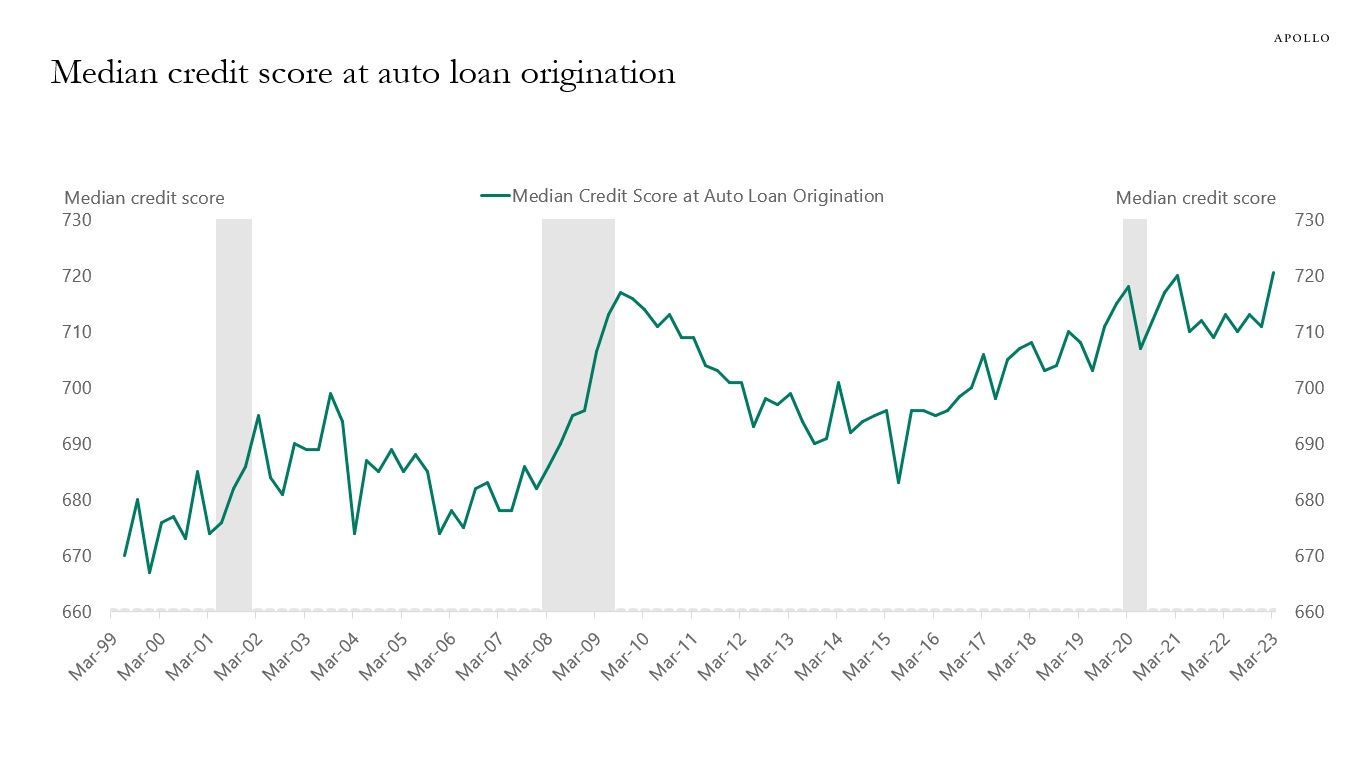
Source: FRBNY Consumer Credit Panel, Equifax, Haver Analytics, Apollo Chief Economist 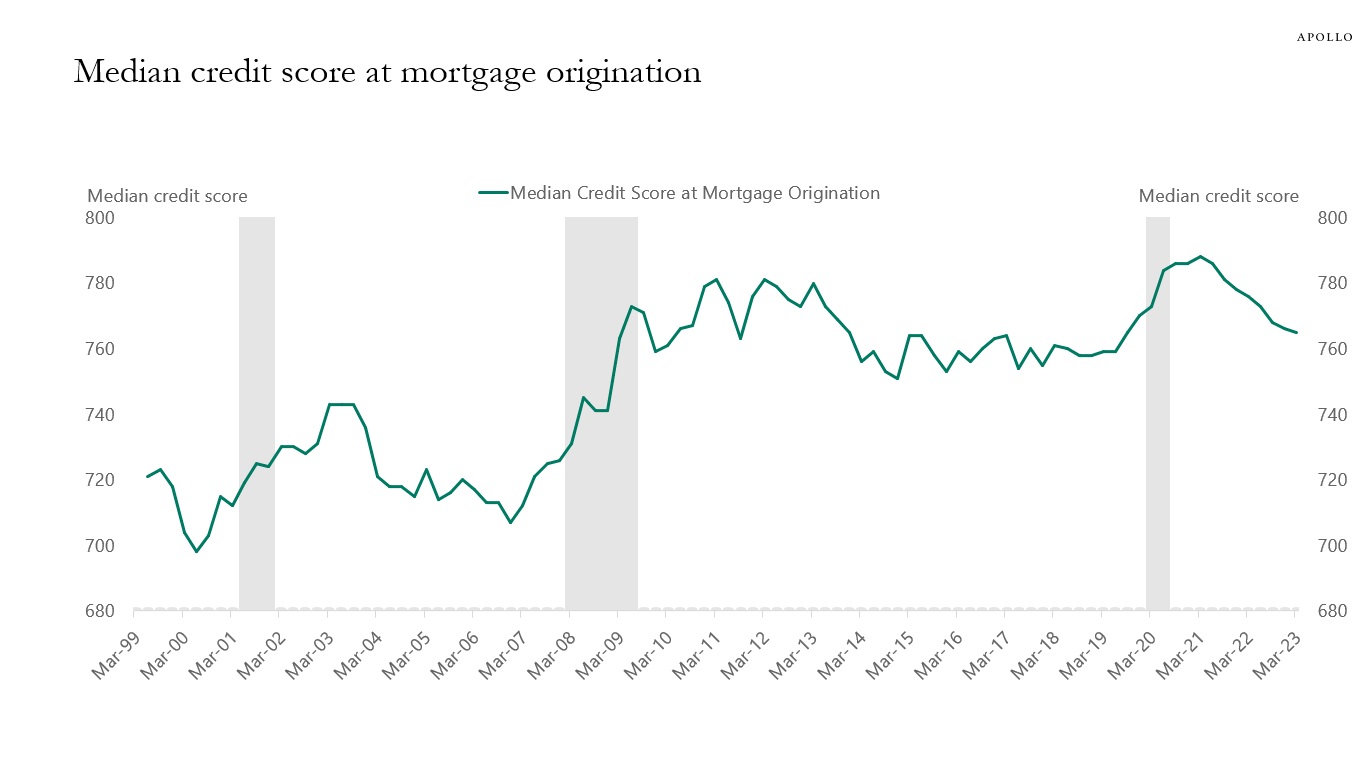
Source: FRBNY Consumer Credit Panel, Equifax, Haver Analytics, Apollo Chief Economist See important disclaimers at the bottom of the page.
-
The Fed’s monthly survey of households shows that consumers are not worried about losing their jobs, see chart below.
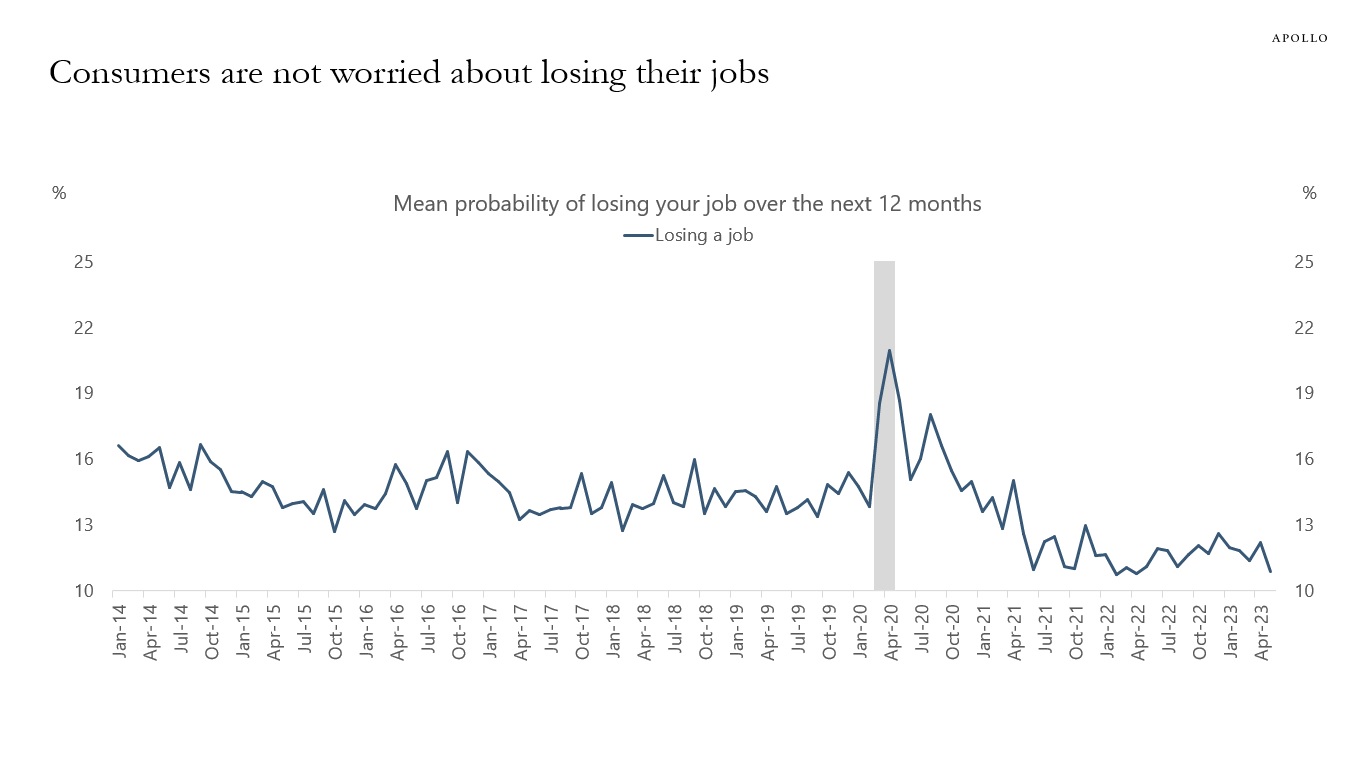
Source: FRBNY, Haver, Apollo Chief Economist See important disclaimers at the bottom of the page.
-
Manhattan rents just reached a new record high at $4,360, and accelerating rent inflation is a problem for the Fed because housing has a weight of 40% in the CPI basket, see chart below.
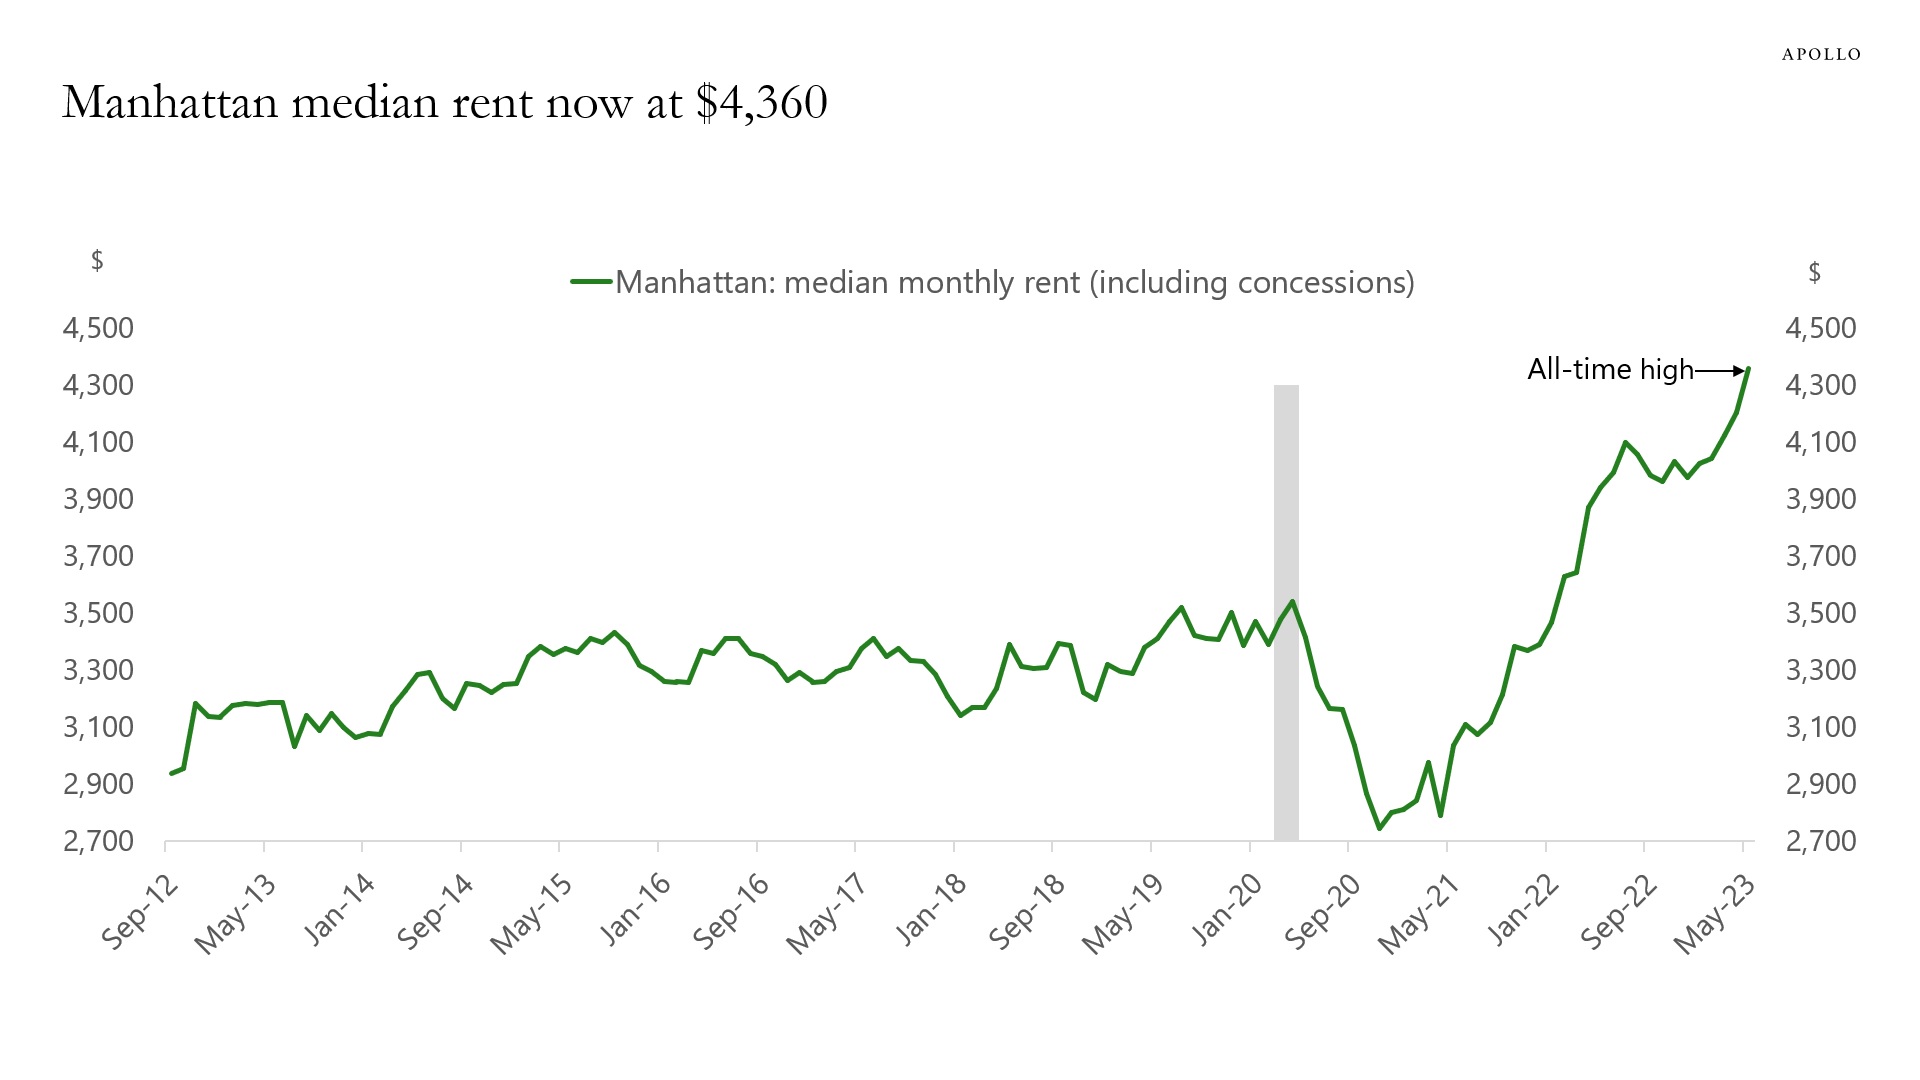
Source: Elliman, Apollo Chief Economist See important disclaimers at the bottom of the page.
-
Twenty-five percent of all US government debt outstanding has been added since the beginning of 2020. And with higher debt levels and higher interest rates, debt servicing costs have increased from $1 billion per day in 2020 to almost $2 billion per day in 2023, see charts below.
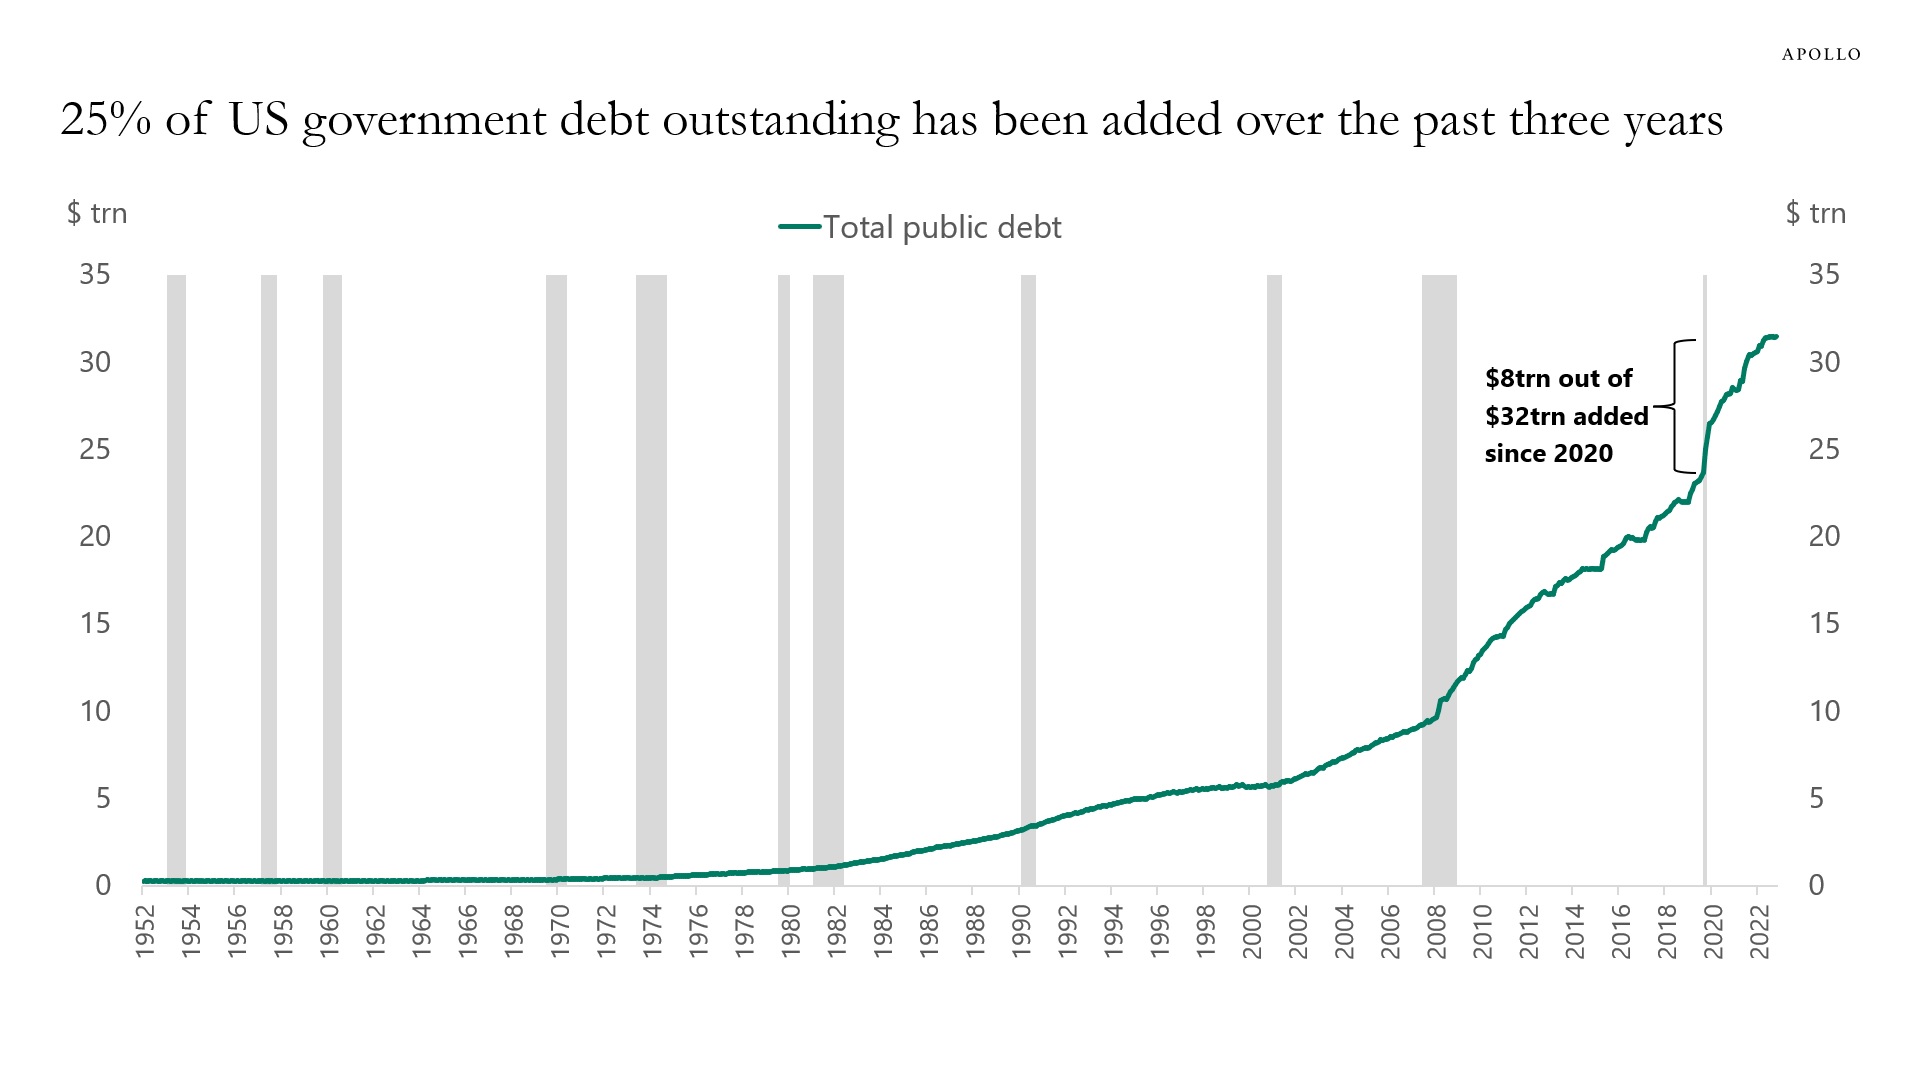
Source: Federal debt shown, Treasury, Haver, Apollo Chief Economist 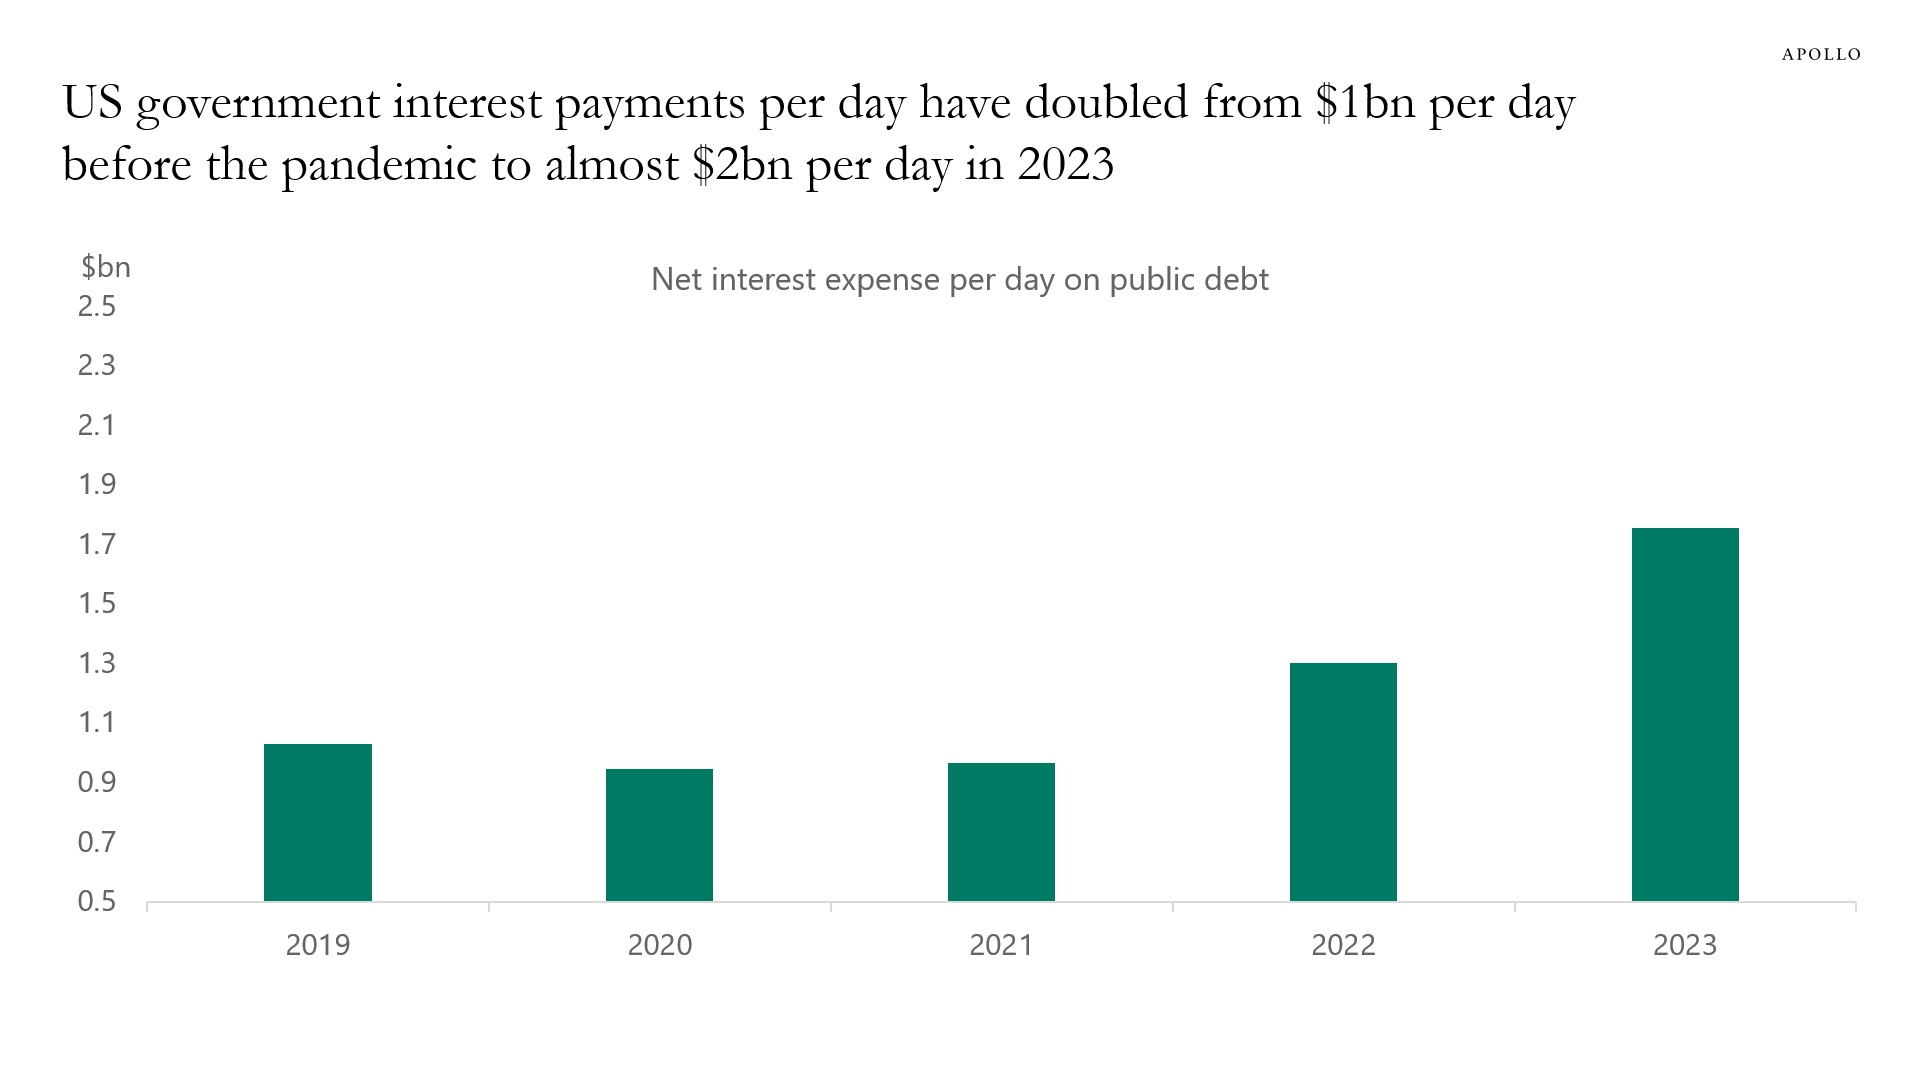
Source: CBO, Haver Analytics, Apollo Chief Economist. Note: Interest rate assumption by CBO: 2.1% in 2022 and 2.7% in 2023. Annual CBO data divided by 365. See important disclaimers at the bottom of the page.
-
The Fed has calculated how much of inflation is driven by demand and how much inflation is driven by supply, and their latest estimates find that supply is becoming less important and demand inflation remains high and sticky, see chart below.
Specifically, the Fed, for each of the 124 product categories in the core PCE index, estimated price and quantity equations using a VAR with 12 lags. They looked at the signs of residuals to identify how big a share of categories of consumer spending experienced a combination of higher prices and higher quantities (demand shock) or higher prices and lower quantities (supply shock).
With inflation being driven by demand, more demand destruction is needed in the form of higher rates from the Fed.
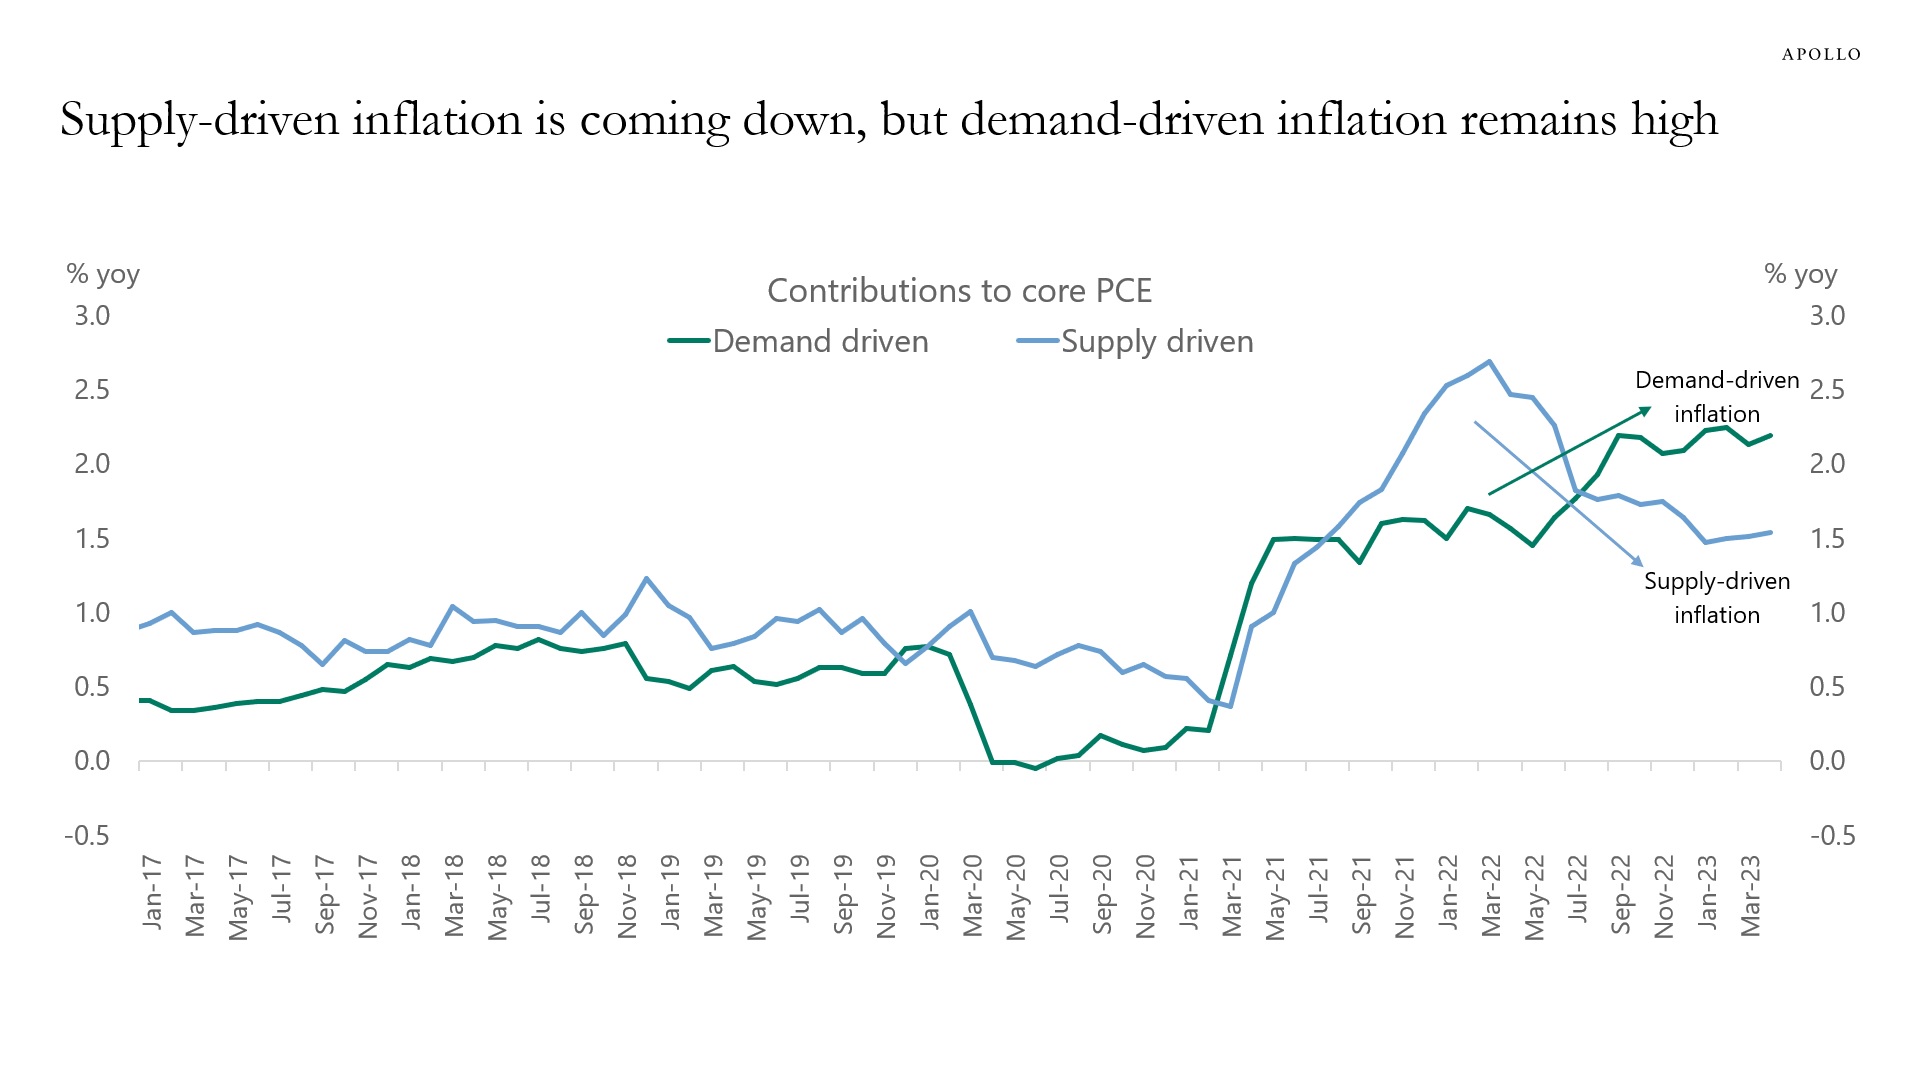
Source: FRBSF, Apollo Chief Economist See important disclaimers at the bottom of the page.
-
The monthly mortgage payment for a new average loan size has doubled to almost $3,000 since the beginning of last year, see chart below. As households continue to run down their excess savings, these higher mortgage payments will eventually begin to have a negative impact on the housing market and the consumer.
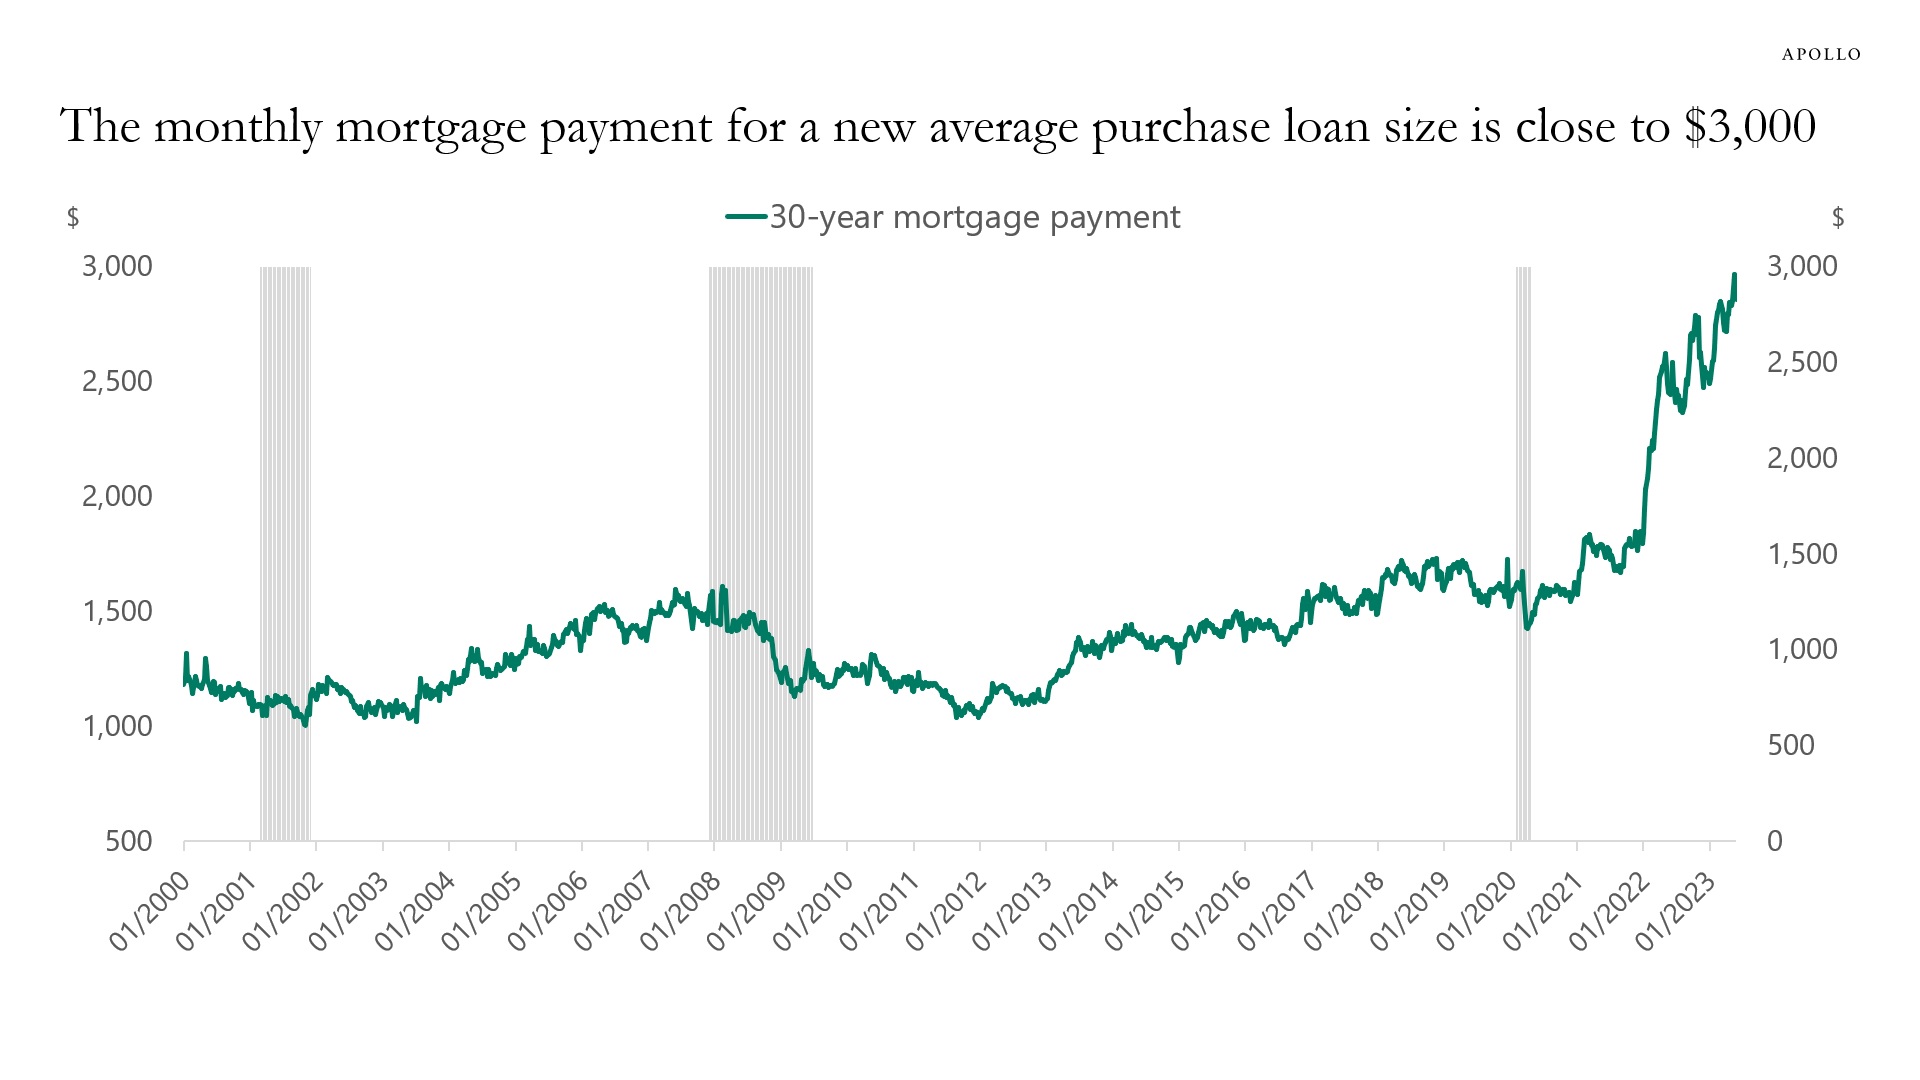
Source: Bloomberg L.P., Apollo Chief Economist. Note: Calculation of monthly payment using the 30-year average new purchase loan size and the 30-year effective rate. See important disclaimers at the bottom of the page.
-
The share of job openings offering work from home is starting to flatten out across countries, see chart below. For more see here.
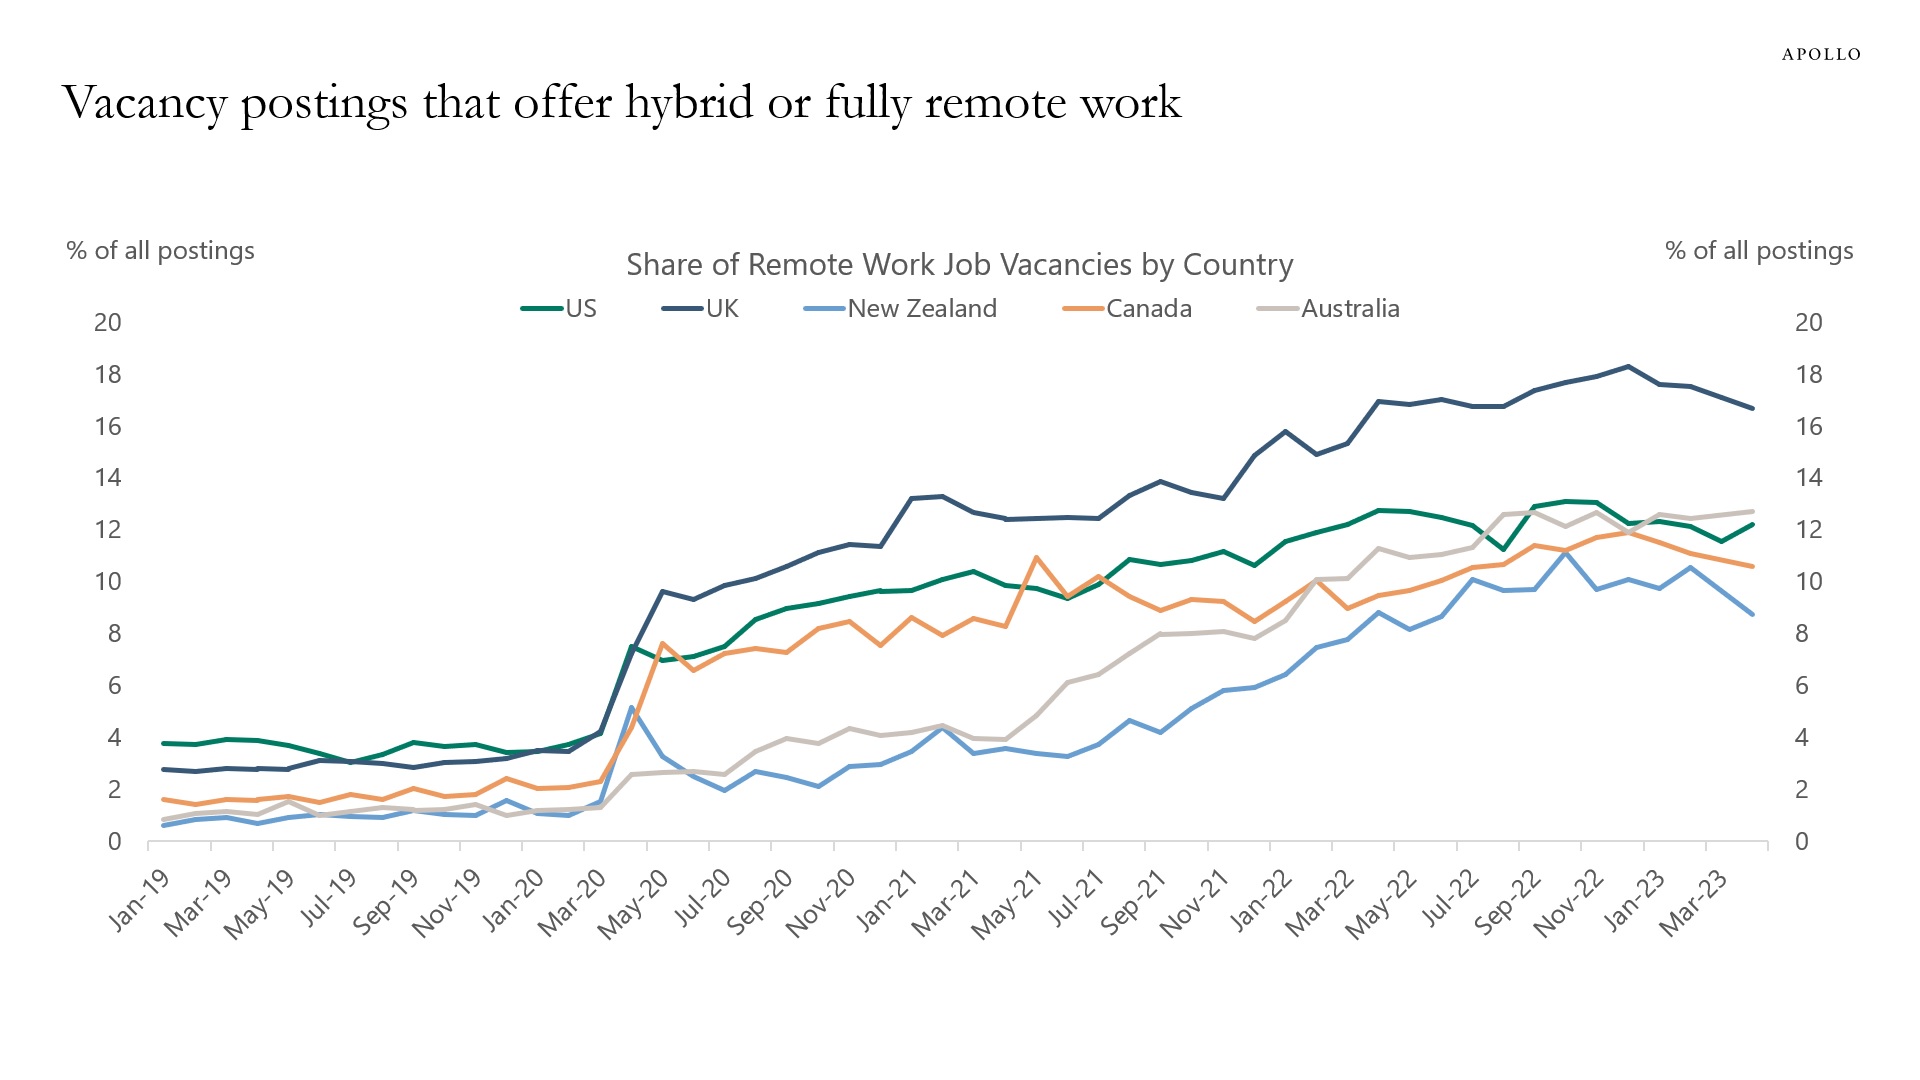
Source: WFH MAP, Apollo Chief Economist. Note: This includes share of new job vacancy postings which explicitly offer new hires the right to work one or more days per week from home or other remote location. This pools together both hybrid and fully remote offers. See important disclaimers at the bottom of the page.
-
In March 2021 the FOMC thought that the Fed funds rate by the end of 2023 would be zero, and today they think it will be 5.6%, see chart below. With this in mind, markets should be flexible when they think about where the Fed funds rate will be by the end of 2024.
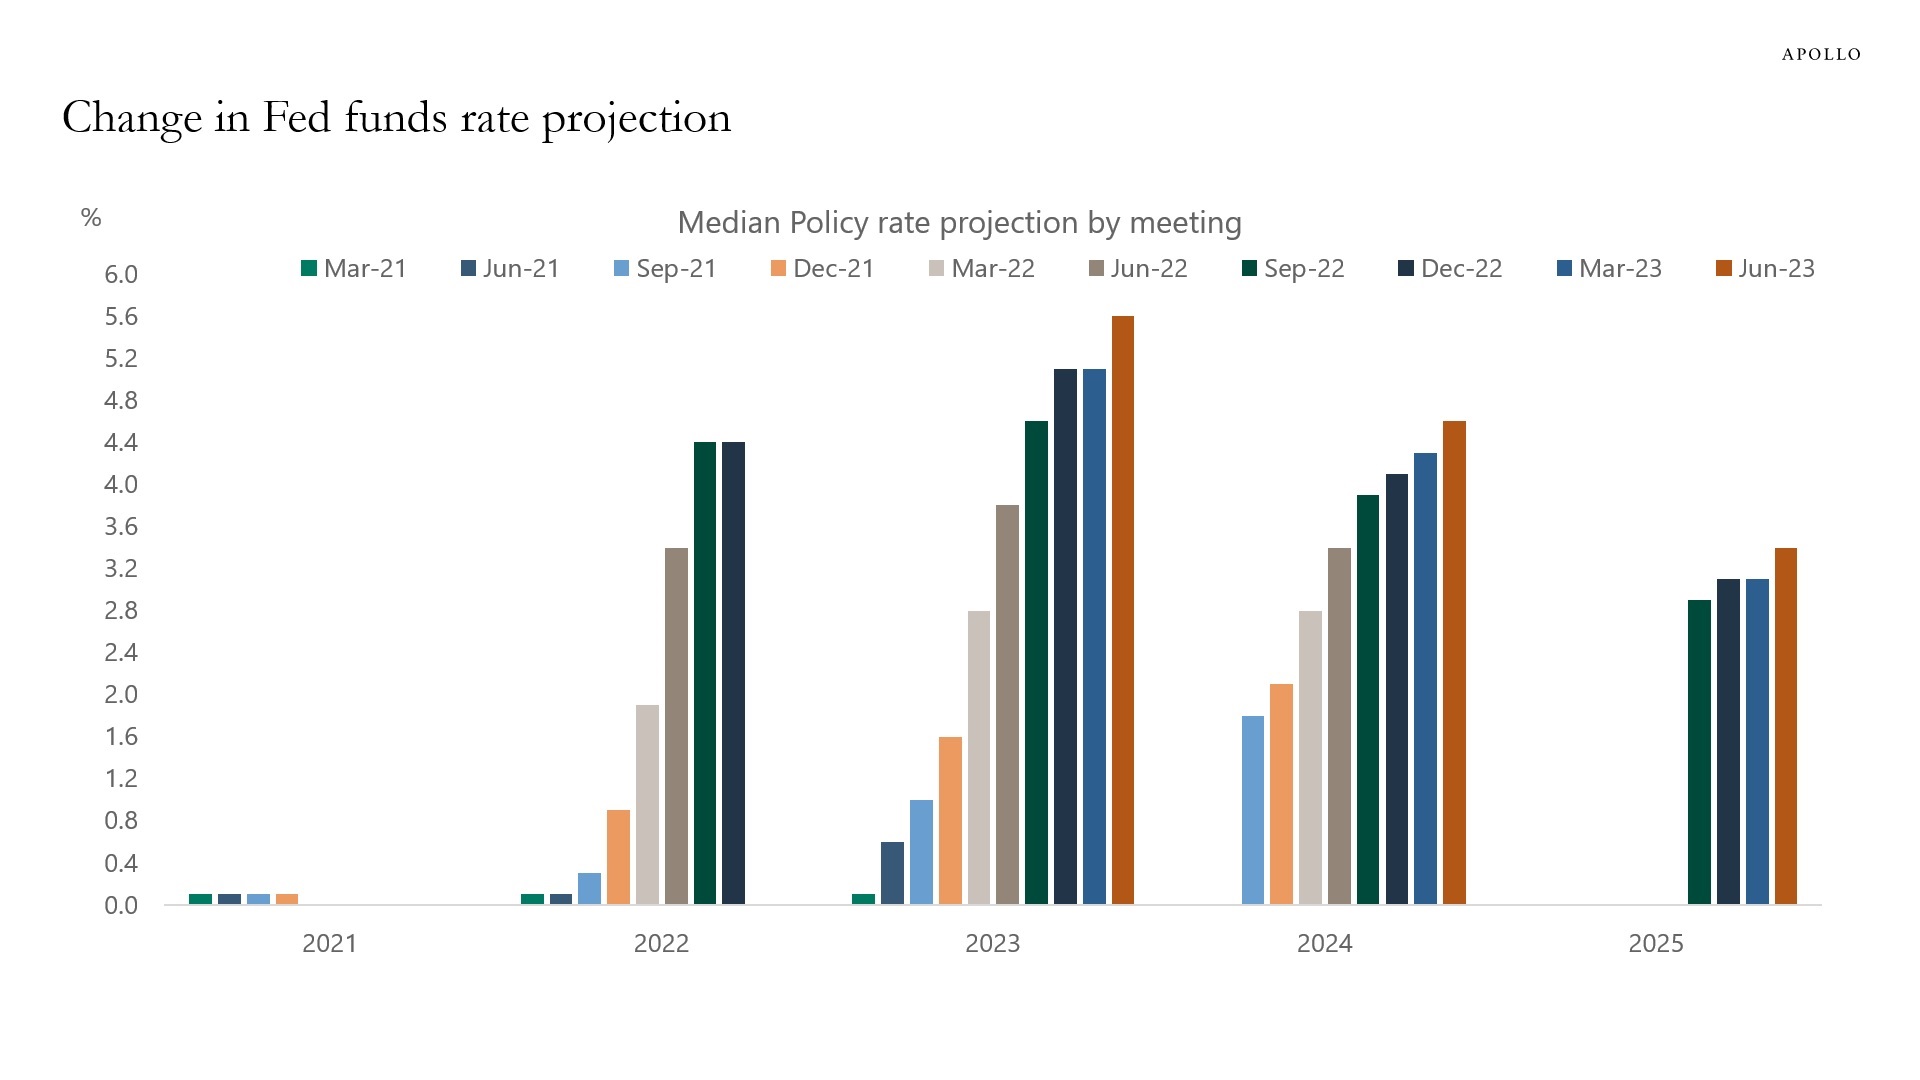
Source: FRB, Apollo Chief Economist See important disclaimers at the bottom of the page.
-
The charts below show how consumer spending on services and goods respond during Fed hiking cycles.
There are two conclusions:
1) The first chart shows that spending on consumer services is not very responsive to Fed hikes, and it can take up to 18 months after the first Fed hike before consumer spending on services starts slowing down.
2) The trajectory of consumer spending on goods during this Fed cycle has been very muted. This was likely driven by the strong growth in consumer spending on goods during the pandemic.
The bottom line is that looking at previous Fed hiking cycles, it always takes a long time before Fed hikes begin to slow down consumer spending on services.
With services making up 80% of spending, this argues for the Fed having to raise rates more than the market is currently pricing. And with more rate increases comes a higher risk of a harder landing.
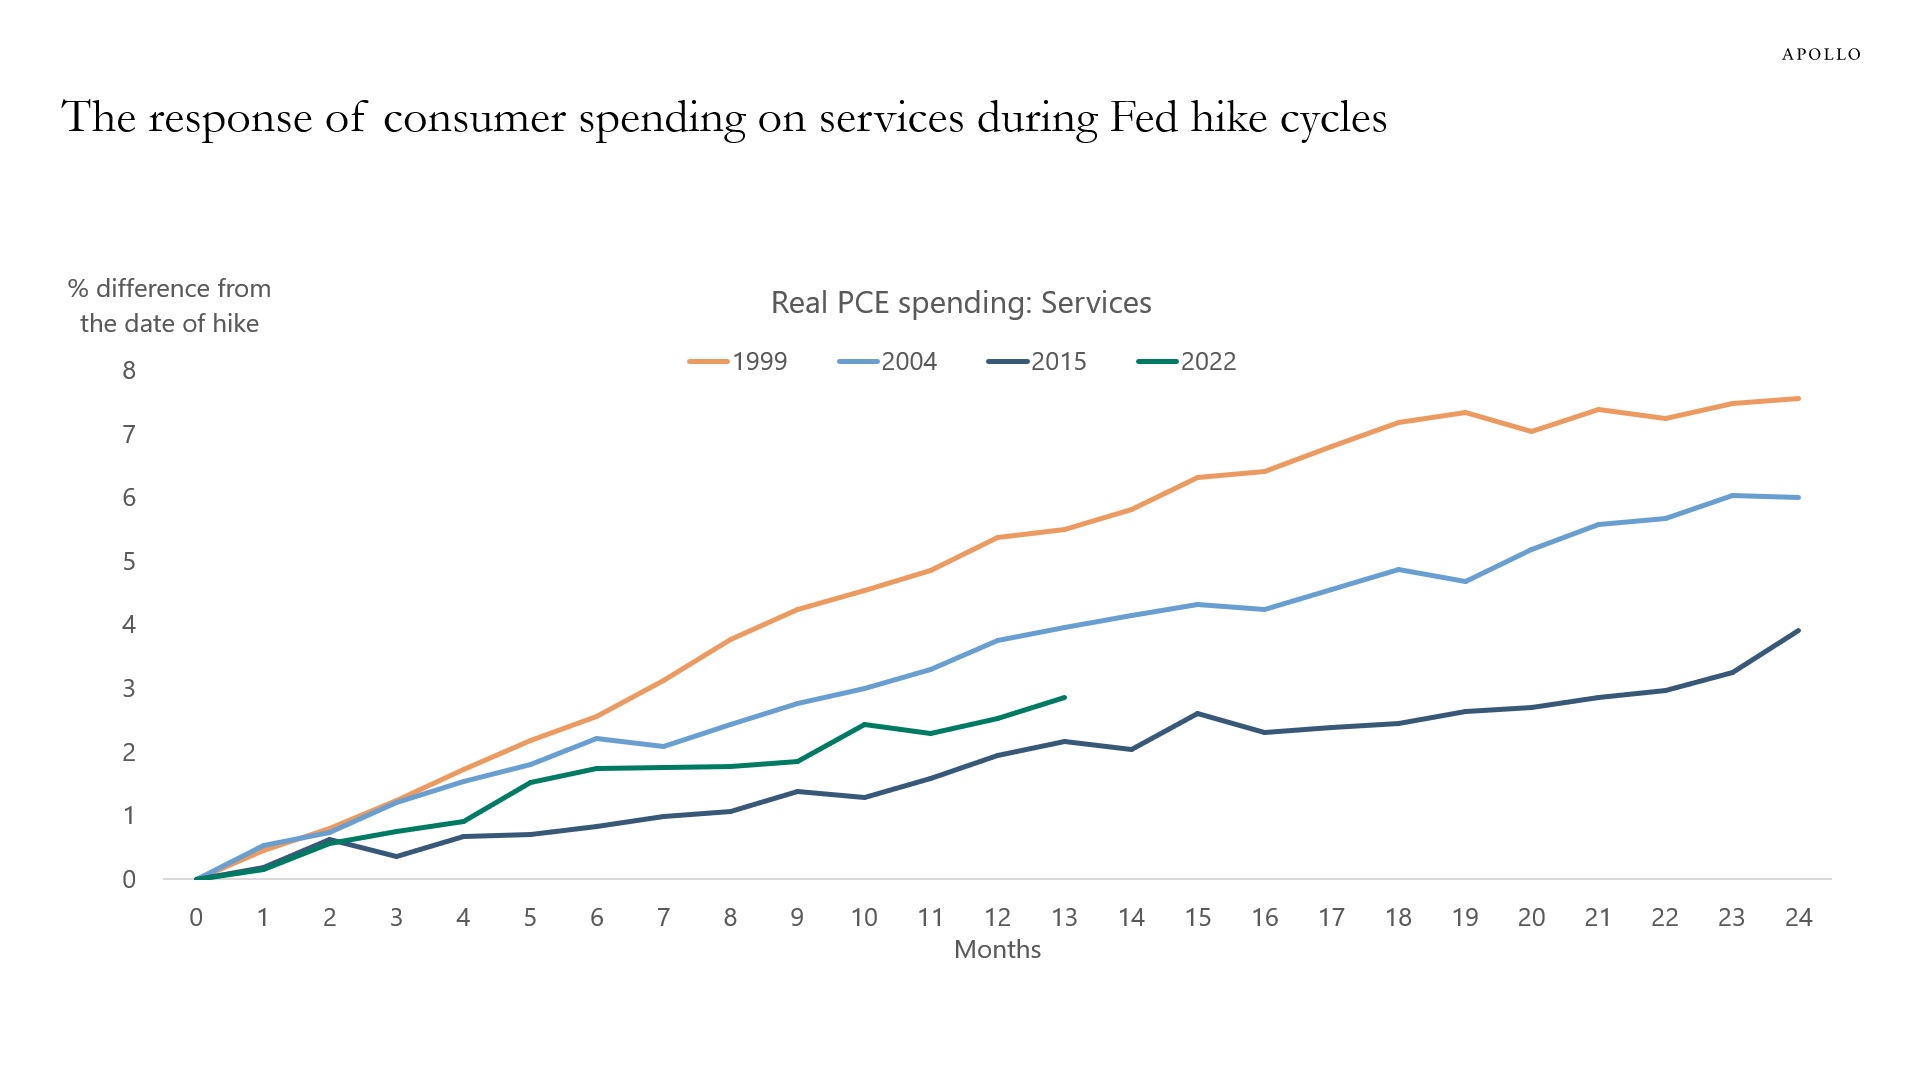
Source: BEA, FRB, Apollo Chief Economist 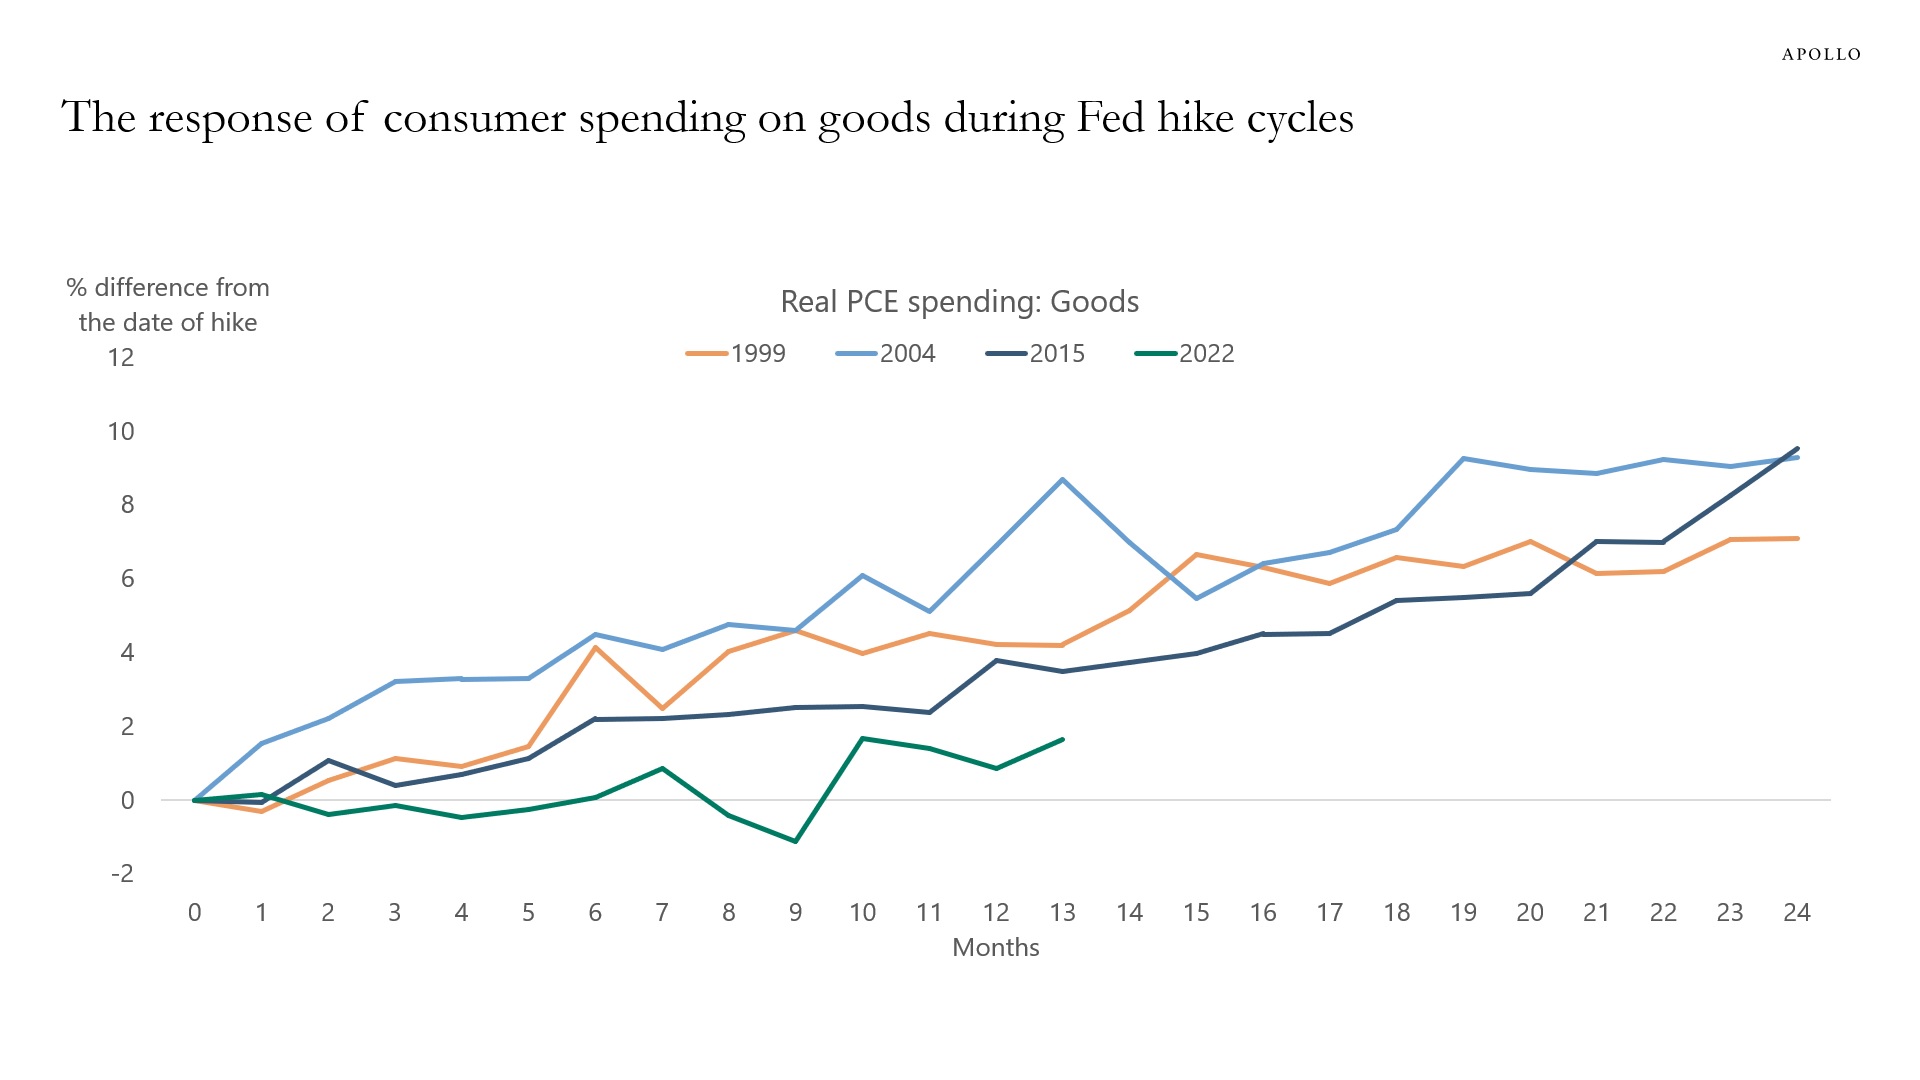
Source: BEA, FRB, Apollo Chief Economist See important disclaimers at the bottom of the page.

This presentation may not be distributed, transmitted or otherwise communicated to others in whole or in part without the express consent of Apollo Global Management, Inc. (together with its subsidiaries, “Apollo”).
Apollo makes no representation or warranty, expressed or implied, with respect to the accuracy, reasonableness, or completeness of any of the statements made during this presentation, including, but not limited to, statements obtained from third parties. Opinions, estimates and projections constitute the current judgment of the speaker as of the date indicated. They do not necessarily reflect the views and opinions of Apollo and are subject to change at any time without notice. Apollo does not have any responsibility to update this presentation to account for such changes. There can be no assurance that any trends discussed during this presentation will continue.
Statements made throughout this presentation are not intended to provide, and should not be relied upon for, accounting, legal or tax advice and do not constitute an investment recommendation or investment advice. Investors should make an independent investigation of the information discussed during this presentation, including consulting their tax, legal, accounting or other advisors about such information. Apollo does not act for you and is not responsible for providing you with the protections afforded to its clients. This presentation does not constitute an offer to sell, or the solicitation of an offer to buy, any security, product or service, including interest in any investment product or fund or account managed or advised by Apollo.
Certain statements made throughout this presentation may be “forward-looking” in nature. Due to various risks and uncertainties, actual events or results may differ materially from those reflected or contemplated in such forward-looking information. As such, undue reliance should not be placed on such statements. Forward-looking statements may be identified by the use of terminology including, but not limited to, “may”, “will”, “should”, “expect”, “anticipate”, “target”, “project”, “estimate”, “intend”, “continue” or “believe” or the negatives thereof or other variations thereon or comparable terminology.