


Want it delivered daily to your inbox?
-
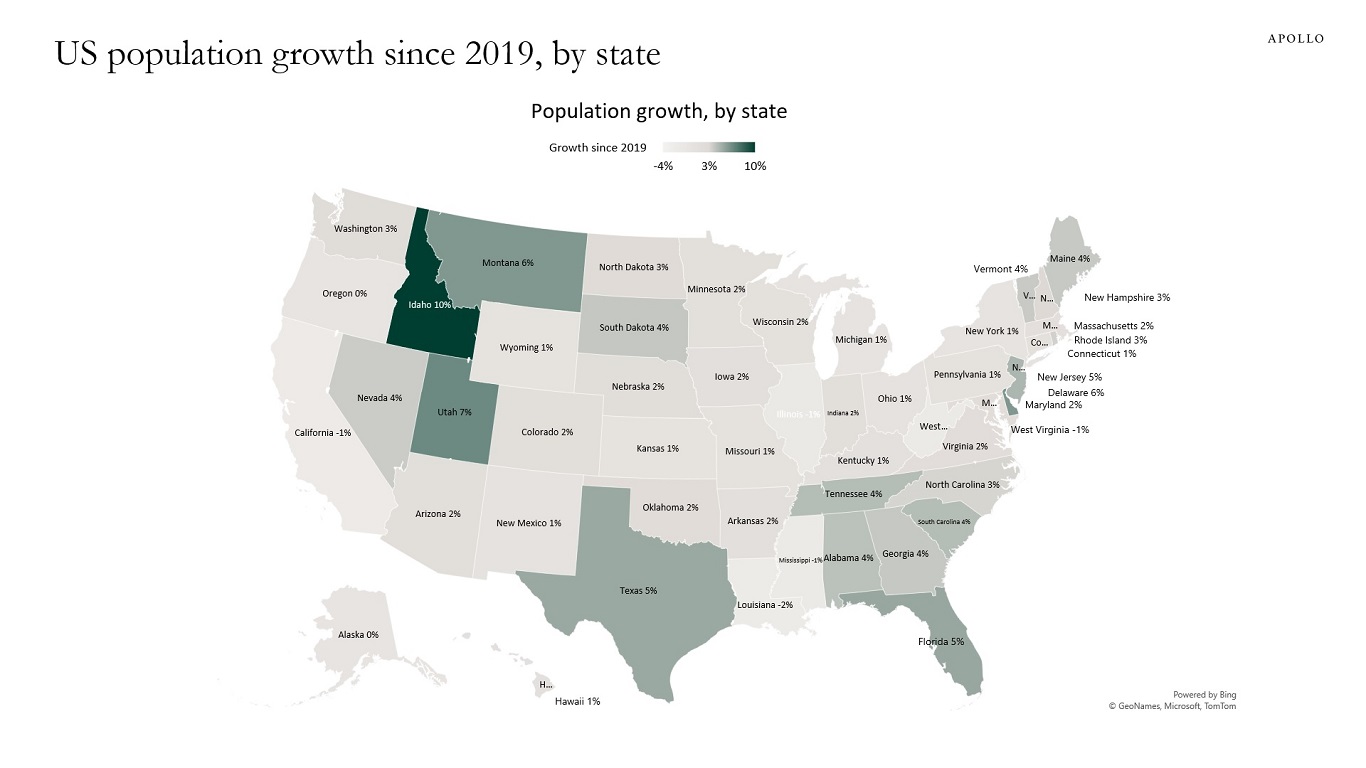
During the post-Covid period, US population growth has been the fastest in Idaho, Utah, Montana, Texas, Florida, and New Jersey, see map below.
See important disclaimers at the bottom of the page.
-
The global rise in stock prices is driven mainly by large-cap firms, not only in the US and Europe but also in Japan, see charts below.
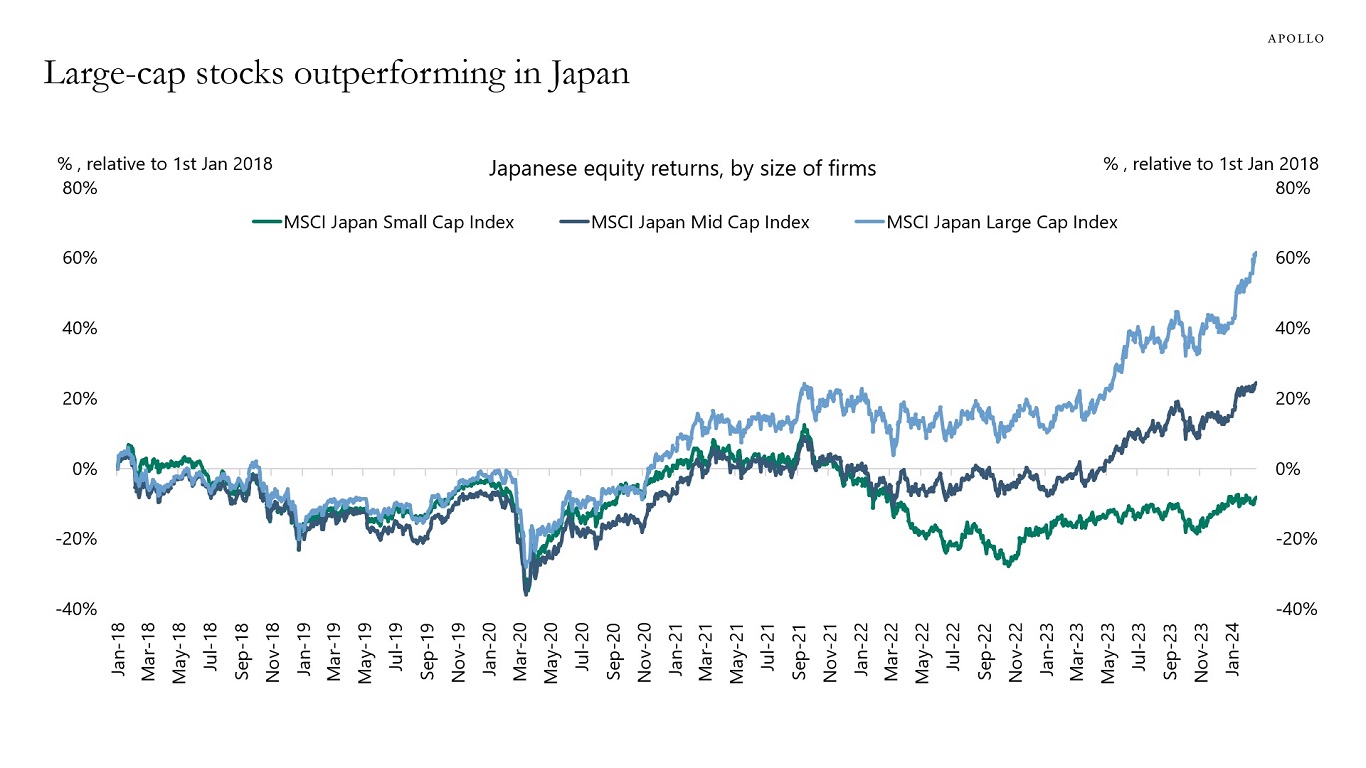
Source: Bloomberg, Apollo Chief Economist 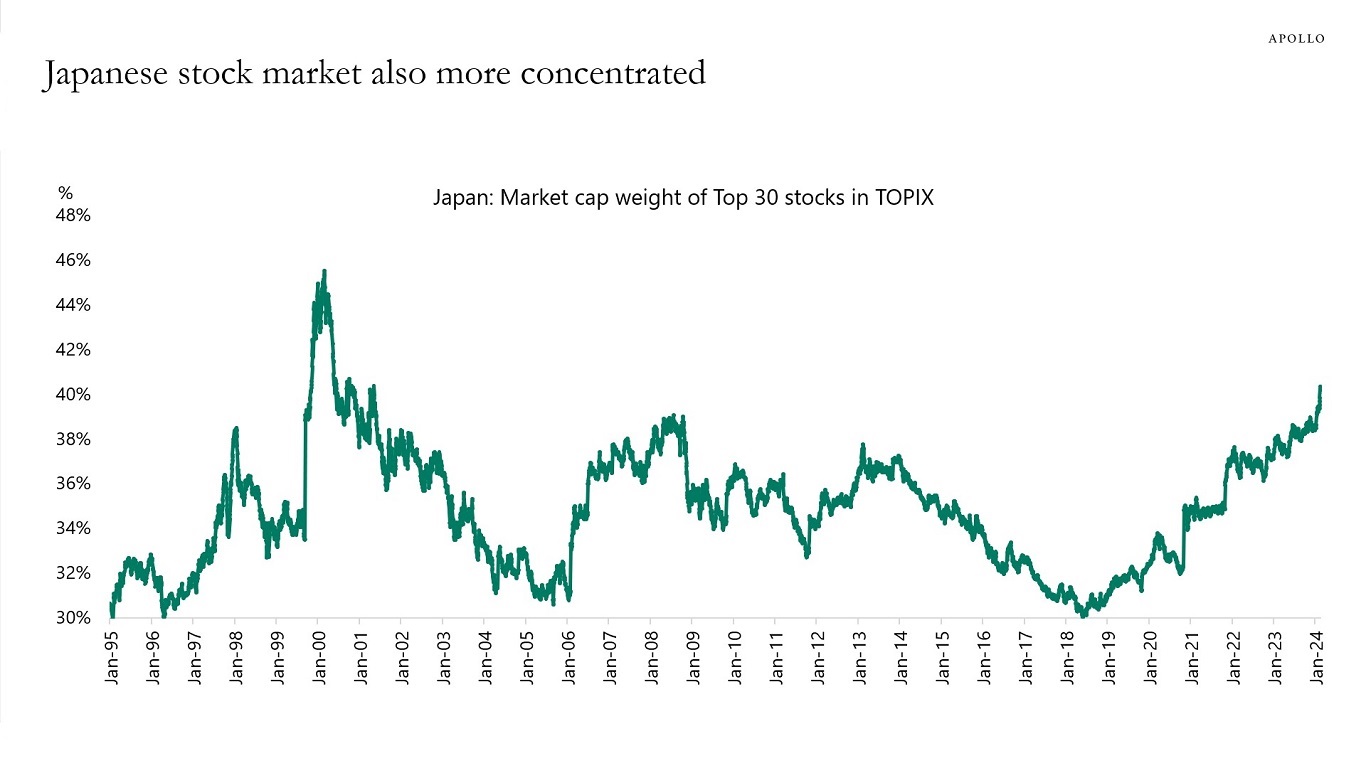
Source: Bloomberg, Apollo Chief Economist See important disclaimers at the bottom of the page.
-
The NFIB survey of small businesses asks 10,000 firms if they plan to increase selling prices over the next three months. The recent acceleration in the share of firms saying yes suggests that CPI inflation could increase over the coming months, see chart below.
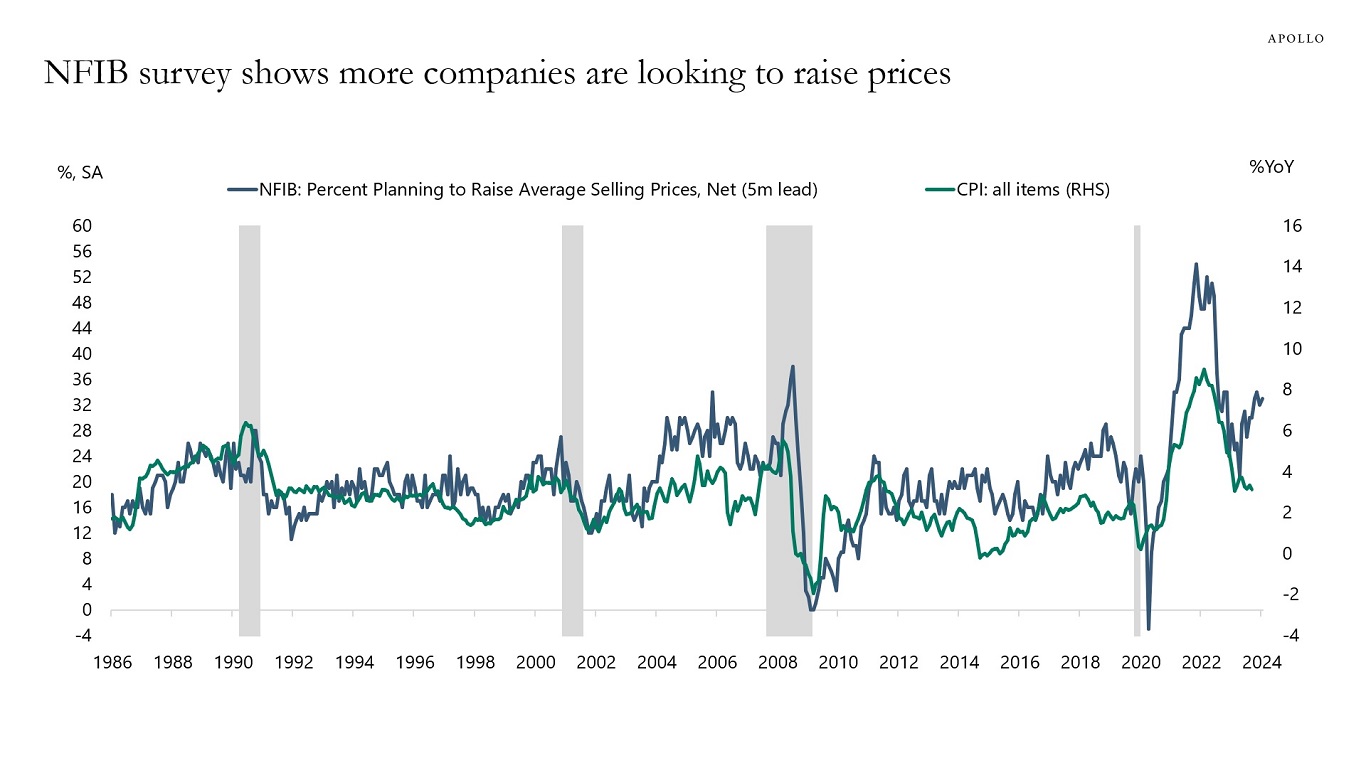
Source: NFIB, BEA, Haver Analytics, Apollo Chief Economist See important disclaimers at the bottom of the page.
-
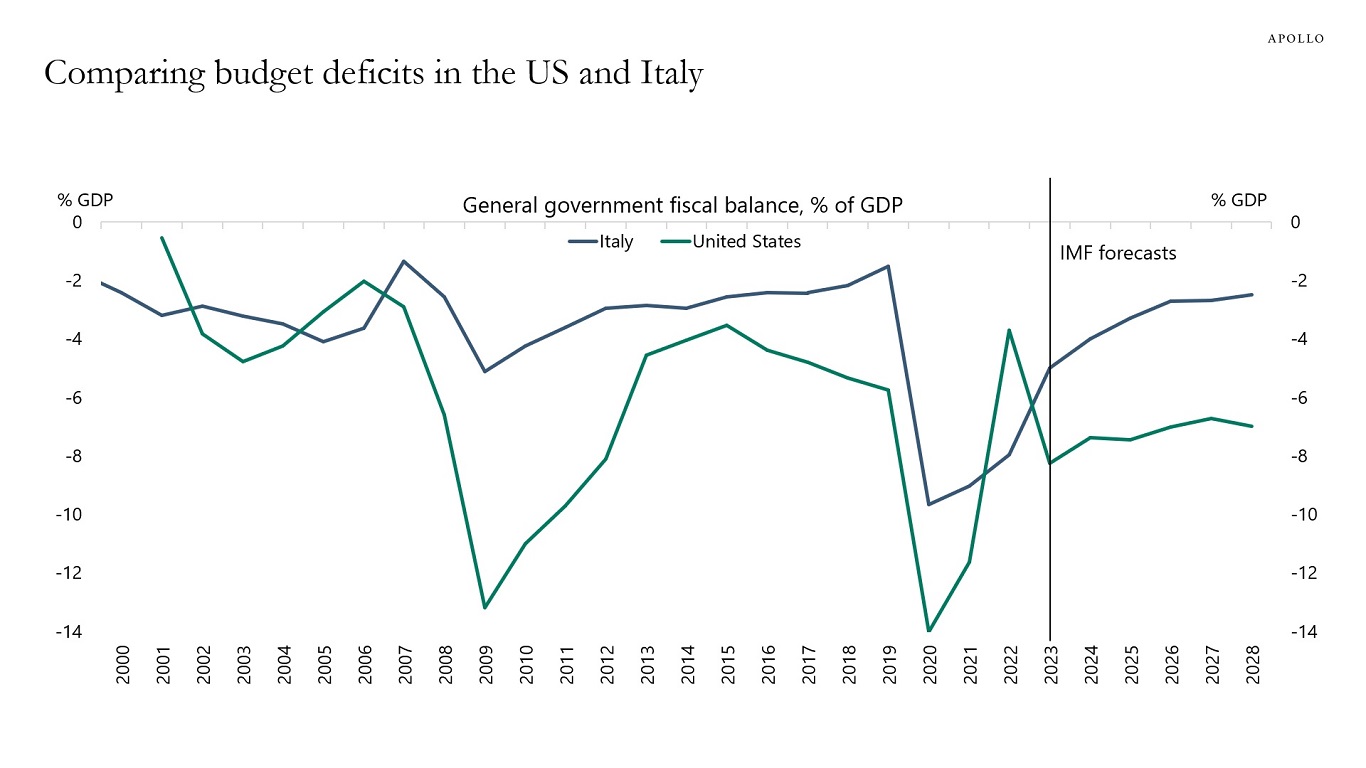
The government budget deficit is bigger in the US than in Italy, see the first chart.
Government debt levels are currently higher in Italy than in the US, but according to IMF forecasts, they are converging over the coming years, see the second chart.
Government net interest payments are similar in the US and Italy, see the third chart.
Despite these similarities, Italy has a BBB rating, and the US has a AAA rating.
If the US continues on the fiscal trajectory forecasted by the CBO, the risks are rising that the US will be downgraded later this year.
Source: IMF, Haver Analytics, Apollo Chief Economist 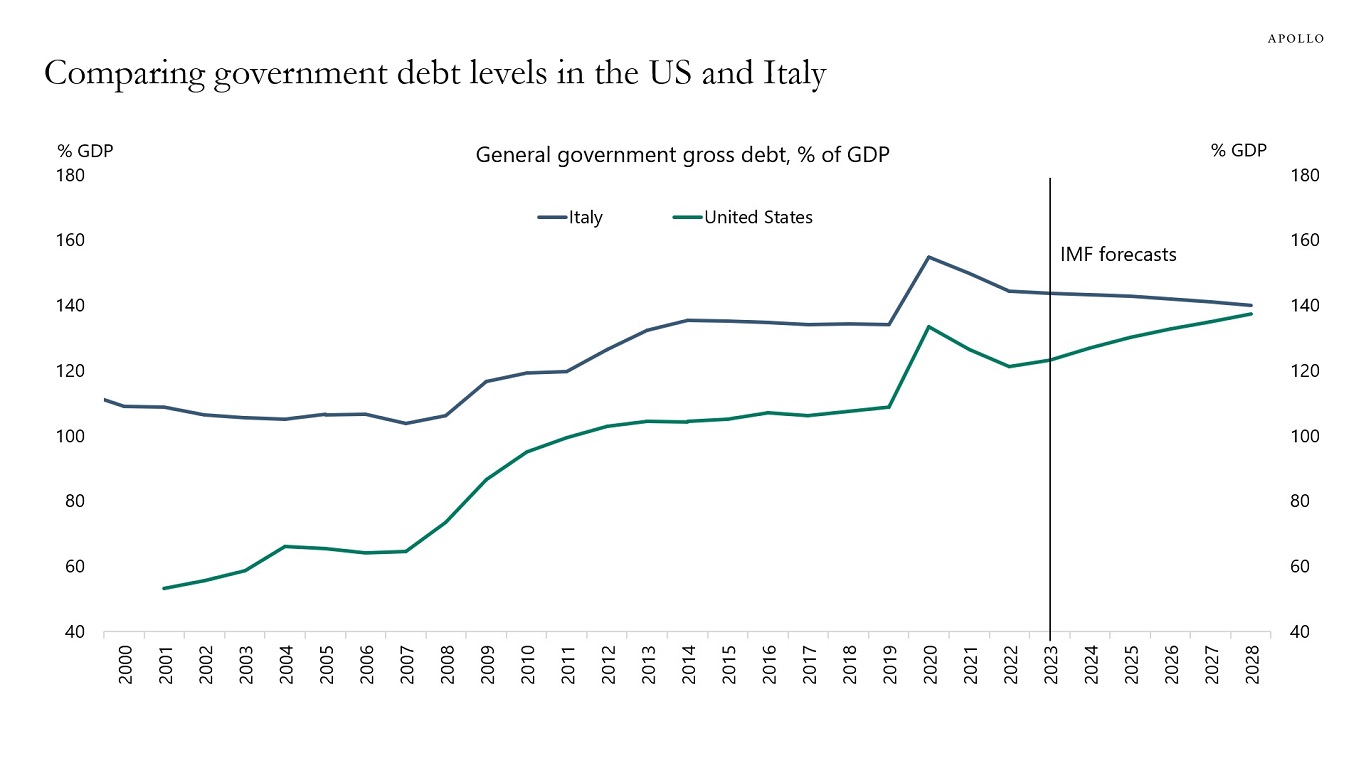
Source: IMF, Haver Analytics, Apollo Chief Economist 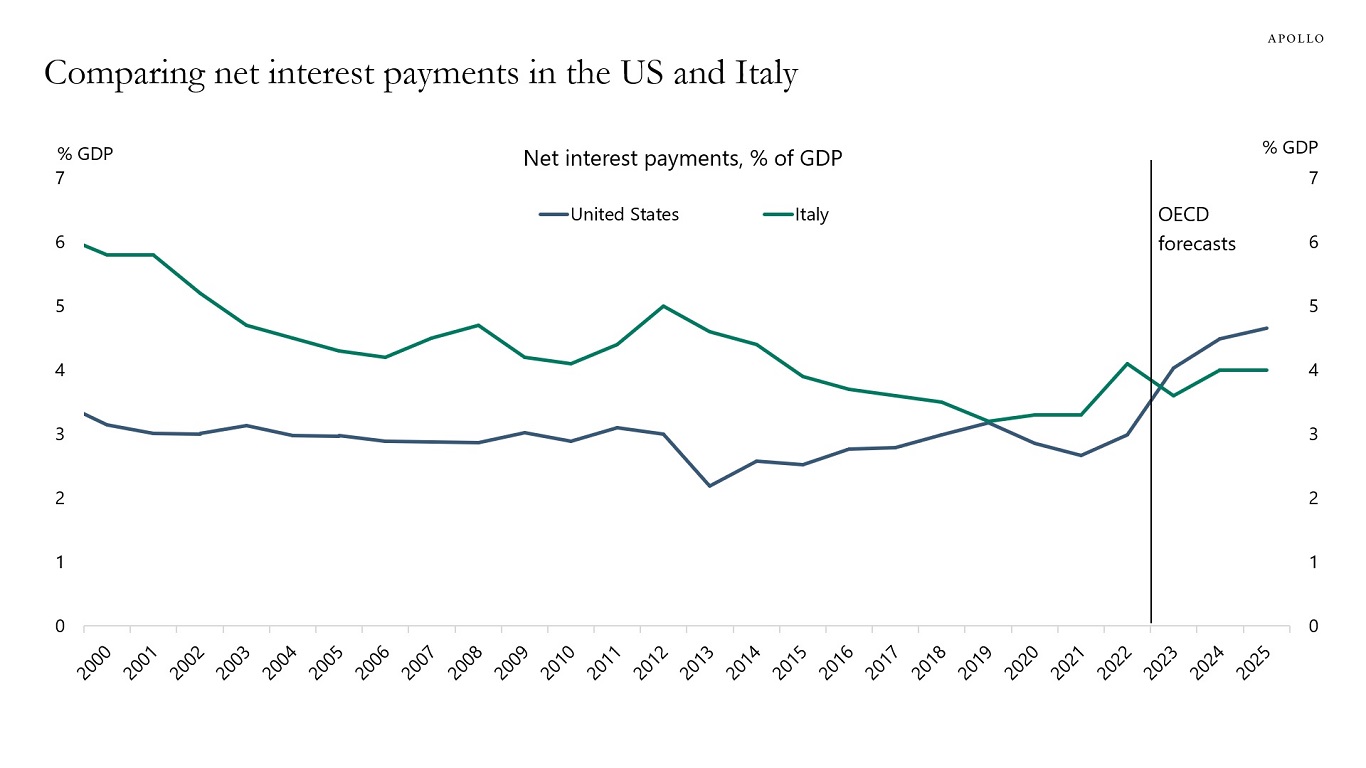
Source: OECD, Haver Analytics, Apollo Chief Economist See important disclaimers at the bottom of the page.
-
The top 10 companies in the S&P 500 today are more overvalued than the top 10 companies were during the tech bubble in the mid-1990s, see chart below.
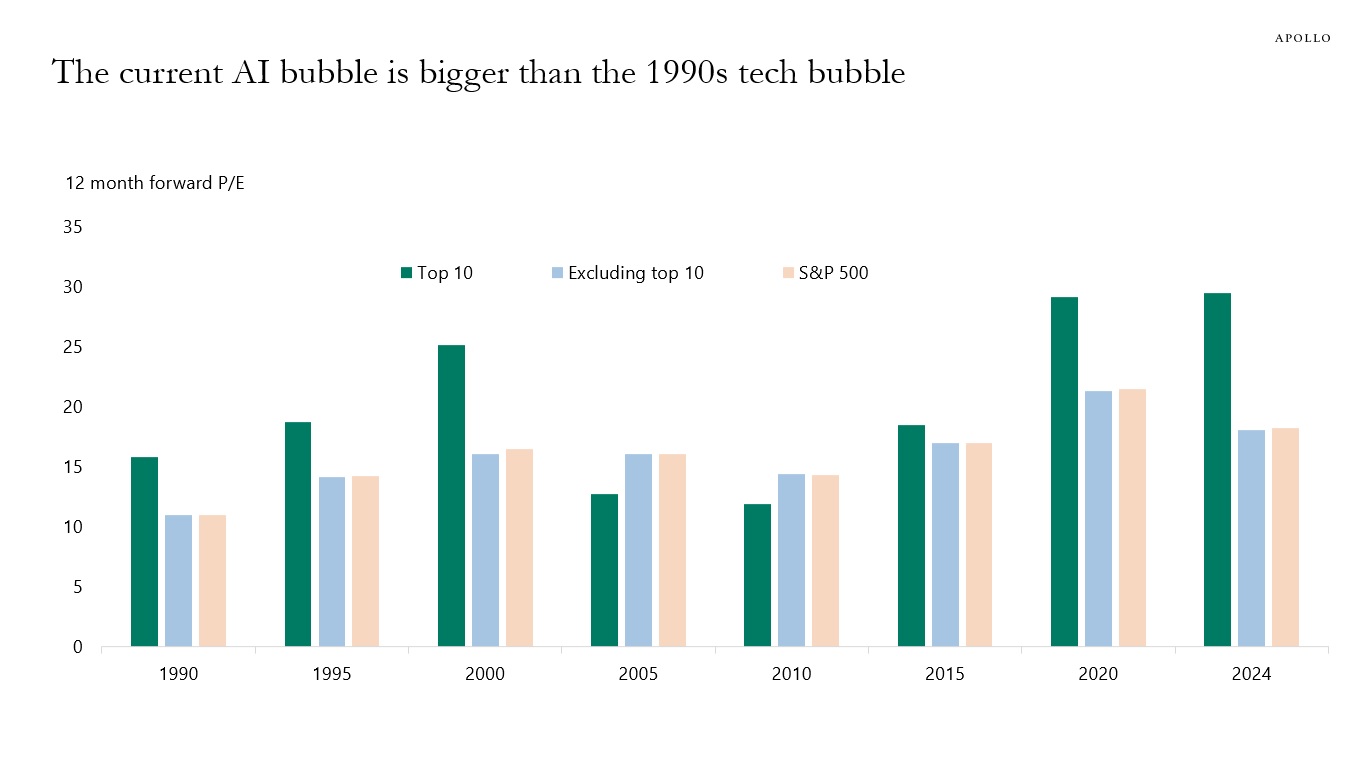
Source: Bloomberg, Apollo Chief Economist. Note: Data as of January 31, 2024. See important disclaimers at the bottom of the page.
-
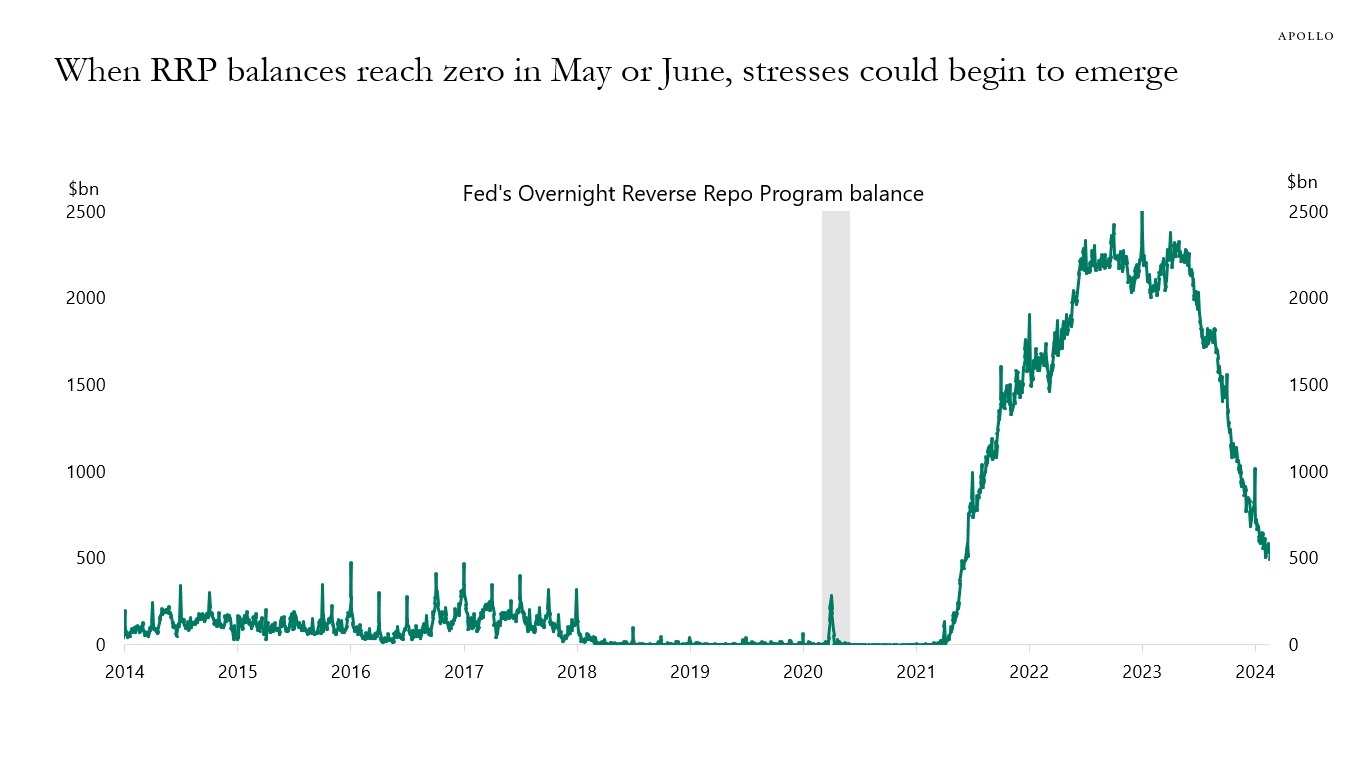
The Fed’s Reverse Repo Program (RRP) is a measure of excess reserves in the banking sector. If banks have excess cash, RRP balances go up and vice versa.
With Fed cuts on the horizon, there is an emerging debate about what will happen once RRP balances reach zero, in particular if QT continues, see chart below.
The worry is that once there are no longer abundant reserves in the banking sector, then reserves will be scarce, and the consequences could be less support for T-bills, duration, and credit markets, or stresses in money markets similar to what we saw in September 2019.
The bottom line is that credit investors should keep an eye on RRP balances because as they are depleted, we will find out if reserves in the banking sector are scarce, abundant, or ample.
In short, once RRP reaches zero in May or June, there may no longer be abundant reserves in the banking sector, which increases the probability of an accident somewhere in the plumbing of the financial system.
Source: FRBNY, Haver Analytics, Apollo Chief Economist See important disclaimers at the bottom of the page.
-
The share of total employment in large firms with more than 250 employees is bigger in the US than in Europe, see chart below.
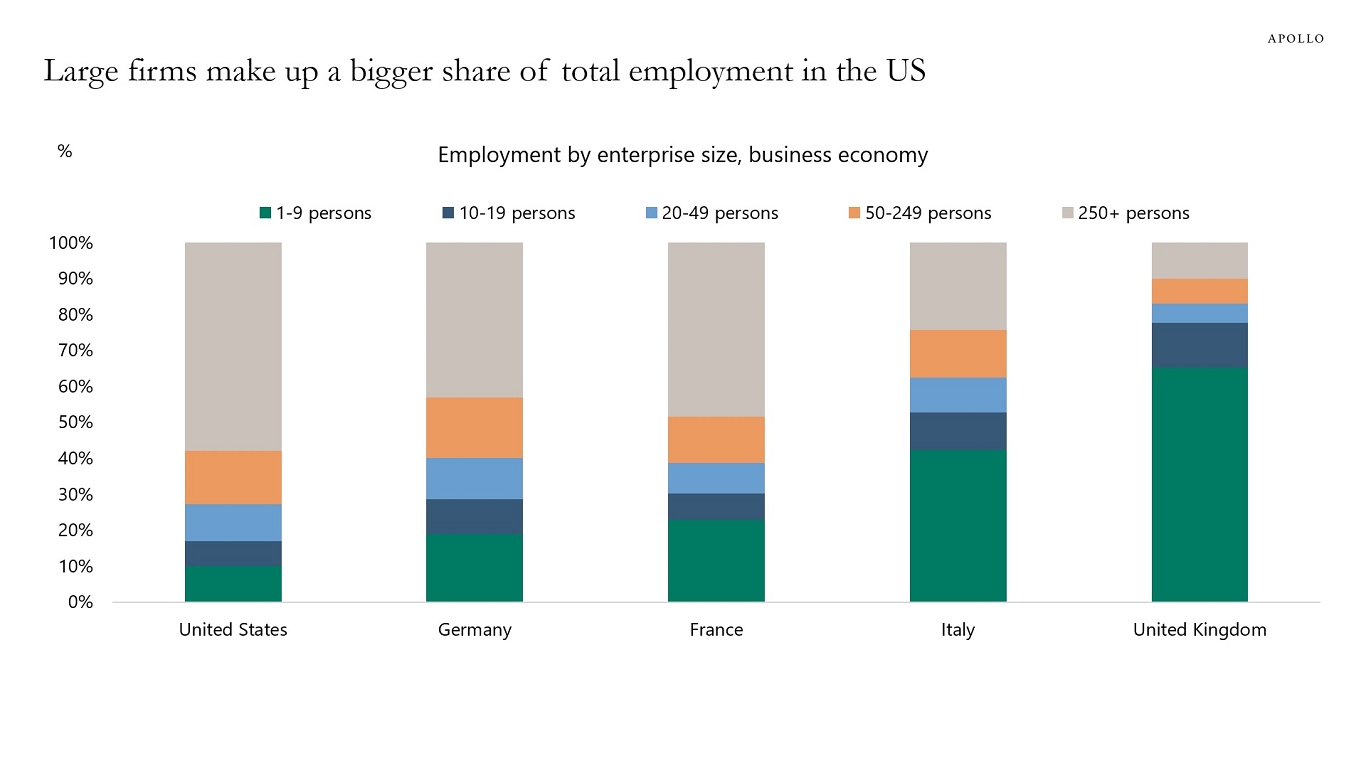
Source: OECD, Apollo Chief Economist. Note: Data as of 2020 or latest available. See important disclaimers at the bottom of the page.
-
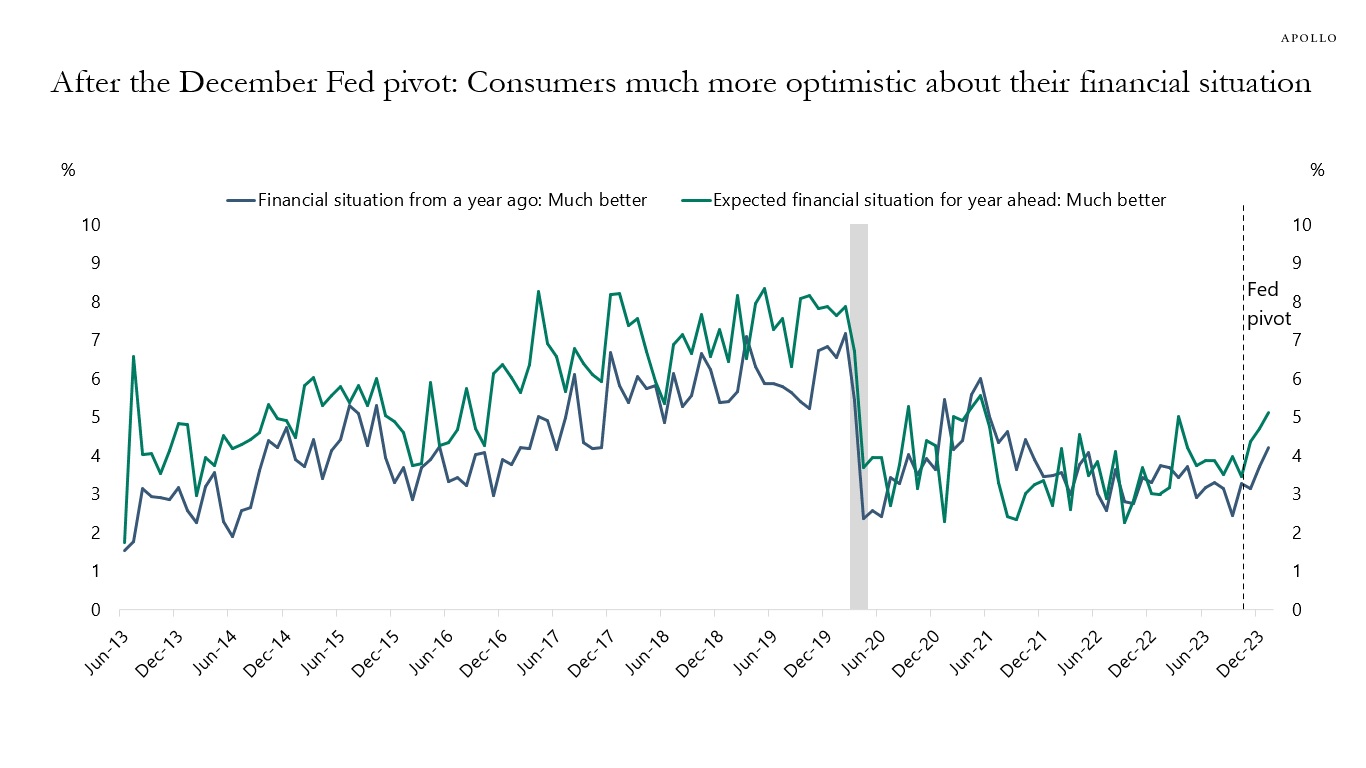
Since the Fed pivot on December 13, consumers have become much more optimistic about the economic outlook, see chart below. Combined with record-high IG issuance, high HY issuance, and more IPO and M&A activity since December, it is not surprising that employment and inflation rebounded in January and jobless claims remain low.
The last mile is harder not because of some structural feature in the economy, but because of the Fed turning dovish too soon, triggering a reacceleration in growth and inflation. That is why the Fed will keep rates higher for longer than markets expect.
Source: FRBNY, Haver Analytics, Apollo Chief Economist See important disclaimers at the bottom of the page.
-
The share of private consumption spent on services is still 2 percentage points below its pre-pandemic level, see chart below.
The implication for markets is that there is still more upside for growth in consumer services, i.e., spending on airlines, hotels, restaurants, concerts, sporting events, etc.
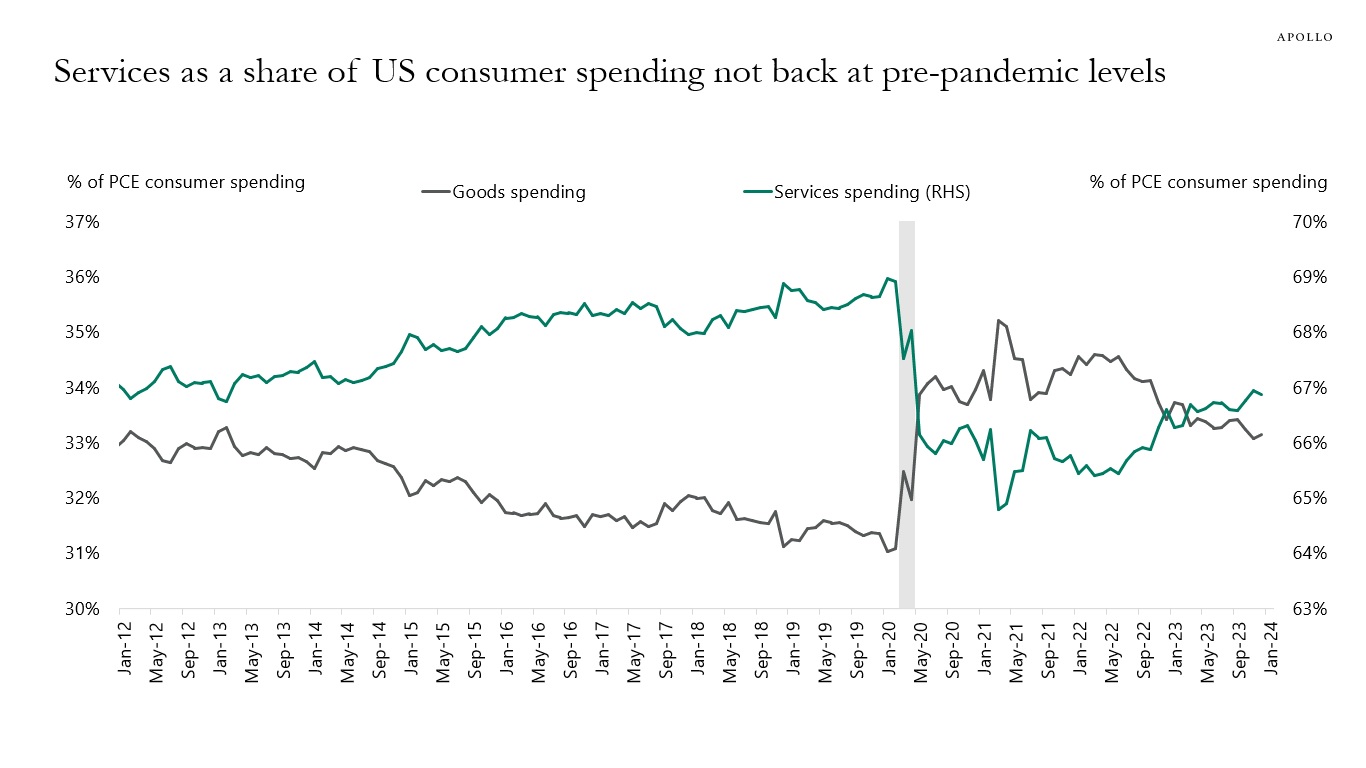
Source: BEA, Haver Analytics, Apollo Chief Economist See important disclaimers at the bottom of the page.
-
US households are less and less mobile, and after the Fed started raising rates, the self-reported probability of moving residence started trending down again, see charts below.
A less mobile labor force will ultimately have negative consequences for GDP growth because workers with relevant skills do not move to regions with job growth. This is what we see in Europe, where language barriers limit mobility between regions in the euro area.
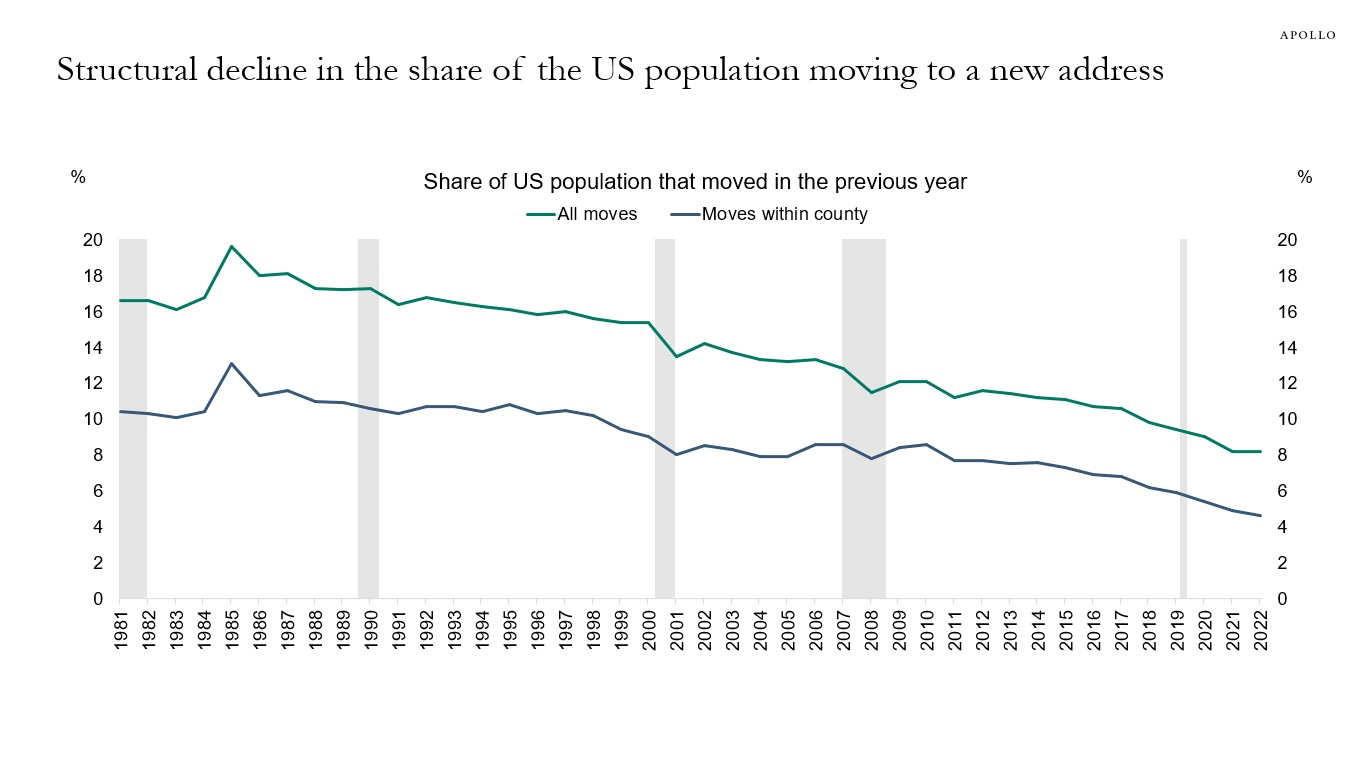
Source: Census CPS, Apollo Chief Economist 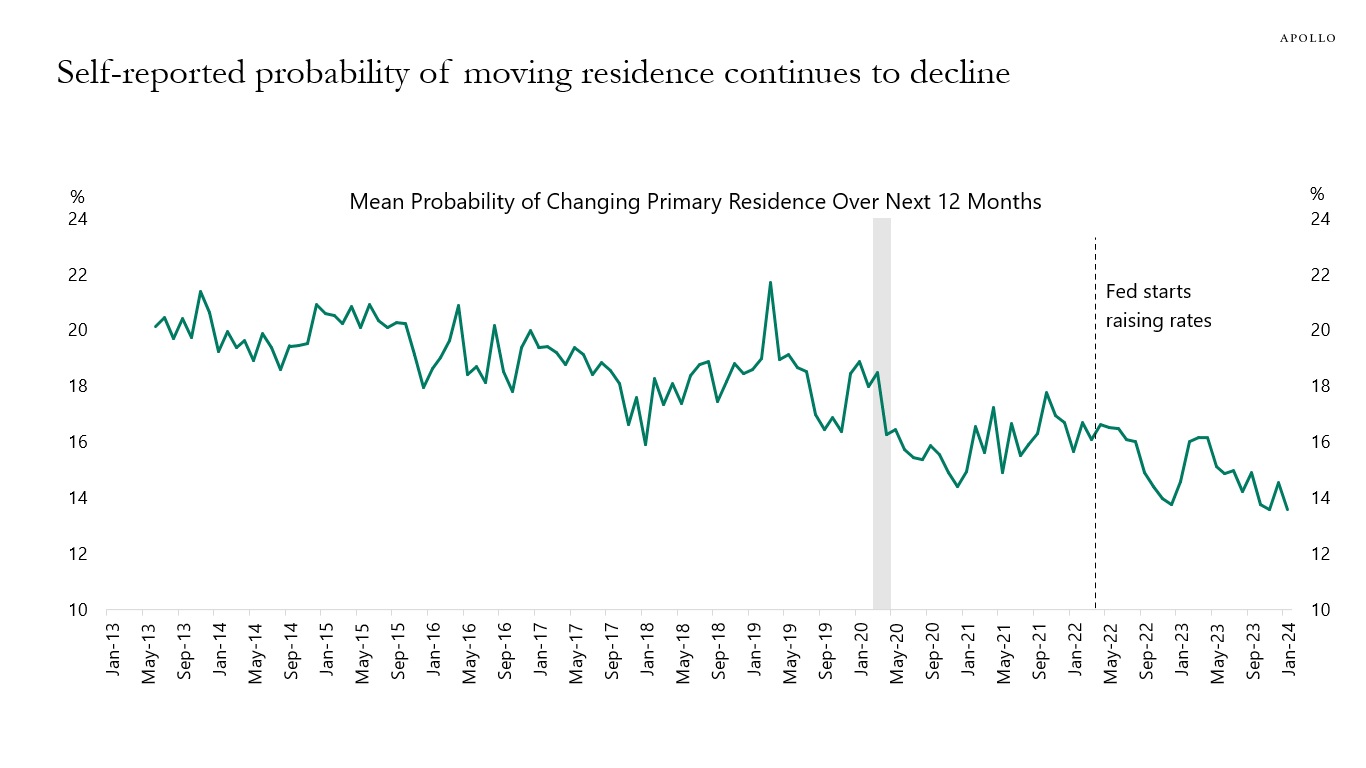
Source: FRBNY, Haver Analytics, Apollo Chief Economist. Note: Data is “self-reported” about the expectation from households. See important disclaimers at the bottom of the page.

This presentation may not be distributed, transmitted or otherwise communicated to others in whole or in part without the express consent of Apollo Global Management, Inc. (together with its subsidiaries, “Apollo”).
Apollo makes no representation or warranty, expressed or implied, with respect to the accuracy, reasonableness, or completeness of any of the statements made during this presentation, including, but not limited to, statements obtained from third parties. Opinions, estimates and projections constitute the current judgment of the speaker as of the date indicated. They do not necessarily reflect the views and opinions of Apollo and are subject to change at any time without notice. Apollo does not have any responsibility to update this presentation to account for such changes. There can be no assurance that any trends discussed during this presentation will continue.
Statements made throughout this presentation are not intended to provide, and should not be relied upon for, accounting, legal or tax advice and do not constitute an investment recommendation or investment advice. Investors should make an independent investigation of the information discussed during this presentation, including consulting their tax, legal, accounting or other advisors about such information. Apollo does not act for you and is not responsible for providing you with the protections afforded to its clients. This presentation does not constitute an offer to sell, or the solicitation of an offer to buy, any security, product or service, including interest in any investment product or fund or account managed or advised by Apollo.
Certain statements made throughout this presentation may be “forward-looking” in nature. Due to various risks and uncertainties, actual events or results may differ materially from those reflected or contemplated in such forward-looking information. As such, undue reliance should not be placed on such statements. Forward-looking statements may be identified by the use of terminology including, but not limited to, “may”, “will”, “should”, “expect”, “anticipate”, “target”, “project”, “estimate”, “intend”, “continue” or “believe” or the negatives thereof or other variations thereon or comparable terminology.