


Want it delivered daily to your inbox?
-
Small businesses are reporting it is harder to get a loan, and that normally means lower bank lending growth over the following 12 months, see chart below.
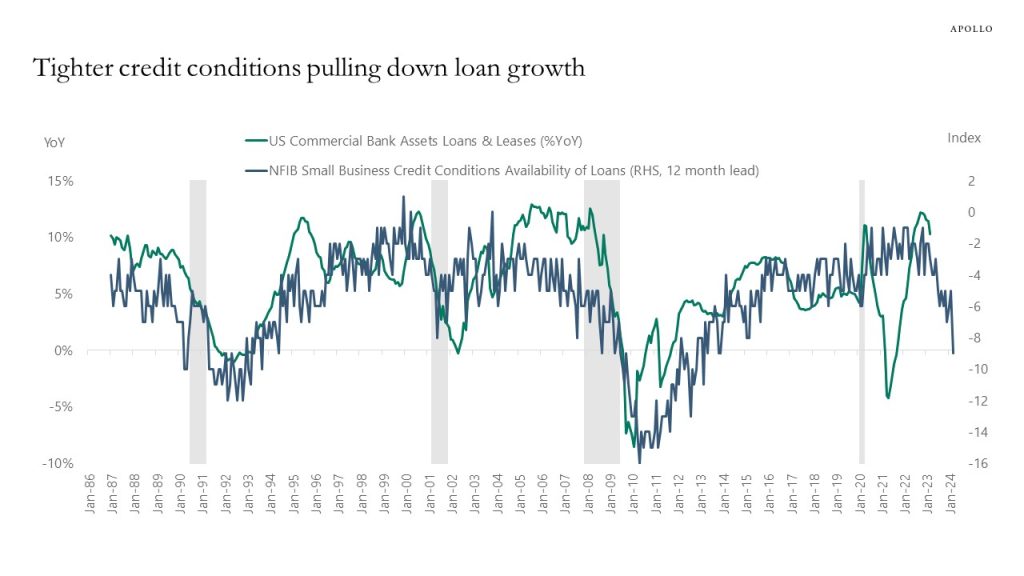
Source: NFIB, FRB, Bloomberg, Apollo Chief Economist See important disclaimers at the bottom of the page.
-
The occupancy rate for hotels in Las Vegas is not showing signs of weakness in consumer services, see chart below.
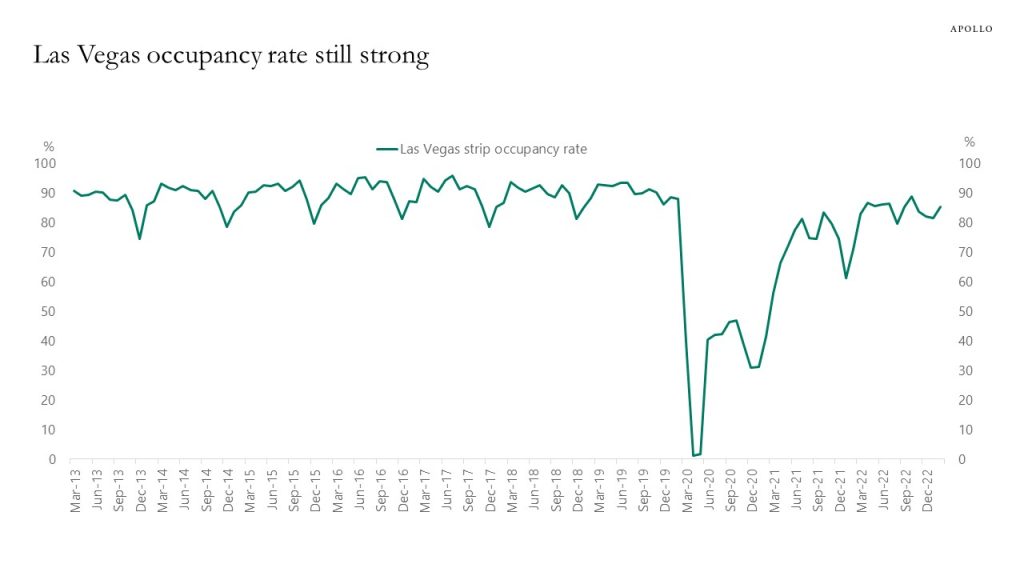
Source: Las Vegas Convention and Visitors Authority, Bloomberg, Apollo Chief Economist See important disclaimers at the bottom of the page.
-
Running the Fed minutes through a natural language processing model shows that the Fed is starting to turn more dovish, see chart below, suggesting that we are approaching the peak in this rate hike cycle and that the Fed is worrying less about inflation and more about the tighter credit conditions and the associated ongoing slowdown in growth.
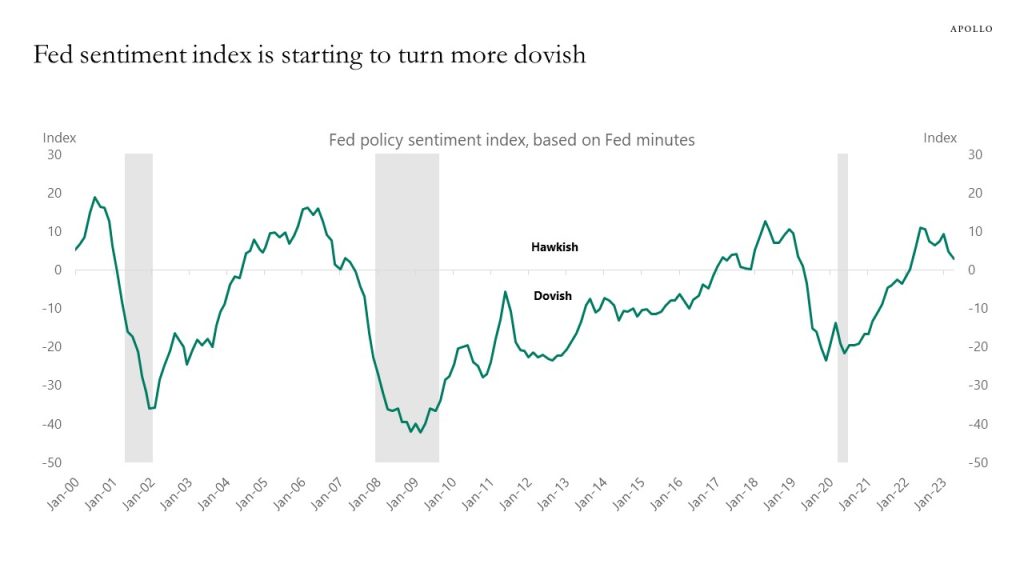
Source: Bloomberg (ticker BIFIFEDA), Apollo Chief Economist. Note: Methodology: Bloomberg’s Federal Reserve natural language processing model calculates a score for the opening statement of the FOMC meeting starting in April 2011. The model uses a neural network to predict the dovishness vs. hawkishness of a sentence. Weights are applied for more or less participant consensus (e.g. “some participants” vs “all participants”). The final score is a weighted ratio of dovish vs. hawkish sentences. Positive scores are hawkish and negative scores are dovish. See important disclaimers at the bottom of the page.
-
None of the indicators the NBER recession committee normally looks at suggest that we are in a recession at the moment, see chart below.
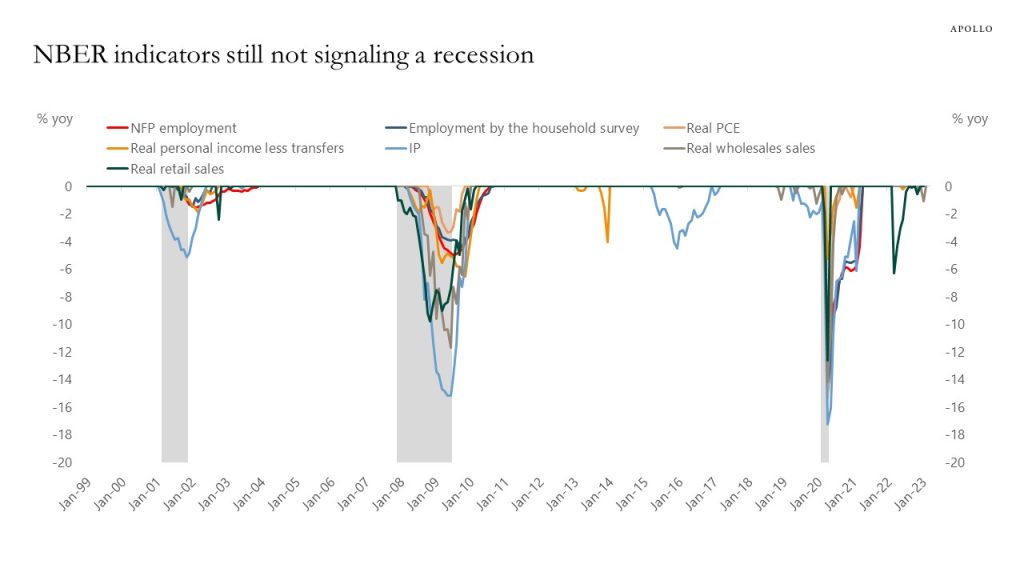
Source: Bloomberg, Apollo Chief Economist See important disclaimers at the bottom of the page.
-
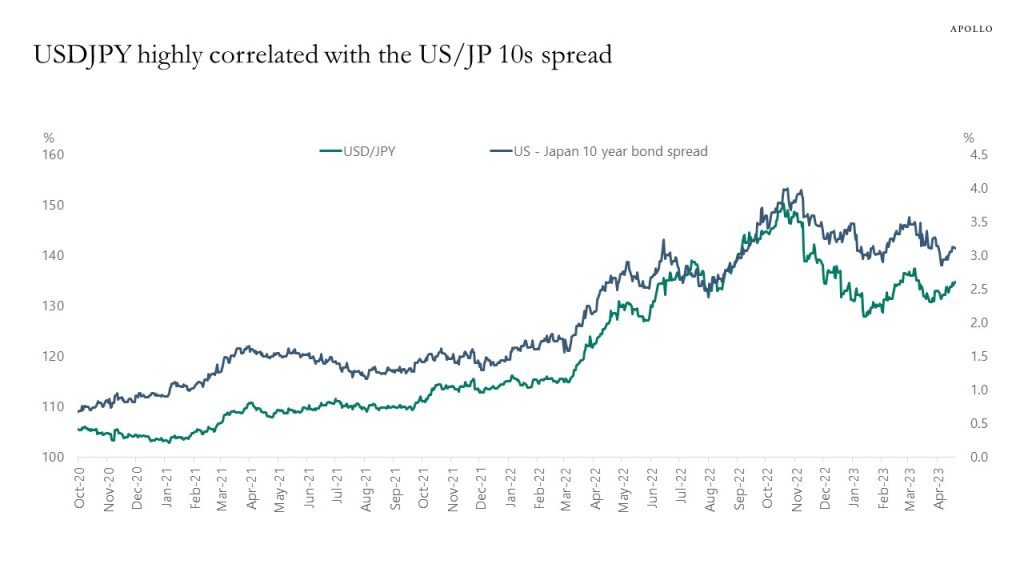
USDJPY is highly correlated with the spread between 10-year interest rates in Japan and the US, and if the BoJ abandons YCC, then we could see a significant appreciation of the yen as Japanese investors move money back from the US and Europe to higher-yielding fixed income in Japan. With inflation in Japan sticky above the 2% inflation target, there is a significant risk that the BoJ could exit YCC within the next six months.
Source: Bloomberg, Apollo Chief Economist See important disclaimers at the bottom of the page.
-
Data from downtowns show that cellphone activity in San Francisco is at 31% of pre-pandemic levels, see chart below. New York is at 74% and Chicago is at 50% of 2019 levels. Boston is at 54% of pre-pandemic levels. This has implications for retail, restaurants, and office.
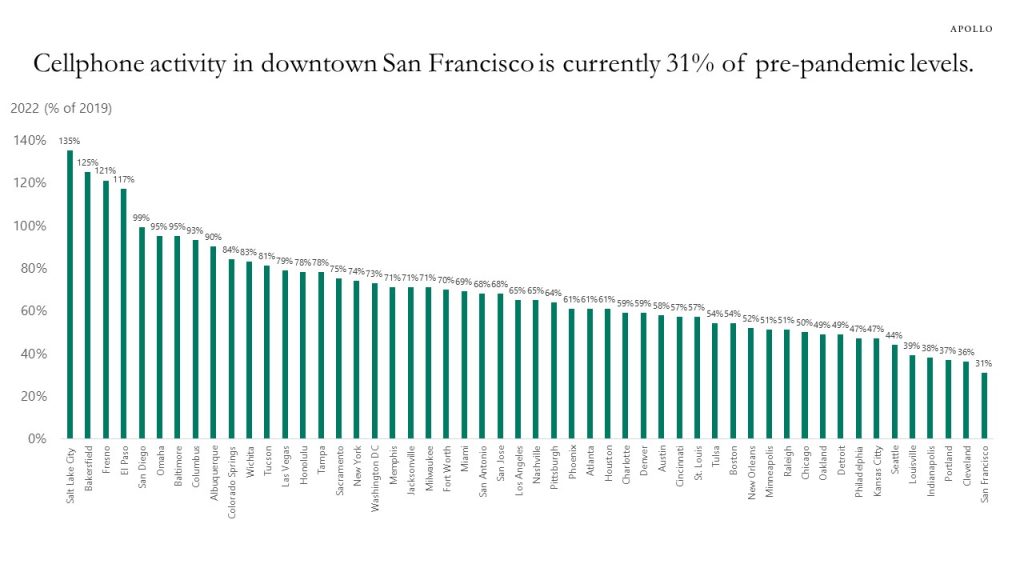
Source: University of Toronto School of Cities, Apollo Chief Economist. The data compares Fall of 2022 (Sep to Nov) to Fall of 2019. For more see downtownrecovery.com. See important disclaimers at the bottom of the page.
-
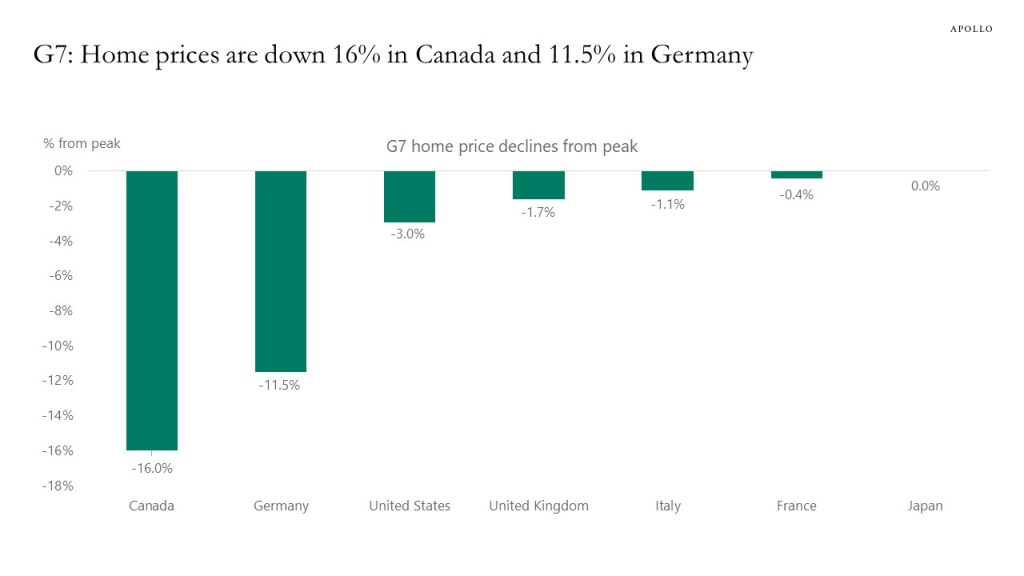
Home prices are down more in Canada and Germany than in other G7 countries, see chart below.
Source: BIS, Canadian Real Estate Association, Eurostat, Eurospace, UK Land Registry, S&P Corelogic, Bloomberg, Apollo Chief Economist See important disclaimers at the bottom of the page.
-
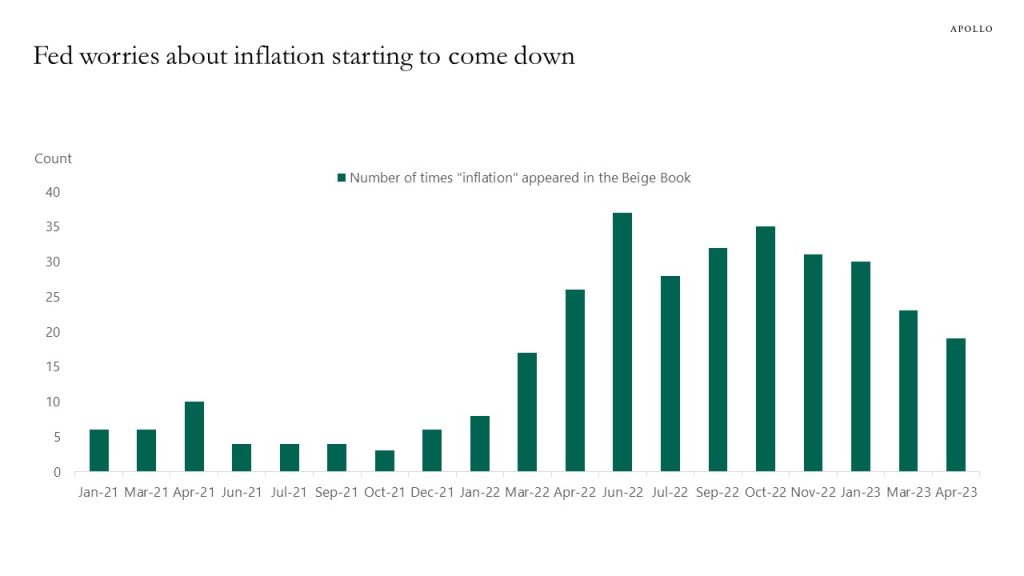
Counting how many times the words “inflation” and “banks” appear in the Fed’s Beige Book shows that the Fed is starting to focus more on banks and credit conditions and less on inflation, see charts below.
Source: Federal Reserve Board, Apollo Chief Economist 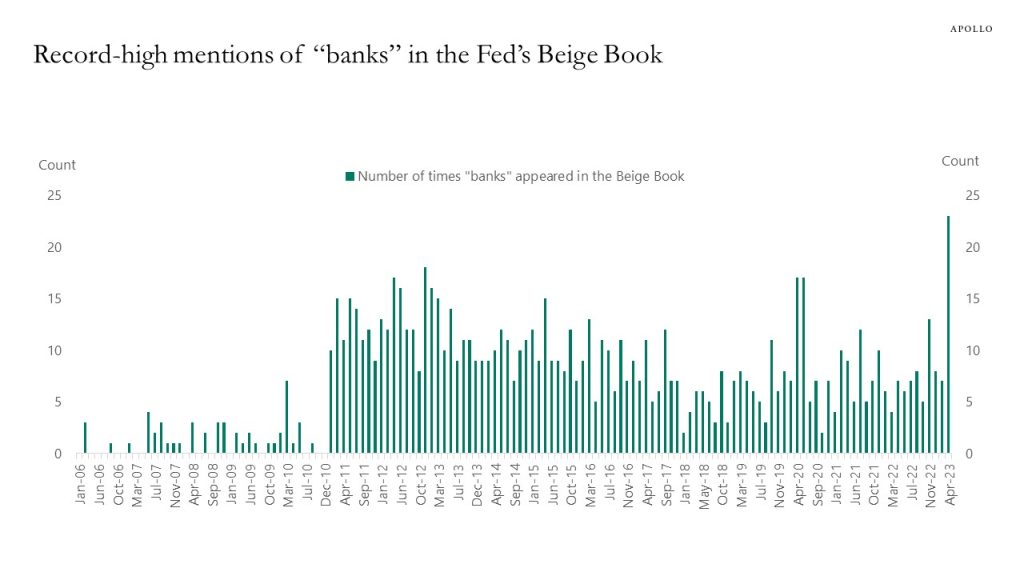
Source: Federal Reserve Board, Apollo Chief Economist See important disclaimers at the bottom of the page.
-
The Fed is trying to slow down hiring to dampen the upward pressure on wage and consumer price inflation, but cooling down the labor market takes time, and while corporate worries about labor shortages have declined, they are still well above pre-pandemic levels, see chart below.
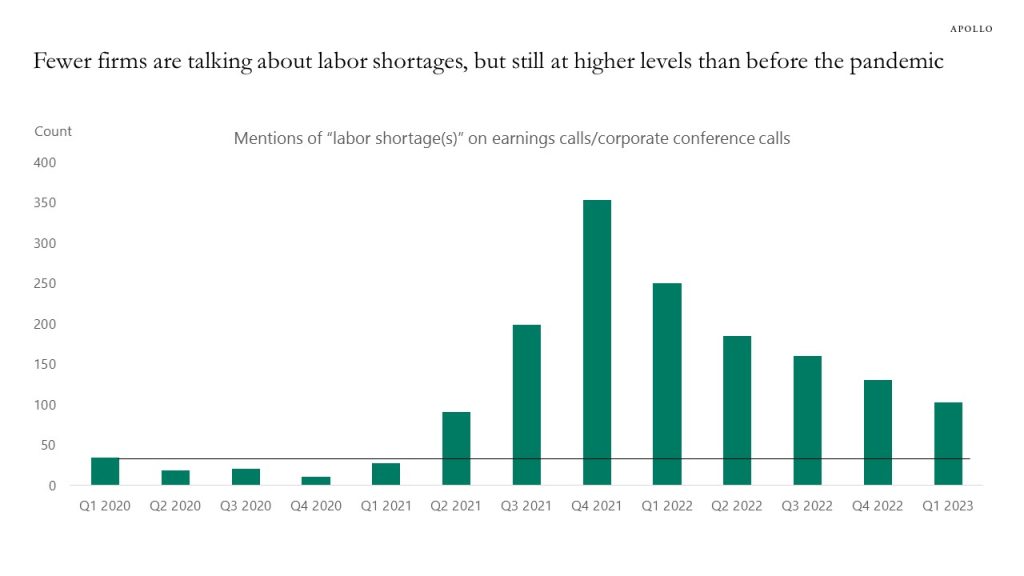
Source: Bloomberg/Michael McDonough, Apollo Chief Economist. Note: Search includes earnings calls, conference presentation calls, shareholder management calls, guidance calls, M&A calls, and sales results calls. See important disclaimers at the bottom of the page.
-
US households are in excellent shape, the ratio of liabilities to net wealth has declined 50% since the 2008 financial crisis, and household leverage is currently at levels last seen in the early 1980s, see chart below. If the unemployment rate rises, consumer spending will slow down, but the starting point for US households is very strong.
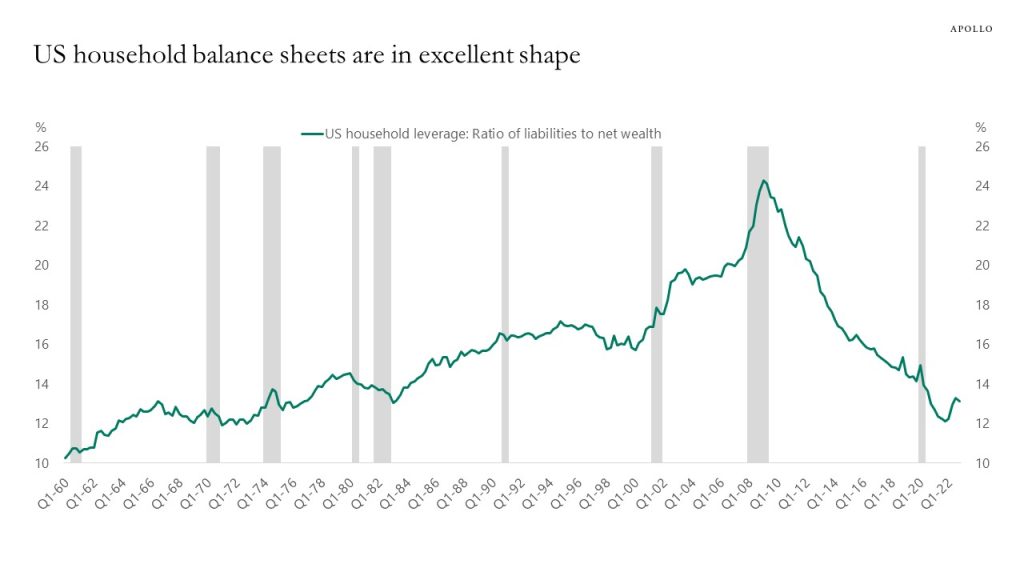
Source: FFUNDS, Haver Analytics, Apollo Chief Economist See important disclaimers at the bottom of the page.

This presentation may not be distributed, transmitted or otherwise communicated to others in whole or in part without the express consent of Apollo Global Management, Inc. (together with its subsidiaries, “Apollo”).
Apollo makes no representation or warranty, expressed or implied, with respect to the accuracy, reasonableness, or completeness of any of the statements made during this presentation, including, but not limited to, statements obtained from third parties. Opinions, estimates and projections constitute the current judgment of the speaker as of the date indicated. They do not necessarily reflect the views and opinions of Apollo and are subject to change at any time without notice. Apollo does not have any responsibility to update this presentation to account for such changes. There can be no assurance that any trends discussed during this presentation will continue.
Statements made throughout this presentation are not intended to provide, and should not be relied upon for, accounting, legal or tax advice and do not constitute an investment recommendation or investment advice. Investors should make an independent investigation of the information discussed during this presentation, including consulting their tax, legal, accounting or other advisors about such information. Apollo does not act for you and is not responsible for providing you with the protections afforded to its clients. This presentation does not constitute an offer to sell, or the solicitation of an offer to buy, any security, product or service, including interest in any investment product or fund or account managed or advised by Apollo.
Certain statements made throughout this presentation may be “forward-looking” in nature. Due to various risks and uncertainties, actual events or results may differ materially from those reflected or contemplated in such forward-looking information. As such, undue reliance should not be placed on such statements. Forward-looking statements may be identified by the use of terminology including, but not limited to, “may”, “will”, “should”, “expect”, “anticipate”, “target”, “project”, “estimate”, “intend”, “continue” or “believe” or the negatives thereof or other variations thereon or comparable terminology.