


Want it delivered daily to your inbox?
-
The IMF is forecasting a recession in the UK and Germany, and close to potential growth in the US, which on its own would argue for a stronger dollar, see chart below.
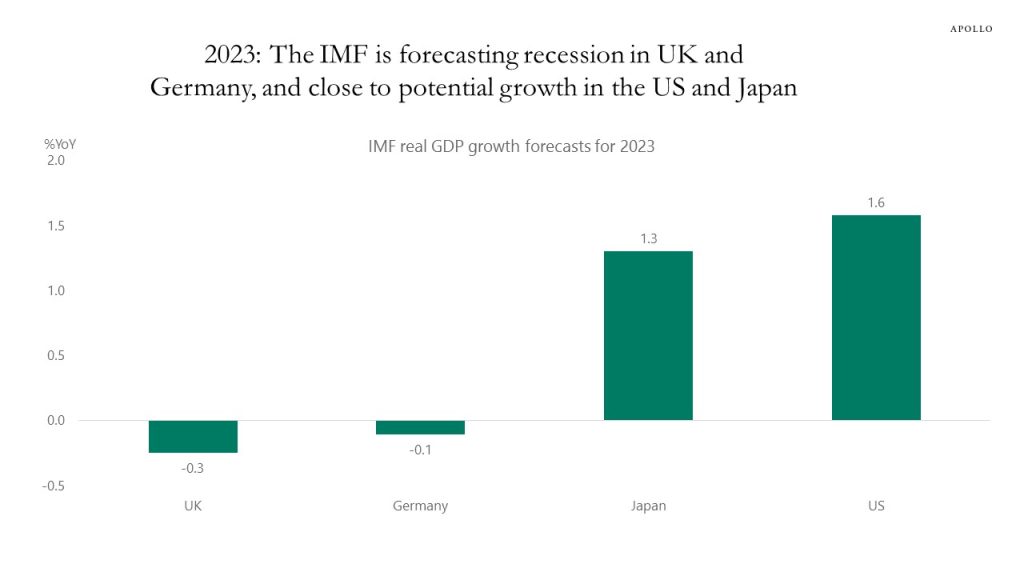
Source: IMF WEO, Haver Analytics, Apollo Chief Economist See important disclaimers at the bottom of the page.
-
Hotel demand has slowed down in recent weeks, occupancy rates, RevPAR, and daily rates have started moving lower, see chart below.
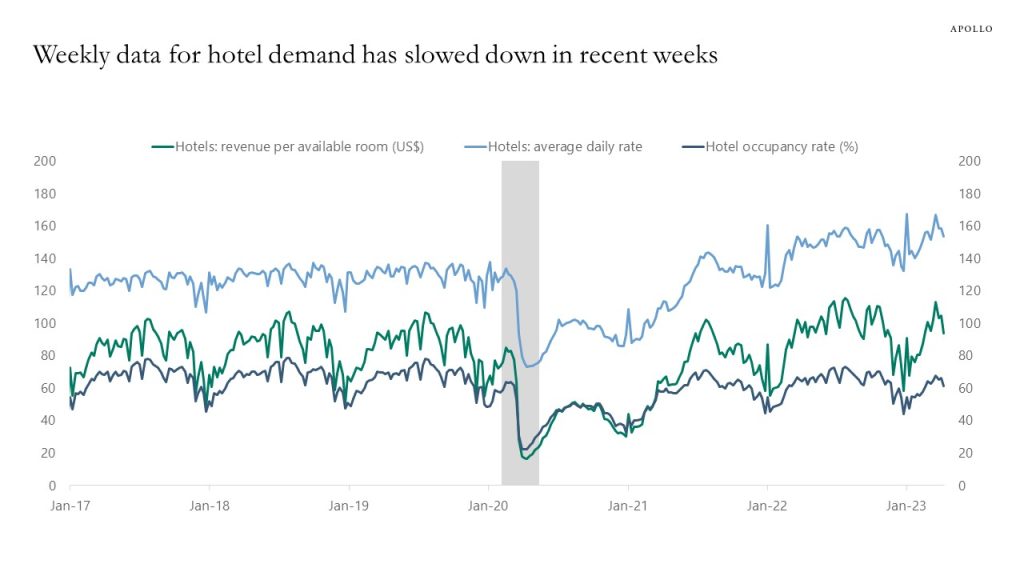
Source: STR, Haver Analytics, Apollo Chief Economist See important disclaimers at the bottom of the page.
-
There are no signs of weakness in movie theater visits, the weekly data for box office grosses is rising and now above pre-pandemic levels, see chart below.
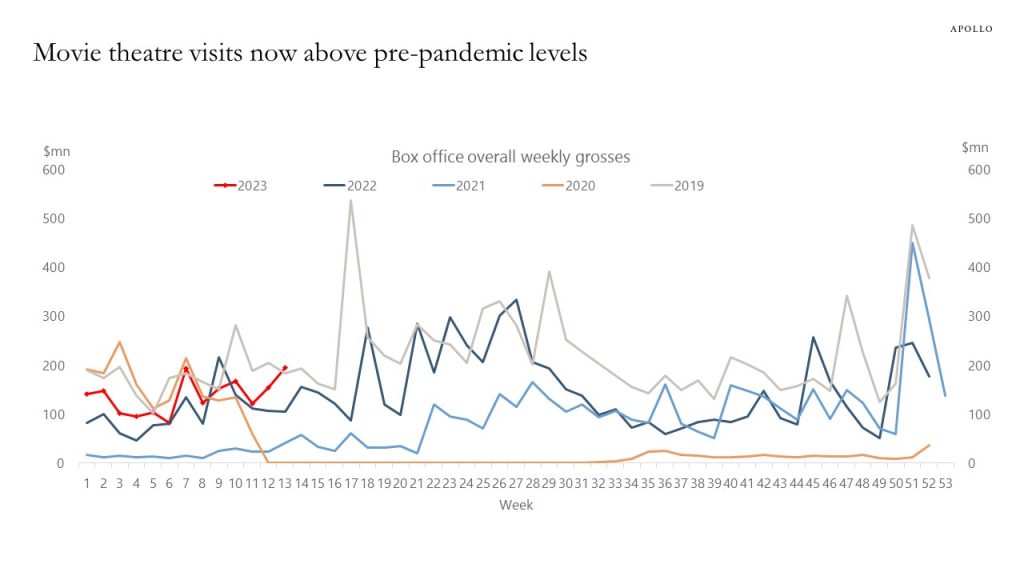
Source: Boxofficemojo.com, Apollo Chief Economist See important disclaimers at the bottom of the page.
-
Weekly data shows that the number of people going to Broadway shows continues to rise. No signs of a slowdown in household consumption of this type of luxury consumer spending.
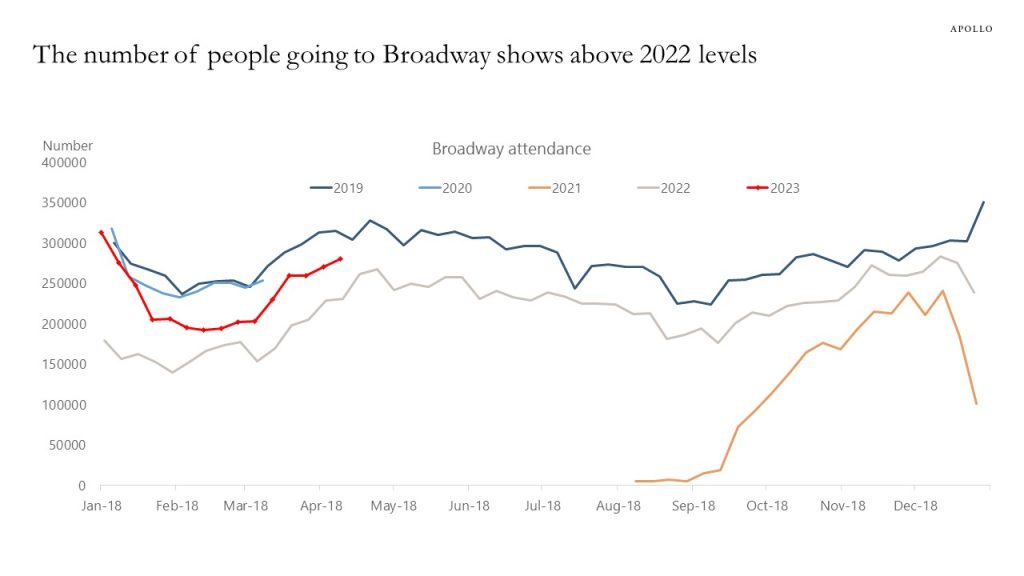
Source: Internet Broadway Database, Apollo Chief Economist See important disclaimers at the bottom of the page.
-
Office occupancy rates have moved sideways for the past six months, and with hybrid work models now well-established, a 50% occupancy rate may be the new permanent level in most metropolitan areas, see chart below.
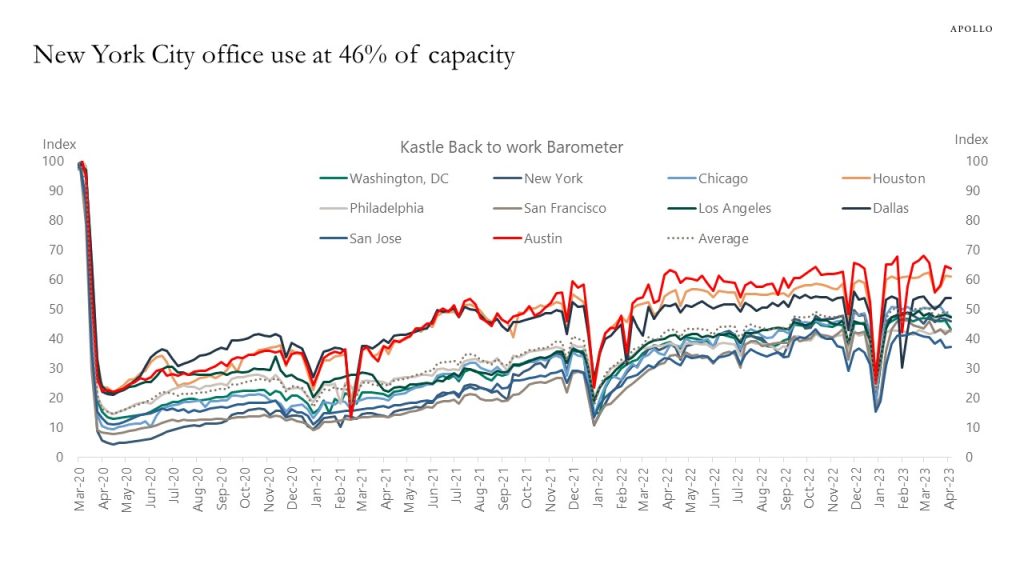
Source: Bloomberg, Apollo Chief Economist See important disclaimers at the bottom of the page.
-
Data for leveraged loan default rates and bankruptcy filings show that a default cycle has started, see charts below.
This is not surprising. The entire goal of the Fed with raising interest rates is to slow the economy down to slow down inflation, and adding tighter bank lending standards increases the risk that the slowdown could come faster.
Our latest credit market outlook is available here.
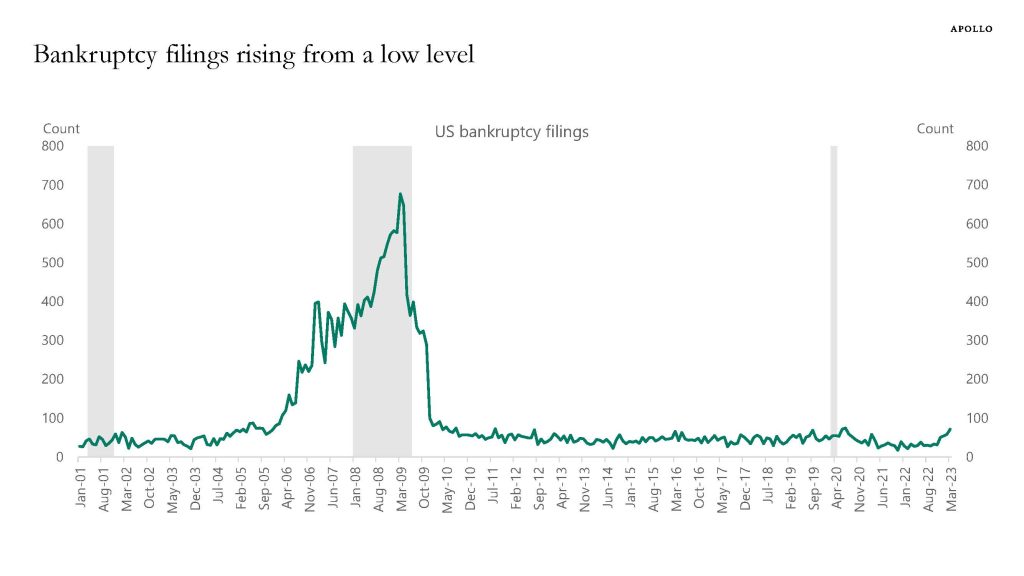
Source: S&P Capital IQ, Bloomberg, Apollo Chief Economist. Note: Bankruptcy figures include public companies or private companies with public debt with a minimum of $2 million in assets or liabilities at the time of filing, in addition to private companies with at least $10 million in assets or liabilities. 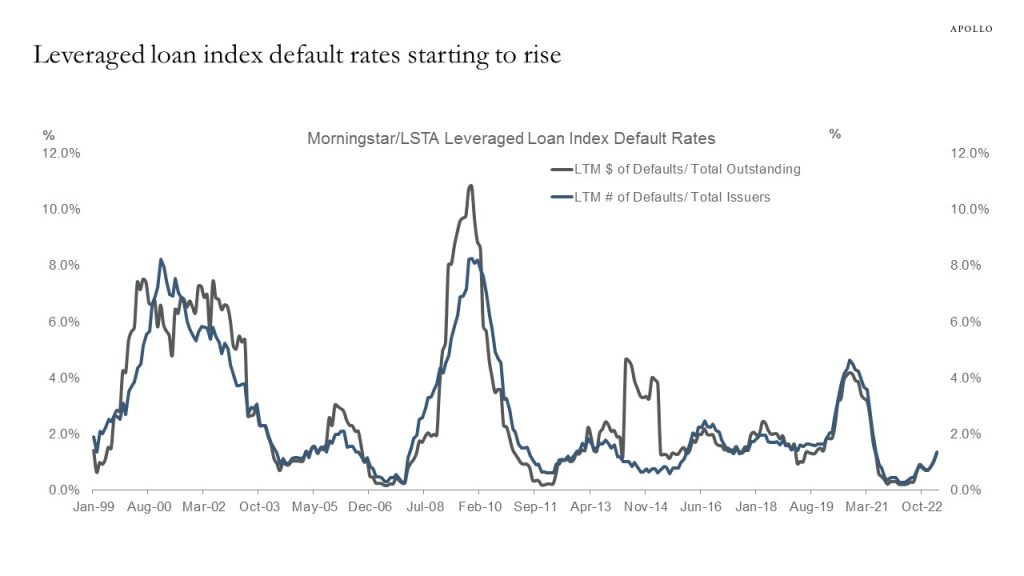
Source: Pitchbook LCD, Apollo Chief Economist See important disclaimers at the bottom of the page.
-
Credit conditions have tightened significantly for small businesses after SVB failed, and firms with less than 500 employees account for almost 50% of total employment in the US economy, see charts below. Small businesses borrow from small banks, and it is getting more difficult to argue that the banking crisis is not having a negative impact on the economy.
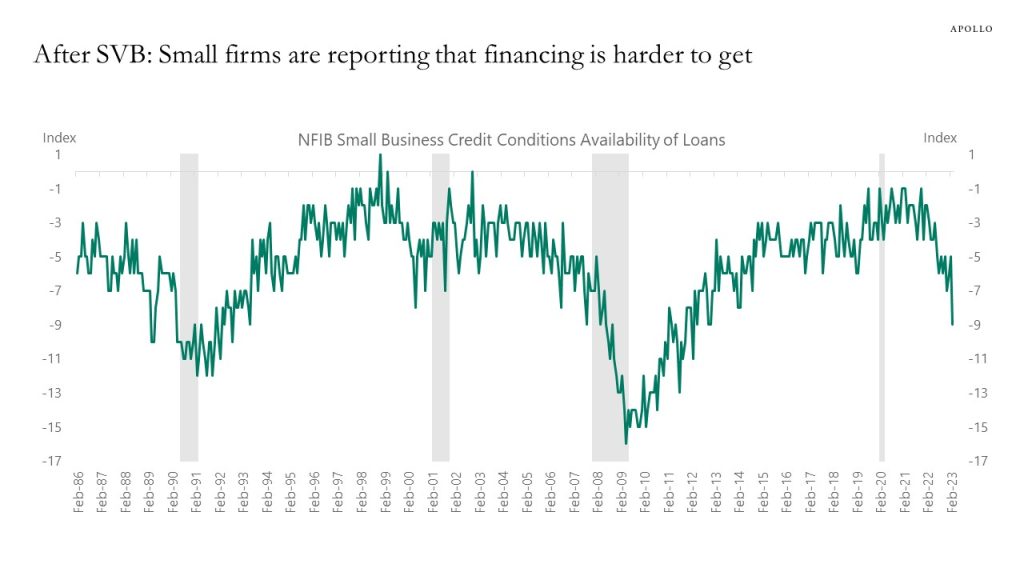
Source: NFIB, Bloomberg, Apollo Chief Economist 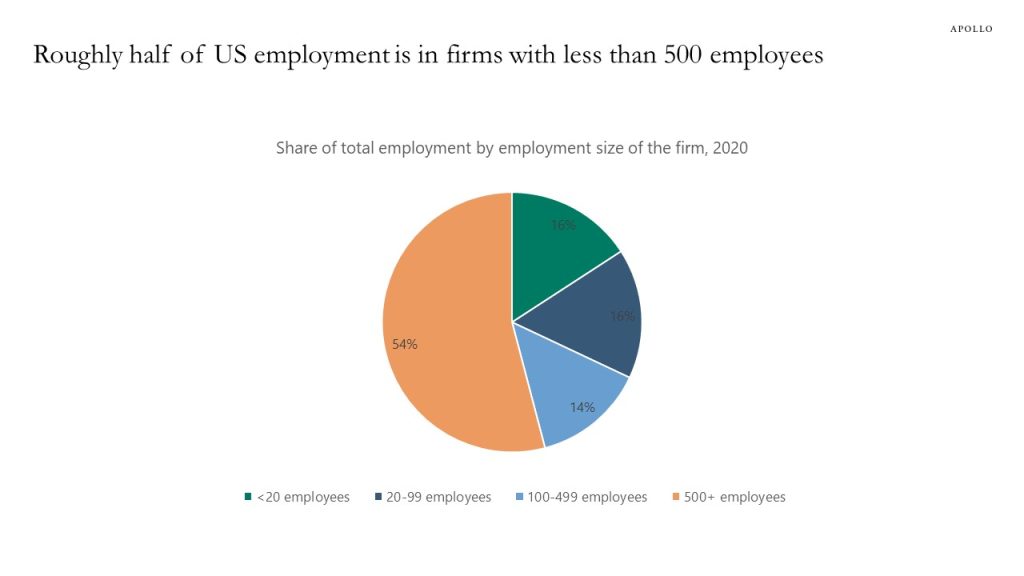
Source: Census, Apollo Chief Economist See important disclaimers at the bottom of the page.
-
Babysitter wages per hour are $25.2 in San Francisco, $24.6 in Seattle, and $23.5 in New York, and the increase in salaries for babysitters from 2021 to 2022 was more than 8% in Seattle, see chart below.
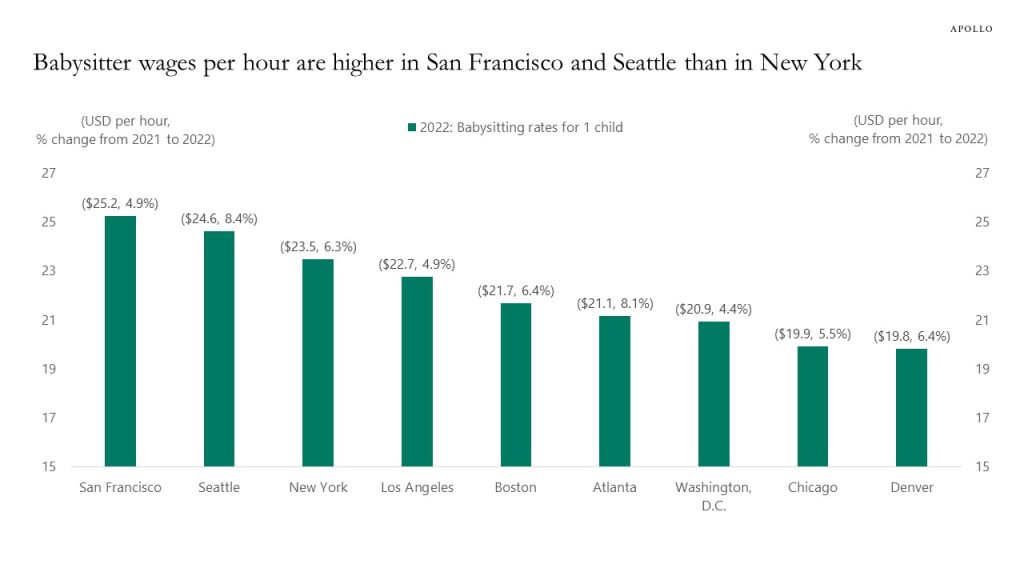
Source: Urbansitters, Apollo Chief Economist See important disclaimers at the bottom of the page.
-
After the housing bubble burst in 2008, construction of new homes declined more than 50%, and residential investment pulled GDP growth down by 1% for three years.
With commercial real estate construction being roughly 75% the size of residential investment, and fewer skyscrapers and shopping malls being built, the bursting CRE bubble could be a drag on GDP growth of around 0.75% over the coming three years. This should be compared with a 2% potential growth rate for the US economy (according to the CBO).
In other words, with the commercial real estate bubble bursting, we are likely to enter three years with low growth, similar to what we saw after the housing bubble burst in 2008. Put differently, once the Fed starts cutting rates later this year, interest rates will likely stay low for several years, and QE is likely to come back in 2024.
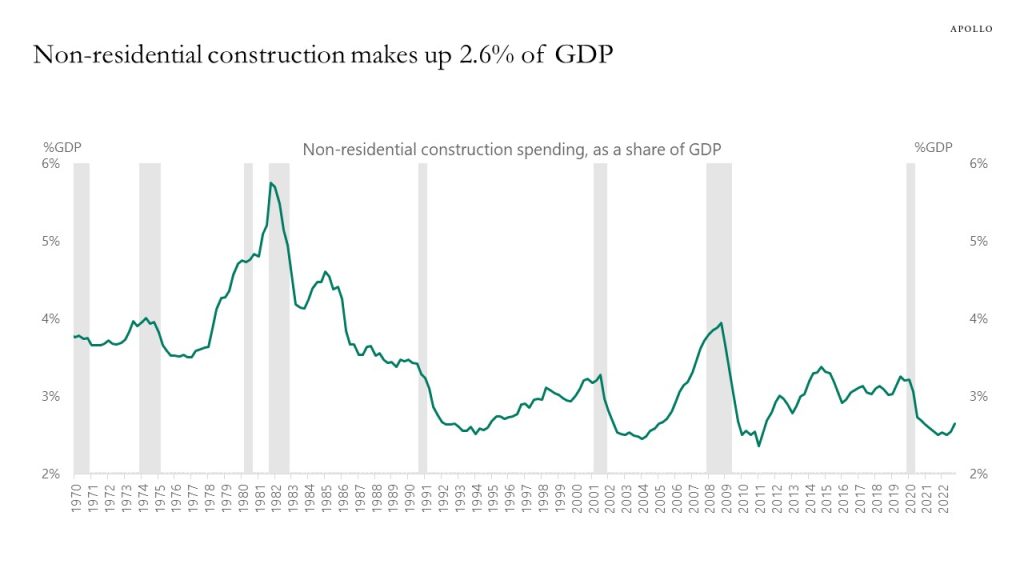
Source: BEA, Haver Analytics, Apollo Chief Economist See important disclaimers at the bottom of the page.
-
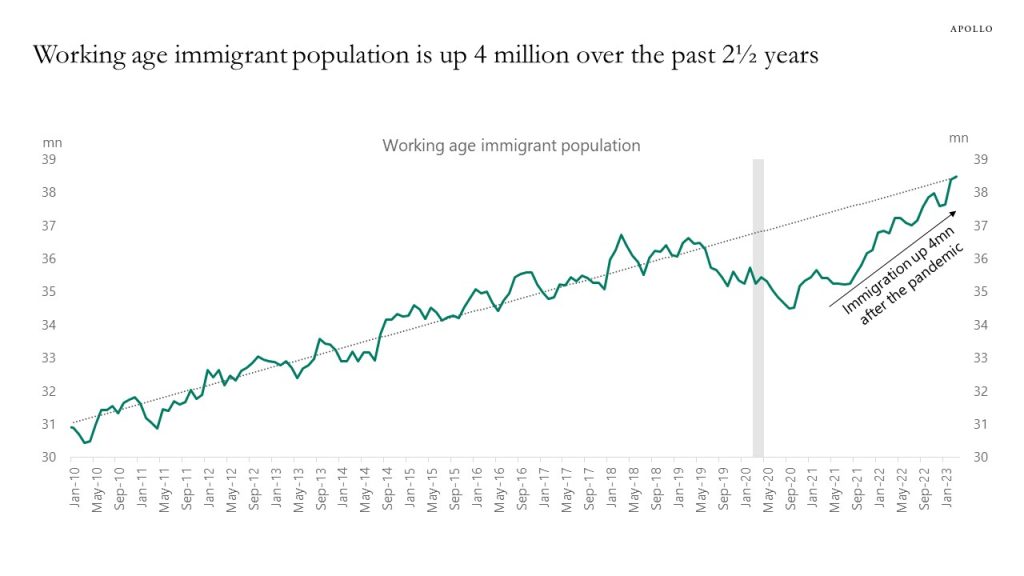
Immigration is a key reason the labor market is gradually moving from very overheated to less overheated.
Over the past 2½ years, immigration into the US labor market has increased by 4 million workers, and the working age immigrant population is now back at its pre-pandemic trend, see the first chart below.
High immigration contributes not only to solid job growth, including in leisure and hospitality, but also to increasing the participation rate and limiting the upside pressures on wages, see the second chart.
The bottom line is that high immigration is helpful for the Fed as it tries to cool down the labor market and slow down inflation.
Our employment outlook chart book is available here.
Source: BLS, Haver Analytics, Apollo Chief Economist 
Source: BLS, Haver, Apollo Chief Economist See important disclaimers at the bottom of the page.

This presentation may not be distributed, transmitted or otherwise communicated to others in whole or in part without the express consent of Apollo Global Management, Inc. (together with its subsidiaries, “Apollo”).
Apollo makes no representation or warranty, expressed or implied, with respect to the accuracy, reasonableness, or completeness of any of the statements made during this presentation, including, but not limited to, statements obtained from third parties. Opinions, estimates and projections constitute the current judgment of the speaker as of the date indicated. They do not necessarily reflect the views and opinions of Apollo and are subject to change at any time without notice. Apollo does not have any responsibility to update this presentation to account for such changes. There can be no assurance that any trends discussed during this presentation will continue.
Statements made throughout this presentation are not intended to provide, and should not be relied upon for, accounting, legal or tax advice and do not constitute an investment recommendation or investment advice. Investors should make an independent investigation of the information discussed during this presentation, including consulting their tax, legal, accounting or other advisors about such information. Apollo does not act for you and is not responsible for providing you with the protections afforded to its clients. This presentation does not constitute an offer to sell, or the solicitation of an offer to buy, any security, product or service, including interest in any investment product or fund or account managed or advised by Apollo.
Certain statements made throughout this presentation may be “forward-looking” in nature. Due to various risks and uncertainties, actual events or results may differ materially from those reflected or contemplated in such forward-looking information. As such, undue reliance should not be placed on such statements. Forward-looking statements may be identified by the use of terminology including, but not limited to, “may”, “will”, “should”, “expect”, “anticipate”, “target”, “project”, “estimate”, “intend”, “continue” or “believe” or the negatives thereof or other variations thereon or comparable terminology.