• Apollo.com
  • Login
  • Register Now
light site-logo
  • The Academy
  • Upcoming Events
        • Upcoming Events

        • Hybrid Investments: Flexible Structures for Volatile TimesThursday, May 29, 2025 • 11:00AM ET
  • Learning Center
        • New & UpdatedAlternative Investing Course 2.0

        • Alternative Investing Essentials Part OnePrivate Equity, Venture Capital, Private Credit
        • Alternative Investing Essentials Part TwoReal Estate, Infrastructure, Digital Assets, Hedge Funds
        • Practical ConsiderationsAsset Allocation, Risk Considerations, Fund Structures, Fees
        • Introductory Videos

          View All Videos

        •  Recent Classes & Videos

        • • Private Credit Investing in Volatile Times
        • • Potential Implications of the Latest US Administration Policy Proposals
        • • Beyond 60/40: Private Assets in an Era of High Public Valuations
        • • Investment Grade Private Credit as a Core Fixed Income Allocation
        • • 2025 Economic Outlook: Firing on All Cylinders
        • • Building the Future: Understanding the Tailwinds Behind Infrastructure Investing
        • View All Classes

  • Alternative Perspectives
        • Investment Knowledge
        • The View from Apollo
          • Investment Knowledge White Papers

            Beyond 60/40: Private Assets in an Era of High Public Valuations

            March 21, 2025
          • The View From Apollo

            Private Credit Investing in Volatile Times

            May 9, 2025
          • Investment Knowledge

            Apollo Answers: What Is PIK?

            March 19, 2025
  • The Daily Spark
        • Read The Daily Spark Blog


        • Want it delivered daily to your inbox?
          • The Daily Spark

            More Than Half of Expenditures on Imports From China Stays in the US

            May 15, 2025
          • The Daily Spark

            A 10% Trade War Premium for the Dollar

            May 14, 2025
          • The Daily Spark

            It Takes Time to Rebuild Trust

            May 13, 2025
  • Register for Apollo Academy: Alternative Investing Course
  • Login
  • About Apollo Academy
  • Upcoming Events
  • Learning Center
  • Alternative Perspectives
  • The Daily Spark
  • Register for Apollo Academy: Alternative Investing Course
  • Login
  • Private Credit Investing in Volatile Times
    Tuesday, April 29, 2025 • 11:00am ET
  • Alternative Investing Course 2.0
  • Potential Implications of the Latest US Administration Policy Proposals
  • Beyond 60/40: Private Assets in an Era of Soaring Public Valuations
  • Investment Grade Private Credit as a Core Fixed Income Allocation
  • 2025 Economic Outlook: Where’s the Slowdown?
  • Building the Future: Understanding the Tailwinds Behind Infrastructure Investing
  • Clean Transition Investing: Going Where the Opportunities Are
  • View All Classes
  • Introductory Videos
  • Alternative Investing Essentials Part One • Now Available On Demand
  • Alternative Investing Essentials Part Two • Now Available On Demand
  • Practical Considerations • Now Available On Demand
  • Investment Knowledge
  • The View from Apollo
Home October 2023

Outlook for Banks

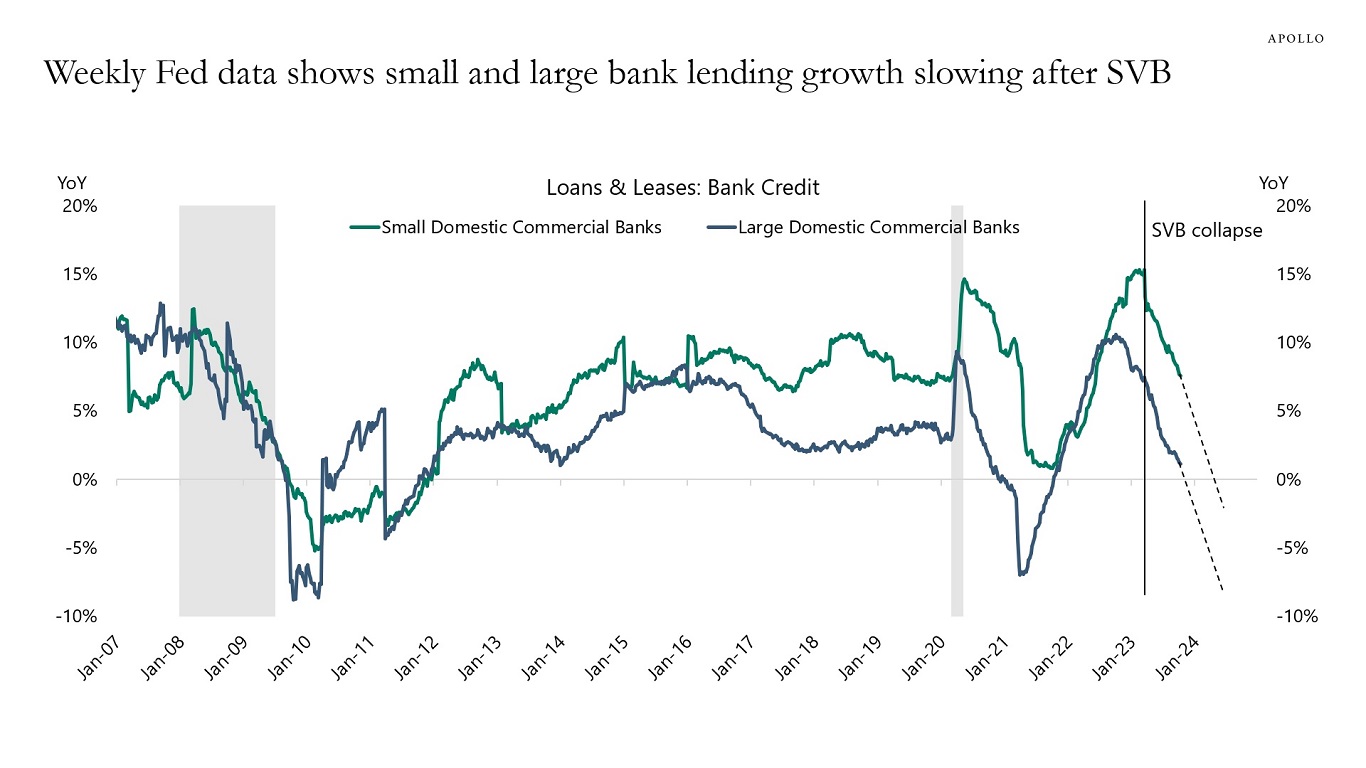
Our updated regional banking sector outlook is available here, and the weekly data shows a continued decline in loan growth in small and large banks, see the first chart.

The slowdown in loan growth is driven by Fed hikes and tighter lending standards following the SVB collapse.

With the Fed on hold until the middle of next year, these trends are likely to continue, and loan growth will soon turn negative.

Weekly Fed data shows small and large bank lending growth slowing after SVB
Source: Federal Reserve Board, Haver Analytics, Apollo Chief Economist
Bank stocks since the SVB collapse
Source: Bloomberg, Apollo Chief Economist. Note: The KBW Bank Index consists of Bank of NY Mellon, Bank of America, Capital One Financial, Citigroup, Citizens Financial Group, Comerica, Fifth Third Bank, First Horizon, Huntington, JP Morgan Chase, Keycorp, M&T Bank, Northern Trust, PNC, People’s United Financial, Regions, State Street, Truist, US Bancorp, Wells Fargo, and Zions.
Funding costs for banks since SVB and FRB
Source: ICE BofA, Bloomberg, Apollo Chief Economist. Note: Unweighted average spreads of bonds from ICE 5-10 Year US Banking Index, C6PX Index for bonds issued before January 1, 2023. There are eight banks in the Regional index and 41 banks in the Diversified index. Regional banks include BankUnited, Citizens Financial, Huntington, and Zions. Diversified banks include JP Morgan Chase, Citibank, and Bank of America.
$1053 billion inflows into money market funds during this Fed hiking cycle
Source: FRB, ICI, Bloomberg, Apollo Chief Economist
Banks with total assets between $100 million and $10 billion are more exposed to CRE loans
Source: FDIC, Apollo Chief Economist

Banks from $1 billion to $10 billion have lower liquidity ratios
Source: FDIC, Bloomberg, Apollo Chief Economist

Download hi-res chart(s)

Recent Posts

  • More Than Half of Expenditures on Imports From China Stays in the US
  • A 10% Trade War Premium for the Dollar
  • It Takes Time to Rebuild Trust
  • Banks’ Unrealized Losses Increase Again
  • Lower Inventory-to-Sales Ratio for Retailers Today than in 2019

Recent Comments

No comments to show.

Archives

  • May 2025
  • April 2025
  • March 2025
  • February 2025
  • January 2025
  • December 2024
  • November 2024
  • October 2024
  • September 2024
  • August 2024
  • July 2024
  • June 2024
  • May 2024
  • April 2024
  • March 2024
  • February 2024
  • January 2024
  • December 2023
  • November 2023
  • October 2023
  • September 2023
  • August 2023
  • July 2023
  • June 2023
  • May 2023
  • April 2023
  • March 2023
  • February 2023
  • January 2023
  • December 2022
  • November 2022
  • October 2022
  • September 2022
  • August 2022
  • July 2022
  • June 2022
  • May 2022
  • April 2022
  • March 2022
  • February 2022
  • January 2022
  • December 2021
  • November 2021

Categories

  • Apollo Answers
  • Course Introductions
  • Economic Intelligence
  • Hide from Wordpress Search
  • Investment Knowledge
  • Perspectives
  • Redirecting
  • The Daily Spark
  • The View from Apollo
  • The Weekly Brief
  • Uncategorized
  • White Papers

The Costs of Capital Are Permanently Higher

The Fed has since the beginning of 2023 steadily increased its estimate of the long-run fed funds rate, see chart below. The implication for investors is that the Fed is beginning to see the costs of capital as permanently higher. A permanent increase in the risk-free rate has important implications for firms, households, and asset allocation across equities and fixed income.

FOMC members continue to increase their estimate of the long-run Fed funds rate
Source: FRB, Apollo Chief Economist

Download hi-res chart(s)

Recent Posts

  • More Than Half of Expenditures on Imports From China Stays in the US
  • A 10% Trade War Premium for the Dollar
  • It Takes Time to Rebuild Trust
  • Banks’ Unrealized Losses Increase Again
  • Lower Inventory-to-Sales Ratio for Retailers Today than in 2019

Recent Comments

No comments to show.

Archives

  • May 2025
  • April 2025
  • March 2025
  • February 2025
  • January 2025
  • December 2024
  • November 2024
  • October 2024
  • September 2024
  • August 2024
  • July 2024
  • June 2024
  • May 2024
  • April 2024
  • March 2024
  • February 2024
  • January 2024
  • December 2023
  • November 2023
  • October 2023
  • September 2023
  • August 2023
  • July 2023
  • June 2023
  • May 2023
  • April 2023
  • March 2023
  • February 2023
  • January 2023
  • December 2022
  • November 2022
  • October 2022
  • September 2022
  • August 2022
  • July 2022
  • June 2022
  • May 2022
  • April 2022
  • March 2022
  • February 2022
  • January 2022
  • December 2021
  • November 2021

Categories

  • Apollo Answers
  • Course Introductions
  • Economic Intelligence
  • Hide from Wordpress Search
  • Investment Knowledge
  • Perspectives
  • Redirecting
  • The Daily Spark
  • The View from Apollo
  • The Weekly Brief
  • Uncategorized
  • White Papers

Stock Buybacks Declining

The consensus is expecting a slowdown in GDP this quarter, driven by household savings drying up, student loan payments restarting, and impacts from high interest rates hitting consumers harder and harder. Additionally, the October jobs report—which will be released on November 3—is expected to show a decline in job creation. With the Federal Reserve raising interest rates since March of 2022, the cost of capital has been rising. This has been putting downward pressure on stock buybacks. Other factors playing a role in this trend include increased tax risks as well as recession and geopolitical worries. The bottom line is that companies seem to be less inclined to pursue buybacks and instead are holding on to the capital they have on hand to run their operations.


This presentation may not be distributed, transmitted or otherwise communicated to others in whole or in part without the express consent of Apollo Global Management, Inc. (together with its subsidiaries, “Apollo”).  

Apollo makes no representation or warranty, expressed or implied, with respect to the accuracy, reasonableness, or completeness of any of the statements made during this presentation, including, but not limited to, statements obtained from third parties. Opinions, estimates and projections constitute the current judgment of the speaker as of the date indicated. They do not necessarily reflect the views and opinions of Apollo and are subject to change at any time without notice. Apollo does not have any responsibility to update this presentation to account for such changes. There can be no assurance that any trends discussed during this presentation will continue.   

Statements made throughout this presentation are not intended to provide, and should not be relied upon for, accounting, legal or tax advice and do not constitute an investment recommendation or investment advice. Investors should make an independent investigation of the information discussed during this presentation, including consulting their tax, legal, accounting or other advisors about such information. Apollo does not act for you and is not responsible for providing you with the protections afforded to its clients. This presentation does not constitute an offer to sell, or the solicitation of an offer to buy, any security, product or service, including interest in any investment product or fund or account managed or advised by Apollo. 

Certain statements made throughout this presentation may be “forward-looking” in nature. Due to various risks and uncertainties, actual events or results may differ materially from those reflected or contemplated in such forward-looking information. As such, undue reliance should not be placed on such statements. Forward-looking statements may be identified by the use of terminology including, but not limited to, “may”, “will”, “should”, “expect”, “anticipate”, “target”, “project”, “estimate”, “intend”, “continue” or “believe” or the negatives thereof or other variations thereon or comparable terminology.

Recent Posts

  • More Than Half of Expenditures on Imports From China Stays in the US
  • A 10% Trade War Premium for the Dollar
  • It Takes Time to Rebuild Trust
  • Banks’ Unrealized Losses Increase Again
  • Lower Inventory-to-Sales Ratio for Retailers Today than in 2019

Recent Comments

No comments to show.

Archives

  • May 2025
  • April 2025
  • March 2025
  • February 2025
  • January 2025
  • December 2024
  • November 2024
  • October 2024
  • September 2024
  • August 2024
  • July 2024
  • June 2024
  • May 2024
  • April 2024
  • March 2024
  • February 2024
  • January 2024
  • December 2023
  • November 2023
  • October 2023
  • September 2023
  • August 2023
  • July 2023
  • June 2023
  • May 2023
  • April 2023
  • March 2023
  • February 2023
  • January 2023
  • December 2022
  • November 2022
  • October 2022
  • September 2022
  • August 2022
  • July 2022
  • June 2022
  • May 2022
  • April 2022
  • March 2022
  • February 2022
  • January 2022
  • December 2021
  • November 2021

Categories

  • Apollo Answers
  • Course Introductions
  • Economic Intelligence
  • Hide from Wordpress Search
  • Investment Knowledge
  • Perspectives
  • Redirecting
  • The Daily Spark
  • The View from Apollo
  • The Weekly Brief
  • Uncategorized
  • White Papers

The Age of Free Money Is Over

There is downward pressure on buybacks because of worries about a recession, the new tax on buybacks, and higher cost of capital.

These three forces make free cash flow more valuable for companies, see chart below.

Higher costs of capital putting downward pressure on buybacks
Source: Bloomberg, Apollo Chief Economist

Download hi-res chart(s)

Recent Posts

  • More Than Half of Expenditures on Imports From China Stays in the US
  • A 10% Trade War Premium for the Dollar
  • It Takes Time to Rebuild Trust
  • Banks’ Unrealized Losses Increase Again
  • Lower Inventory-to-Sales Ratio for Retailers Today than in 2019

Recent Comments

No comments to show.

Archives

  • May 2025
  • April 2025
  • March 2025
  • February 2025
  • January 2025
  • December 2024
  • November 2024
  • October 2024
  • September 2024
  • August 2024
  • July 2024
  • June 2024
  • May 2024
  • April 2024
  • March 2024
  • February 2024
  • January 2024
  • December 2023
  • November 2023
  • October 2023
  • September 2023
  • August 2023
  • July 2023
  • June 2023
  • May 2023
  • April 2023
  • March 2023
  • February 2023
  • January 2023
  • December 2022
  • November 2022
  • October 2022
  • September 2022
  • August 2022
  • July 2022
  • June 2022
  • May 2022
  • April 2022
  • March 2022
  • February 2022
  • January 2022
  • December 2021
  • November 2021

Categories

  • Apollo Answers
  • Course Introductions
  • Economic Intelligence
  • Hide from Wordpress Search
  • Investment Knowledge
  • Perspectives
  • Redirecting
  • The Daily Spark
  • The View from Apollo
  • The Weekly Brief
  • Uncategorized
  • White Papers

Negative Equity Risk Premium

Calculating the equity risk premium using trailing earnings and forward earnings shows that stocks are at their least-attractive levels in 20 years relative to bonds, see charts below.

The equity risk premium measures the return in the stock market minus the return of the risk-free rate, and it tells investors something about equity returns relative to fixed-income returns.

In the equity risk premium formula, equity returns are normally calculated by looking at the S&P500 earnings yield, i.e., the inverse of the P/E ratio. Using forward earnings expectations can be misleading when the consensus expects a 55% chance of a recession, so another variant is to look at the S&P500 earnings yield using trailing earnings.

Either way, the bottom line is that with 10-year interest rates close to 5%, the stock market today is more unappealing than it has been in 20 years, see again charts below.

Stocks are unattractive to bonds per the difference between the trailing earnings yield and the10-year Treasury yield.
Source: Bloomberg, Apollo Chief Economist
Stocks are unattractive to bonds per the difference between the trailing earnings yield and the10-year Treasury yield.
Source: Bloomberg, Apollo Chief Economist

Download hi-res chart(s)

Recent Posts

  • More Than Half of Expenditures on Imports From China Stays in the US
  • A 10% Trade War Premium for the Dollar
  • It Takes Time to Rebuild Trust
  • Banks’ Unrealized Losses Increase Again
  • Lower Inventory-to-Sales Ratio for Retailers Today than in 2019

Recent Comments

No comments to show.

Archives

  • May 2025
  • April 2025
  • March 2025
  • February 2025
  • January 2025
  • December 2024
  • November 2024
  • October 2024
  • September 2024
  • August 2024
  • July 2024
  • June 2024
  • May 2024
  • April 2024
  • March 2024
  • February 2024
  • January 2024
  • December 2023
  • November 2023
  • October 2023
  • September 2023
  • August 2023
  • July 2023
  • June 2023
  • May 2023
  • April 2023
  • March 2023
  • February 2023
  • January 2023
  • December 2022
  • November 2022
  • October 2022
  • September 2022
  • August 2022
  • July 2022
  • June 2022
  • May 2022
  • April 2022
  • March 2022
  • February 2022
  • January 2022
  • December 2021
  • November 2021

Categories

  • Apollo Answers
  • Course Introductions
  • Economic Intelligence
  • Hide from Wordpress Search
  • Investment Knowledge
  • Perspectives
  • Redirecting
  • The Daily Spark
  • The View from Apollo
  • The Weekly Brief
  • Uncategorized
  • White Papers

Incorrect Fed Expectations

The market is currently pricing that the FOMC will start cutting rates in June 2024, but the chart below shows that the market is almost always wrong about what the Fed will do beyond the next FOMC meeting.

Looking at the chart, it is remarkable how mean reverting the error is.

When rates are low, the market is systematically pricing that the Fed will soon hike.

When rates are high, the market is systematically pricing that the next move from the Fed is to cut.

Maybe the Fed will cut rates next summer. Maybe not.

For now, investors should be planning on rates staying higher for longer.

Fed fund futures are almost always wrong about what the Fed will do.
Source: Bloomberg, Apollo Chief Economist

Download hi-res chart(s)

Recent Posts

  • More Than Half of Expenditures on Imports From China Stays in the US
  • A 10% Trade War Premium for the Dollar
  • It Takes Time to Rebuild Trust
  • Banks’ Unrealized Losses Increase Again
  • Lower Inventory-to-Sales Ratio for Retailers Today than in 2019

Recent Comments

No comments to show.

Archives

  • May 2025
  • April 2025
  • March 2025
  • February 2025
  • January 2025
  • December 2024
  • November 2024
  • October 2024
  • September 2024
  • August 2024
  • July 2024
  • June 2024
  • May 2024
  • April 2024
  • March 2024
  • February 2024
  • January 2024
  • December 2023
  • November 2023
  • October 2023
  • September 2023
  • August 2023
  • July 2023
  • June 2023
  • May 2023
  • April 2023
  • March 2023
  • February 2023
  • January 2023
  • December 2022
  • November 2022
  • October 2022
  • September 2022
  • August 2022
  • July 2022
  • June 2022
  • May 2022
  • April 2022
  • March 2022
  • February 2022
  • January 2022
  • December 2021
  • November 2021

Categories

  • Apollo Answers
  • Course Introductions
  • Economic Intelligence
  • Hide from Wordpress Search
  • Investment Knowledge
  • Perspectives
  • Redirecting
  • The Daily Spark
  • The View from Apollo
  • The Weekly Brief
  • Uncategorized
  • White Papers

Inflation Reaccelerating in Recent Months

Key measures of inflation have reaccelerated in recent months, and supercore inflation at 4% is too high compared with the Fed’s 2% inflation target, see charts below.

The bottom line is that it is too early for the Fed to declare victory over inflation, and the Fed needs to slow down the economy further to get inflation under control.

The implication for investors is that the Fed will keep rates high until nonfarm payrolls go negative, because that is what is needed to get inflation under control, and this fact is generally underappreciated in markets.

Inflation is picking back up
Source: BLS, Haver Analytics, Apollo Chief Economist
Supercore inflation is rising month to month
Source: BLS, Haver Analytics, Apollo Chief Economist
Supercore inflation is too high
Source: BLS, Haver Analytics, Apollo Chief Economist

Download hi-res chart(s)

Recent Posts

  • More Than Half of Expenditures on Imports From China Stays in the US
  • A 10% Trade War Premium for the Dollar
  • It Takes Time to Rebuild Trust
  • Banks’ Unrealized Losses Increase Again
  • Lower Inventory-to-Sales Ratio for Retailers Today than in 2019

Recent Comments

No comments to show.

Archives

  • May 2025
  • April 2025
  • March 2025
  • February 2025
  • January 2025
  • December 2024
  • November 2024
  • October 2024
  • September 2024
  • August 2024
  • July 2024
  • June 2024
  • May 2024
  • April 2024
  • March 2024
  • February 2024
  • January 2024
  • December 2023
  • November 2023
  • October 2023
  • September 2023
  • August 2023
  • July 2023
  • June 2023
  • May 2023
  • April 2023
  • March 2023
  • February 2023
  • January 2023
  • December 2022
  • November 2022
  • October 2022
  • September 2022
  • August 2022
  • July 2022
  • June 2022
  • May 2022
  • April 2022
  • March 2022
  • February 2022
  • January 2022
  • December 2021
  • November 2021

Categories

  • Apollo Answers
  • Course Introductions
  • Economic Intelligence
  • Hide from Wordpress Search
  • Investment Knowledge
  • Perspectives
  • Redirecting
  • The Daily Spark
  • The View from Apollo
  • The Weekly Brief
  • Uncategorized
  • White Papers

Proxy Fed Funds Rate Is 7%

The Fed has quantified what their forward guidance and balance sheet policy mean for the fed funds rate, and their estimates show that the proxy fed funds rate is 7% rather than the official 5.5%, see chart below and here.

In other words, comparisons with history and discussions of how restrictive monetary policy is should not only look at the level of the fed funds rate but also include forward guidance and balance sheet policies, including their impact on long rates.

The Fed's own proxy rate is approximately 7%
Source: Bloomberg, Apollo Chief Economist. Note: Source: Monthly series of the proxy funds rate, from Doh and Choi (2016) and Choi, Doh, Foerster, and Martinez (2022). This measure uses public and private borrowing rates and spreads to infer the broader stance of monetary policy. When the Federal Open Market Committee uses additional tools, such as forward guidance or changes in the balance sheet, these policy actions affect financial conditions, which the proxy rate translates into an analogous level of the federal funds rate. The proxy rate can be interpreted as indicating what the federal funds rate would typically be associated with prevailing financial market conditions if these conditions were driven solely by the funds rate.

Download hi-res chart(s)

Recent Posts

  • More Than Half of Expenditures on Imports From China Stays in the US
  • A 10% Trade War Premium for the Dollar
  • It Takes Time to Rebuild Trust
  • Banks’ Unrealized Losses Increase Again
  • Lower Inventory-to-Sales Ratio for Retailers Today than in 2019

Recent Comments

No comments to show.

Archives

  • May 2025
  • April 2025
  • March 2025
  • February 2025
  • January 2025
  • December 2024
  • November 2024
  • October 2024
  • September 2024
  • August 2024
  • July 2024
  • June 2024
  • May 2024
  • April 2024
  • March 2024
  • February 2024
  • January 2024
  • December 2023
  • November 2023
  • October 2023
  • September 2023
  • August 2023
  • July 2023
  • June 2023
  • May 2023
  • April 2023
  • March 2023
  • February 2023
  • January 2023
  • December 2022
  • November 2022
  • October 2022
  • September 2022
  • August 2022
  • July 2022
  • June 2022
  • May 2022
  • April 2022
  • March 2022
  • February 2022
  • January 2022
  • December 2021
  • November 2021

Categories

  • Apollo Answers
  • Course Introductions
  • Economic Intelligence
  • Hide from Wordpress Search
  • Investment Knowledge
  • Perspectives
  • Redirecting
  • The Daily Spark
  • The View from Apollo
  • The Weekly Brief
  • Uncategorized
  • White Papers

Restarting Student Loans Weighing on Households

Student loan payments restarted on October 1. And the Census Household Pulse Survey for October shows a jump in the share of consumers saying they are having difficulties paying their household expenses, see chart below.

Looking at the Household Pulse Survey in detail shows that the difficulties with paying household expenses were concentrated among households with a college degree, making between $50,000 and $150,000, suggesting that restarting student loan payments is the source of increased financial stress for consumers.

Download hi-res chart(s)

Households with difficulties paying expenses are surging.
Source: Census Bureau, Apollo Chief Economist (Note: Household Pulse Survey)

Recent Posts

  • More Than Half of Expenditures on Imports From China Stays in the US
  • A 10% Trade War Premium for the Dollar
  • It Takes Time to Rebuild Trust
  • Banks’ Unrealized Losses Increase Again
  • Lower Inventory-to-Sales Ratio for Retailers Today than in 2019

Recent Comments

No comments to show.

Archives

  • May 2025
  • April 2025
  • March 2025
  • February 2025
  • January 2025
  • December 2024
  • November 2024
  • October 2024
  • September 2024
  • August 2024
  • July 2024
  • June 2024
  • May 2024
  • April 2024
  • March 2024
  • February 2024
  • January 2024
  • December 2023
  • November 2023
  • October 2023
  • September 2023
  • August 2023
  • July 2023
  • June 2023
  • May 2023
  • April 2023
  • March 2023
  • February 2023
  • January 2023
  • December 2022
  • November 2022
  • October 2022
  • September 2022
  • August 2022
  • July 2022
  • June 2022
  • May 2022
  • April 2022
  • March 2022
  • February 2022
  • January 2022
  • December 2021
  • November 2021

Categories

  • Apollo Answers
  • Course Introductions
  • Economic Intelligence
  • Hide from Wordpress Search
  • Investment Knowledge
  • Perspectives
  • Redirecting
  • The Daily Spark
  • The View from Apollo
  • The Weekly Brief
  • Uncategorized
  • White Papers

Costs of Capital Rising for Small Businesses

There are 33 million small businesses in the US, and the monthly survey from the NFIB shows that small businesses are now paying 10% interest on short-term loans, see chart below.

In other words, Fed policy is working as the textbook would have predicted, and companies are facing higher costs of capital.

The outcome is lower capex spending and lower hiring.

Interest rates on short-term small business loans are now at 10%
Source: NFIB, Haver Analytics, Apollo Chief Economist

Recent Posts

  • More Than Half of Expenditures on Imports From China Stays in the US
  • A 10% Trade War Premium for the Dollar
  • It Takes Time to Rebuild Trust
  • Banks’ Unrealized Losses Increase Again
  • Lower Inventory-to-Sales Ratio for Retailers Today than in 2019

Recent Comments

No comments to show.

Archives

  • May 2025
  • April 2025
  • March 2025
  • February 2025
  • January 2025
  • December 2024
  • November 2024
  • October 2024
  • September 2024
  • August 2024
  • July 2024
  • June 2024
  • May 2024
  • April 2024
  • March 2024
  • February 2024
  • January 2024
  • December 2023
  • November 2023
  • October 2023
  • September 2023
  • August 2023
  • July 2023
  • June 2023
  • May 2023
  • April 2023
  • March 2023
  • February 2023
  • January 2023
  • December 2022
  • November 2022
  • October 2022
  • September 2022
  • August 2022
  • July 2022
  • June 2022
  • May 2022
  • April 2022
  • March 2022
  • February 2022
  • January 2022
  • December 2021
  • November 2021

Categories

  • Apollo Answers
  • Course Introductions
  • Economic Intelligence
  • Hide from Wordpress Search
  • Investment Knowledge
  • Perspectives
  • Redirecting
  • The Daily Spark
  • The View from Apollo
  • The Weekly Brief
  • Uncategorized
  • White Papers

Posts navigation

Page 1 Page 2 … Page 5 Next page→
  • Privacy Notice
  • Terms of Use
  • Forward-Looking Statements
Apollo
© Apollo Global Management, Inc. 2025 All Rights Reserved.

The Apollo Academy is for informational and educational purposes only and nothing contained herein should be taken as investment advice or a recommendation to enter into any transaction. They are not an invitation by or on behalf of Apollo to any person to buy or sell any security or to adopt any investment strategy, and shall not form the basis of, nor may it accompany nor form part of, any right or contract to buy or sell any security or to adopt any investment strategy. There is no guarantee that the views and opinions expressed in this website will come to pass. For additional information, please see the disclaimers included in each piece of content or the legal page of our website here.