


Want it delivered daily to your inbox?
-
Annuity sales are almost double their pre-pandemic levels because of higher interest rates. And strong annuity sales create strong demand for credit, see chart below.
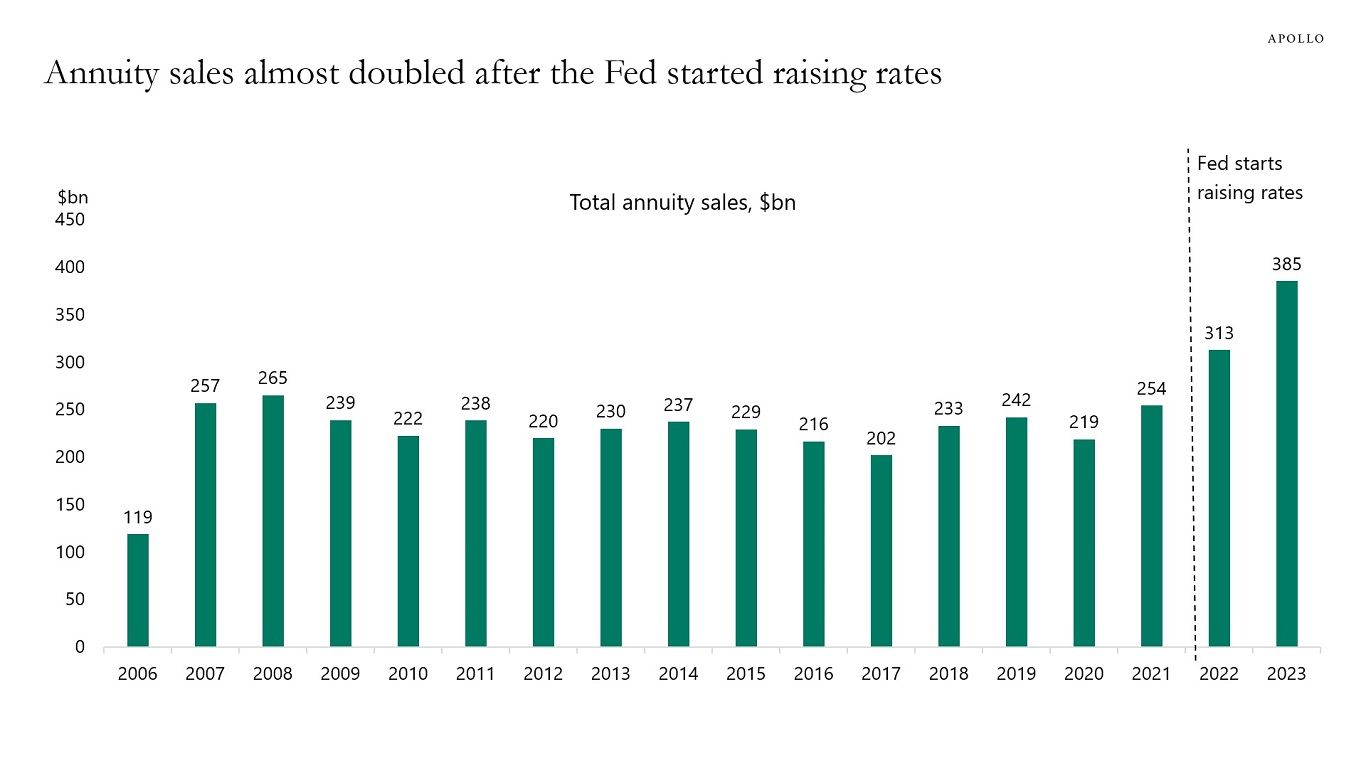
Source: LIMRA, Bloomberg, Apollo Chief Economist. Note: 2023 estimates from LIMRA. See important disclaimers at the bottom of the page.
-
The buyer base for US Treasuries has shifted from yield-insensitive buyers (sovereign wealth funds and central banks, including the Fed) to yield-sensitive buyers (US households, US pensions, US insurance), see chart below.
This may become a problem once the Fed begins to cut rates because that could mean less demand from the yield-sensitive buyers, ultimately resulting in a steeper yield curve.
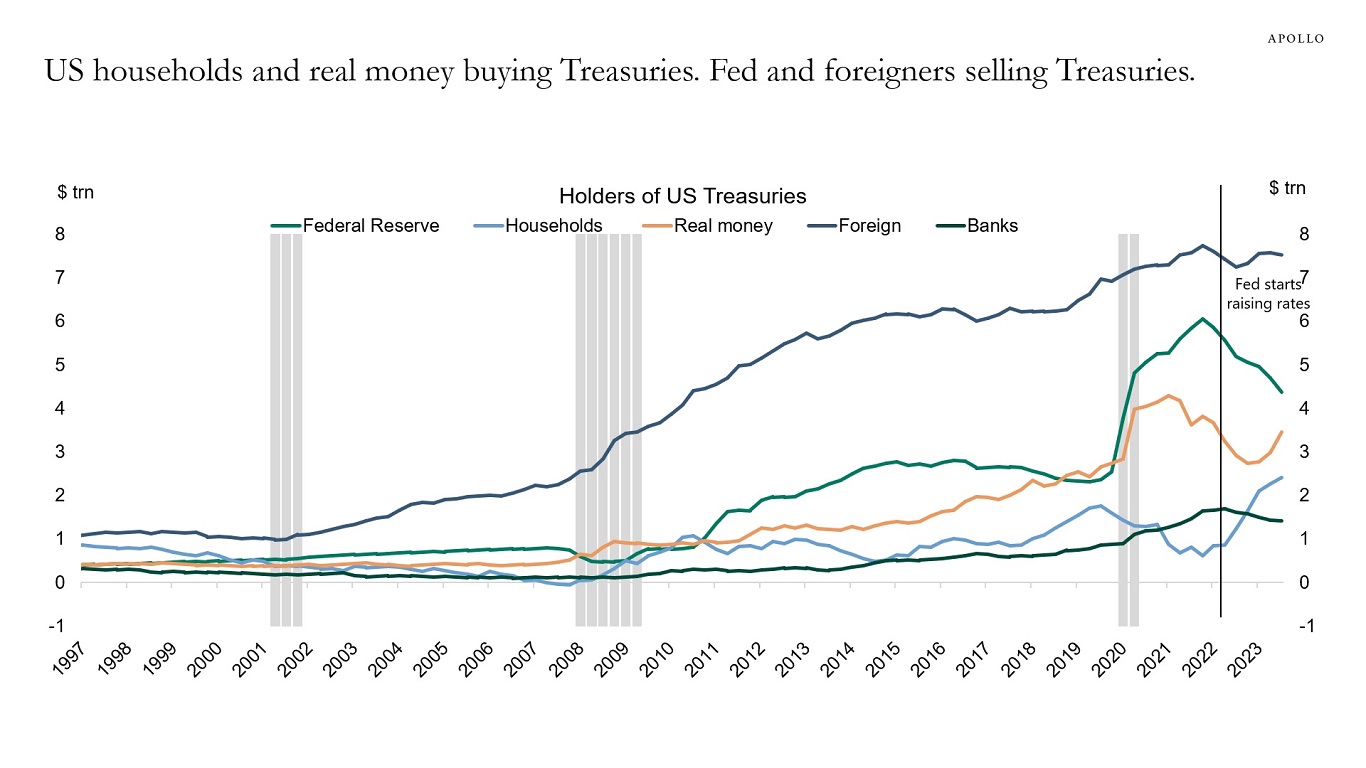
Source: FFUNDS, Haver, Apollo Chief Economist See important disclaimers at the bottom of the page.
-
Canadian business insolvency filings have increased dramatically in recent months, see chart below.

Source: Office of the Superintendent of Bankruptcy, Apollo Chief Economist See important disclaimers at the bottom of the page.
-
With no signs of a recession, commercial real estate prices are starting to recover, see chart below. This is helpful for the regional banks and for the broader economic recovery.
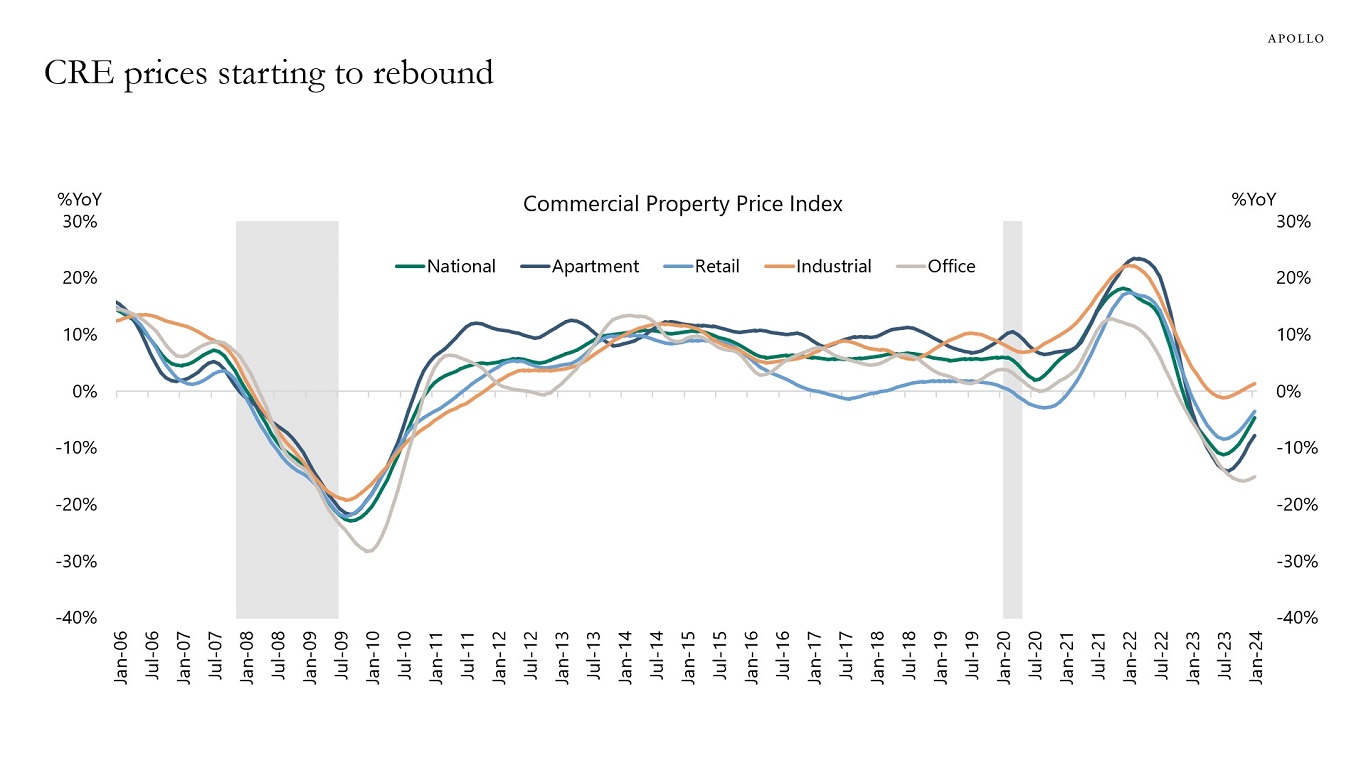
Source: RCA, Bloomberg, Apollo Chief Economist See important disclaimers at the bottom of the page.
-
The ongoing rally in credit is likely to continue driven by attractive all-in yields with strong demand from retail, insurance, and pensions. Our latest outlook for credit markets is available here.

Source: Apollo Chief Economist See important disclaimers at the bottom of the page.
-
The distribution of P/E ratios for the S&P 500 shows that stocks today are more overvalued than they were in March 2000, see chart below.
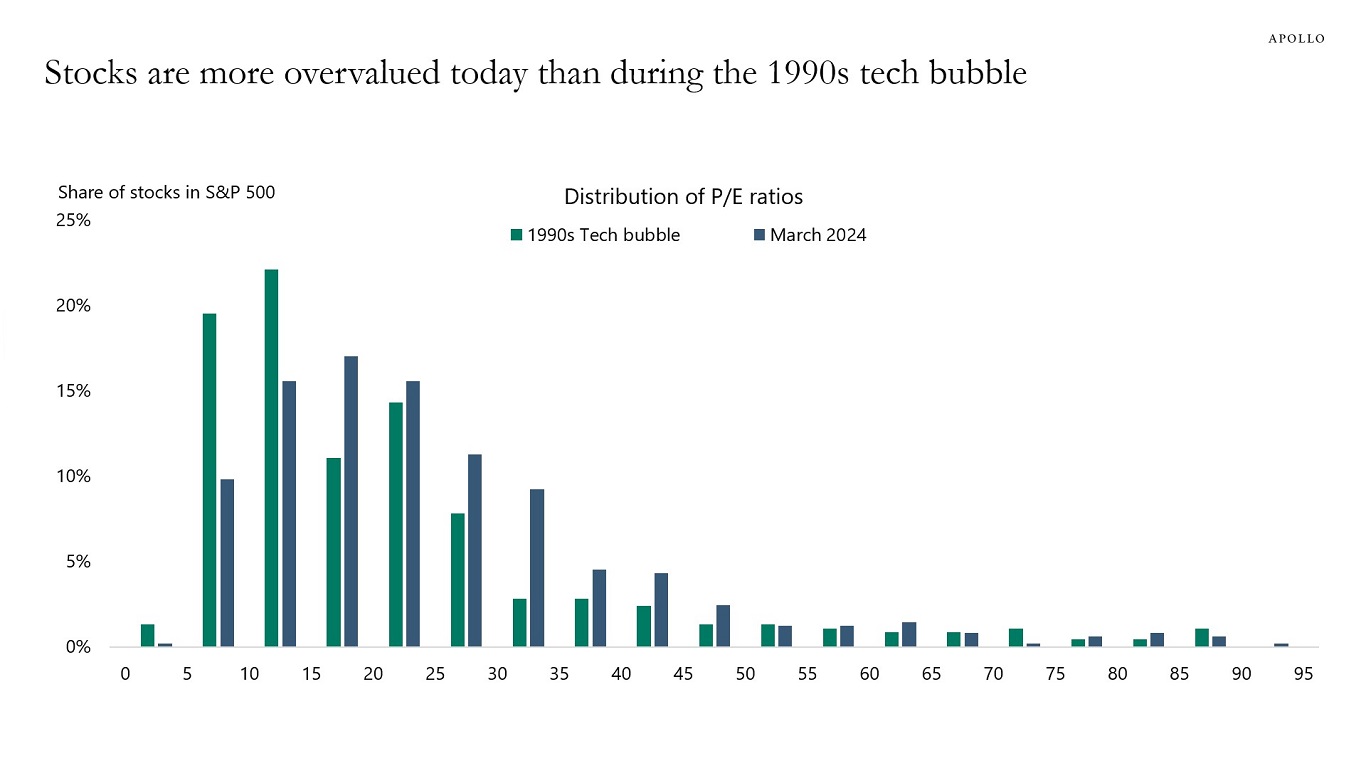
Source: Bloomberg, Apollo Chief Economist. Note: 1990s tech bubble is March 2000. See important disclaimers at the bottom of the page.
-
Household expectations to future home price appreciation are currently at the highest level since 2007, see chart below.
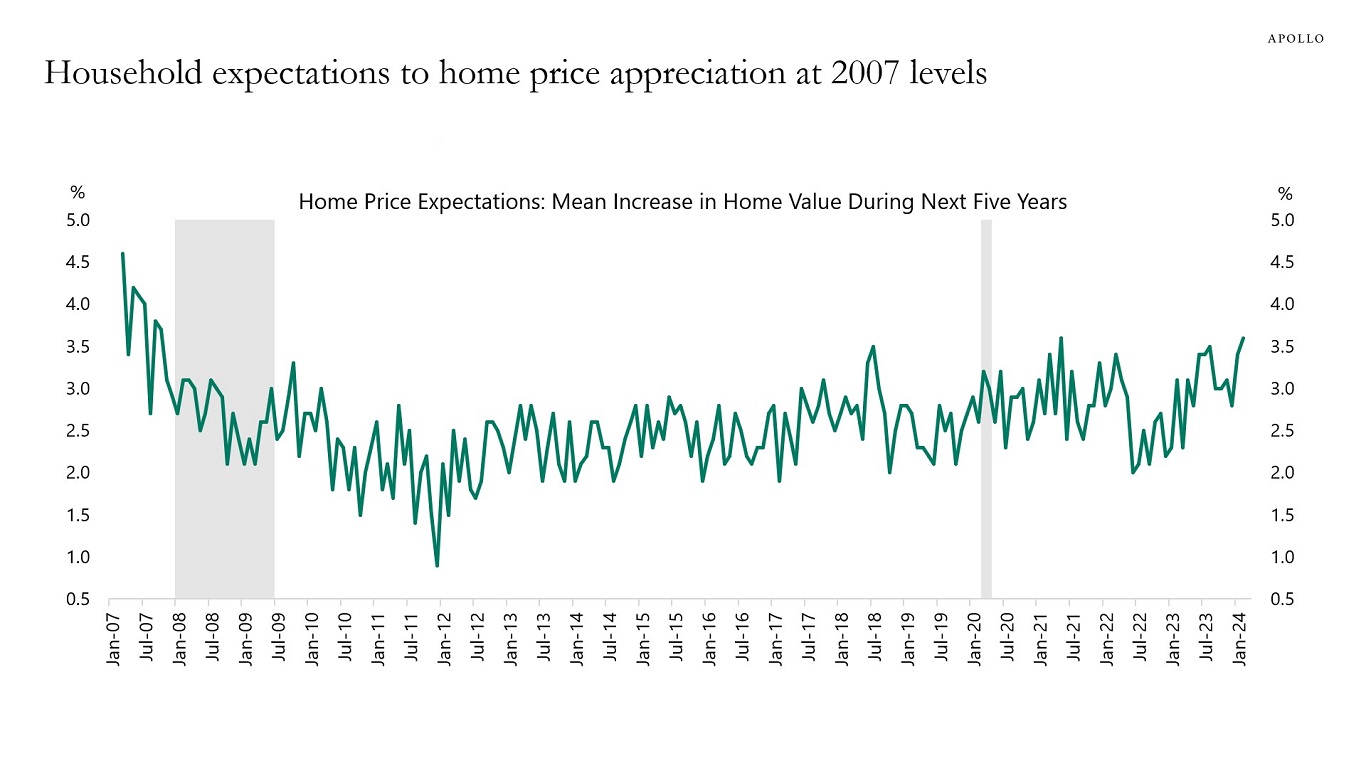
Source: University of Michigan, Haver Analytics, Apollo Chief Economist See important disclaimers at the bottom of the page.
-
Since the Fed turned dovish in December, financial conditions have eased dramatically, with the S&P 500 reaching all-time highs, credit spreads tightening, IPO activity picking up, and M&A activity picking up. As a result, consumer spending is currently getting a strong boost from record-high stock prices, high home prices, and record-high Bitcoin prices combined with high cash flows for owners of fixed income. The bottom line is that a dovish Fed giving the green light to investors too soon could result in a second mountain in inflation. That is the reason why the last mile is harder.
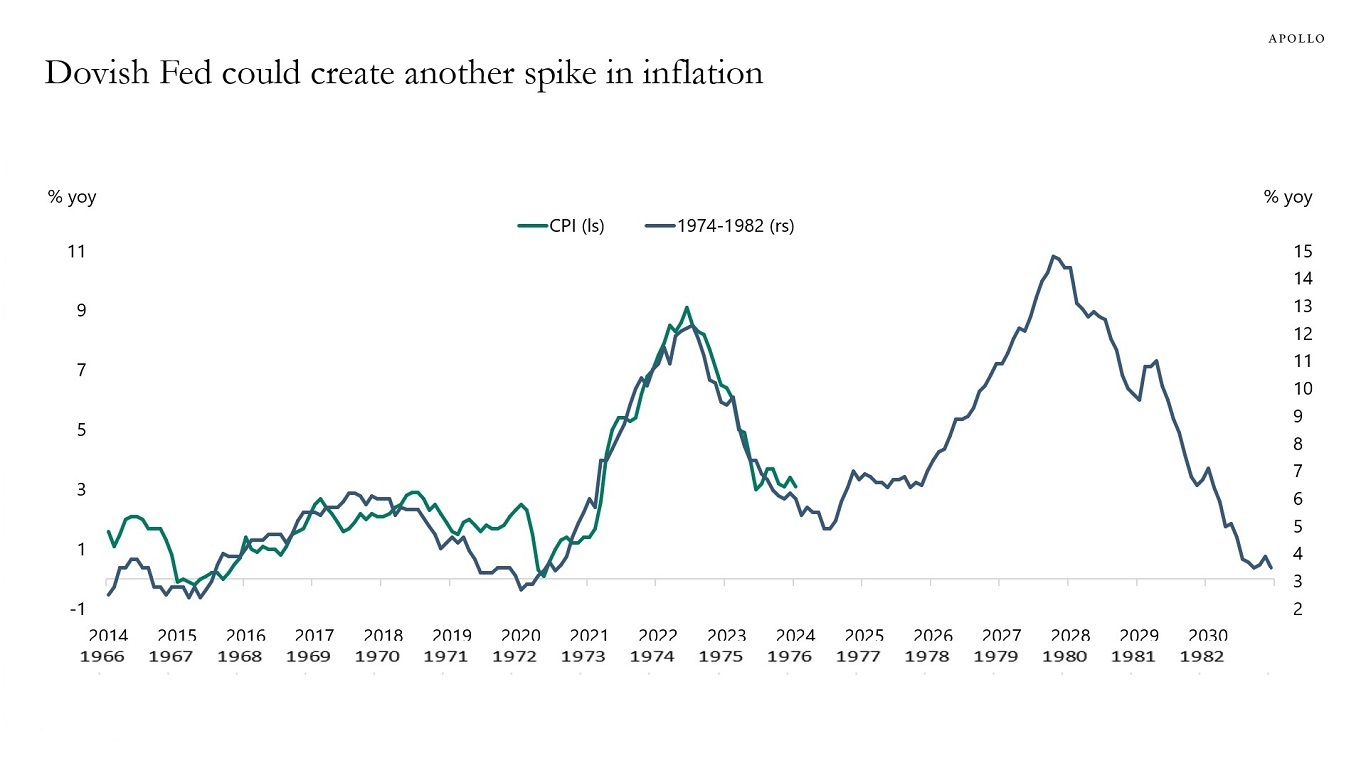
Source: Bloomberg, BLS, Apollo Chief Economist See important disclaimers at the bottom of the page.
-
With the Fed on hold until 2025, my colleague Shobhit Gupta and I took a look at recent episodes since 2022 when rates markets have been pricing higher for longer. The evidence shows that rates higher for longer have generally been associated with tighter credit spreads both for IG and HY, likely because of stronger-than-expected growth and earnings, see table below.
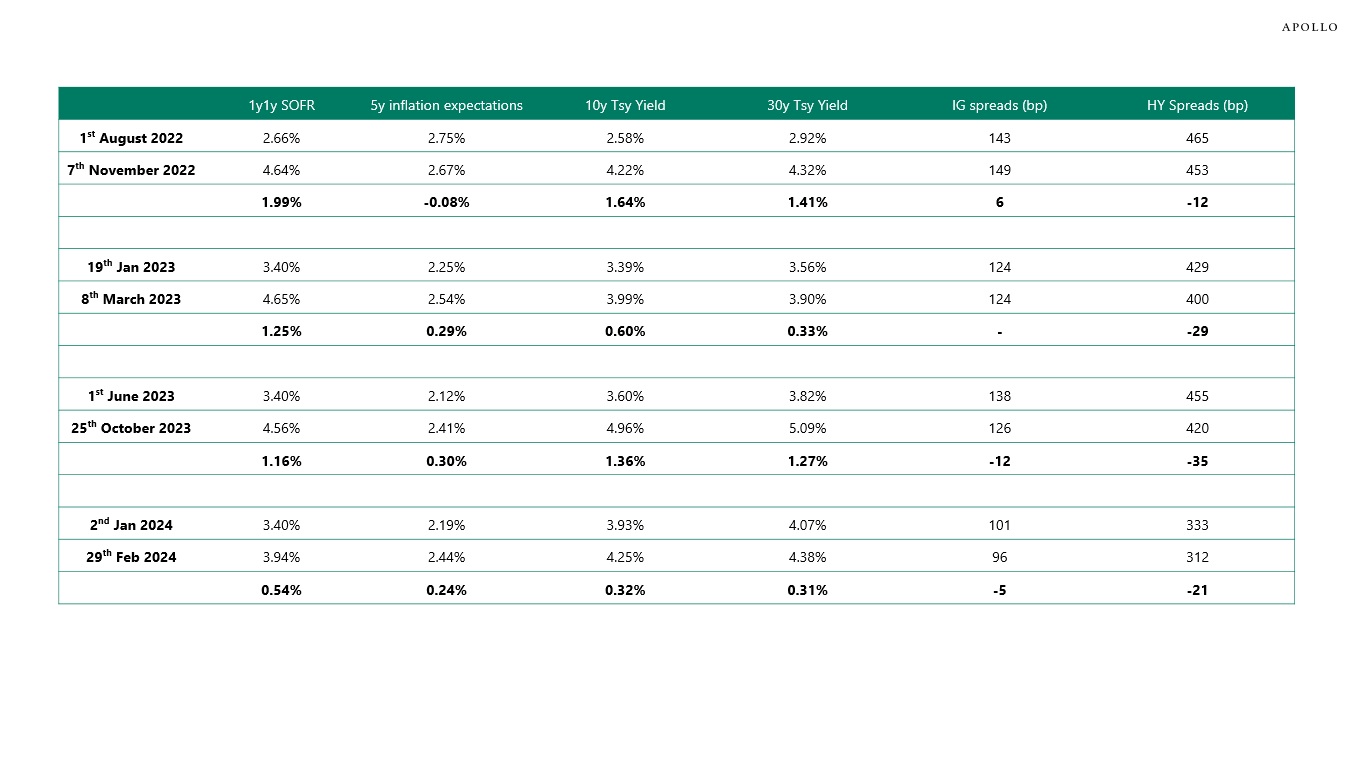
Source: Apollo Chief Economist See important disclaimers at the bottom of the page.
-
The employment report showed a continued increase in immigration, which supports employment growth, consumer spending, and demand for housing, see chart below.
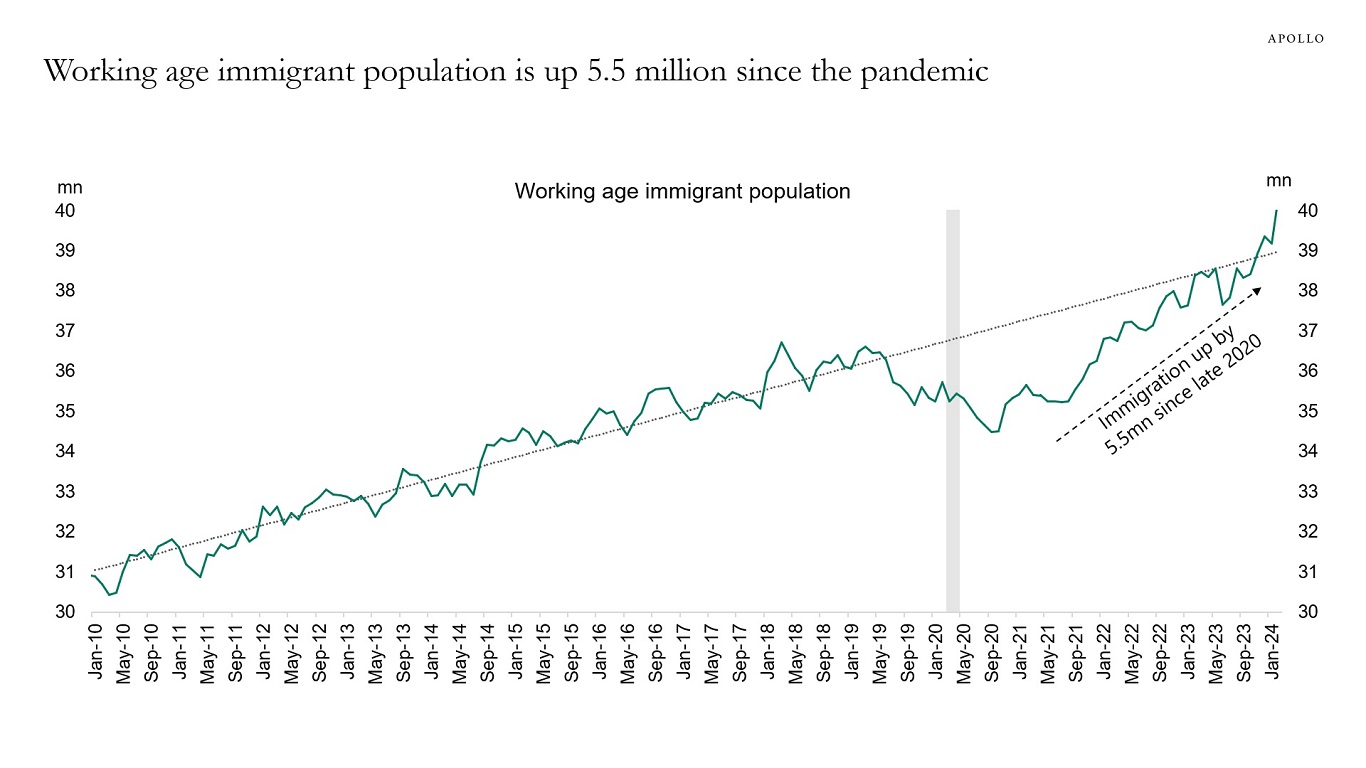
Source: BLS, Haver Analytics, Apollo Chief Economist See important disclaimers at the bottom of the page.

This presentation may not be distributed, transmitted or otherwise communicated to others in whole or in part without the express consent of Apollo Global Management, Inc. (together with its subsidiaries, “Apollo”).
Apollo makes no representation or warranty, expressed or implied, with respect to the accuracy, reasonableness, or completeness of any of the statements made during this presentation, including, but not limited to, statements obtained from third parties. Opinions, estimates and projections constitute the current judgment of the speaker as of the date indicated. They do not necessarily reflect the views and opinions of Apollo and are subject to change at any time without notice. Apollo does not have any responsibility to update this presentation to account for such changes. There can be no assurance that any trends discussed during this presentation will continue.
Statements made throughout this presentation are not intended to provide, and should not be relied upon for, accounting, legal or tax advice and do not constitute an investment recommendation or investment advice. Investors should make an independent investigation of the information discussed during this presentation, including consulting their tax, legal, accounting or other advisors about such information. Apollo does not act for you and is not responsible for providing you with the protections afforded to its clients. This presentation does not constitute an offer to sell, or the solicitation of an offer to buy, any security, product or service, including interest in any investment product or fund or account managed or advised by Apollo.
Certain statements made throughout this presentation may be “forward-looking” in nature. Due to various risks and uncertainties, actual events or results may differ materially from those reflected or contemplated in such forward-looking information. As such, undue reliance should not be placed on such statements. Forward-looking statements may be identified by the use of terminology including, but not limited to, “may”, “will”, “should”, “expect”, “anticipate”, “target”, “project”, “estimate”, “intend”, “continue” or “believe” or the negatives thereof or other variations thereon or comparable terminology.