


Want it delivered daily to your inbox?
-
The Fed will not be able to get inflation under control with a booming housing market because housing makes up 40% of the inflation basket, and with housing currently rebounding, the risks are rising that the shelter components of inflation will stay elevated and complicate the Fed’s path back to the 2% inflation target, see charts below. The bottom line is that the Fed will keep rates higher for longer than the market is currently pricing.
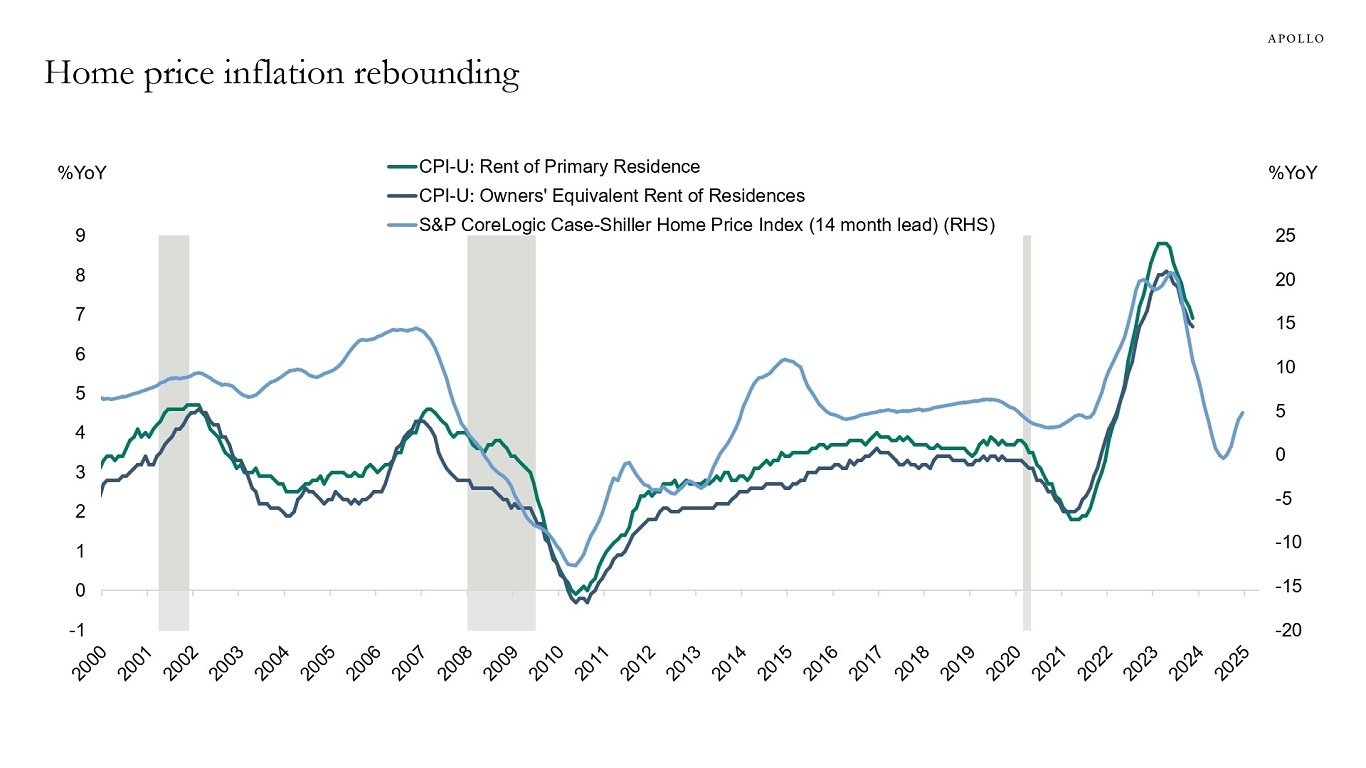
Source: Haver Analytics, BLS, S&P, Apollo Chief Economist 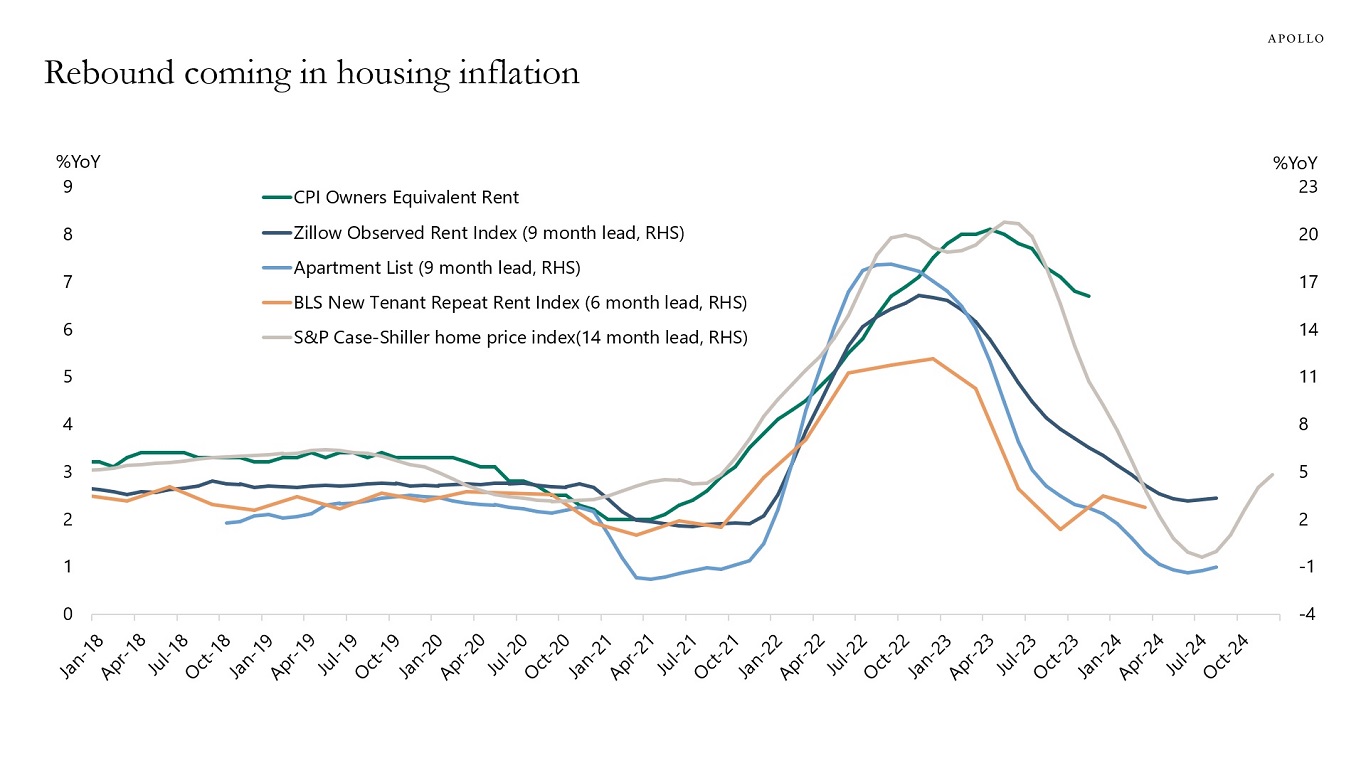
Source: BLS, S&P Case-Shiller, Zillow, Haver Analytics, Apollo Chief Economist See important disclaimers at the bottom of the page.
-
A record-high share of stocks in the S&P 500 have underperformed the index this year, see chart below.
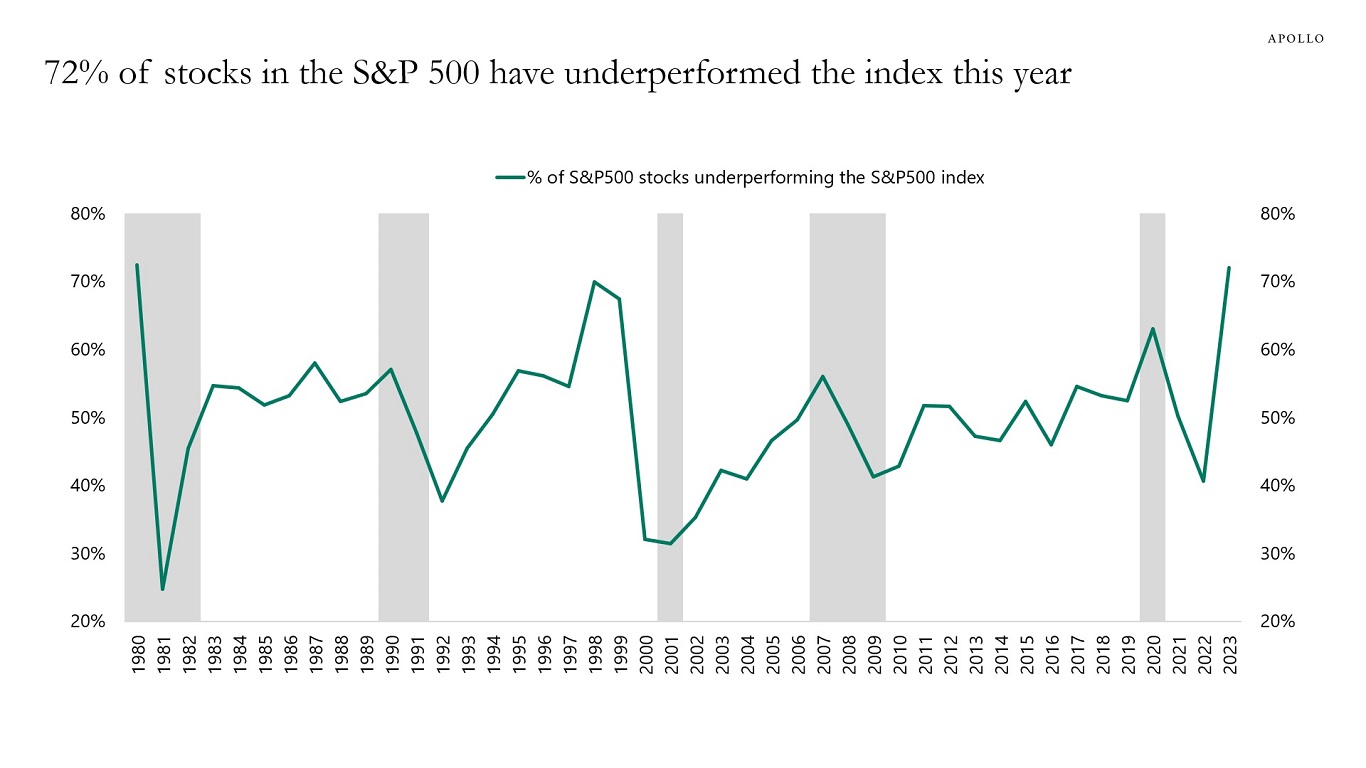
Source: Bloomberg, Apollo Chief Economist See important disclaimers at the bottom of the page.
-
The Bank of Japan now owns almost 60% of Japanese government bonds outstanding, see chart below. This statistic is truly remarkable. As this number approaches 100%, there is no economic theory for what will happen.
As the only G7 central bank, the BoJ has not raised short-term interest rates in response to rising inflation. With the Fed now talking about rate cuts in 2024, the BoJ may end up never raising short-term interest rates during this cycle.
With Japanese interest rates staying low and US rates coming down, the implication for markets is that Japan may return as a US fixed income buyer in 2024.
This presentation discusses this topic and the outlook for Japanese demand for US fixed income.
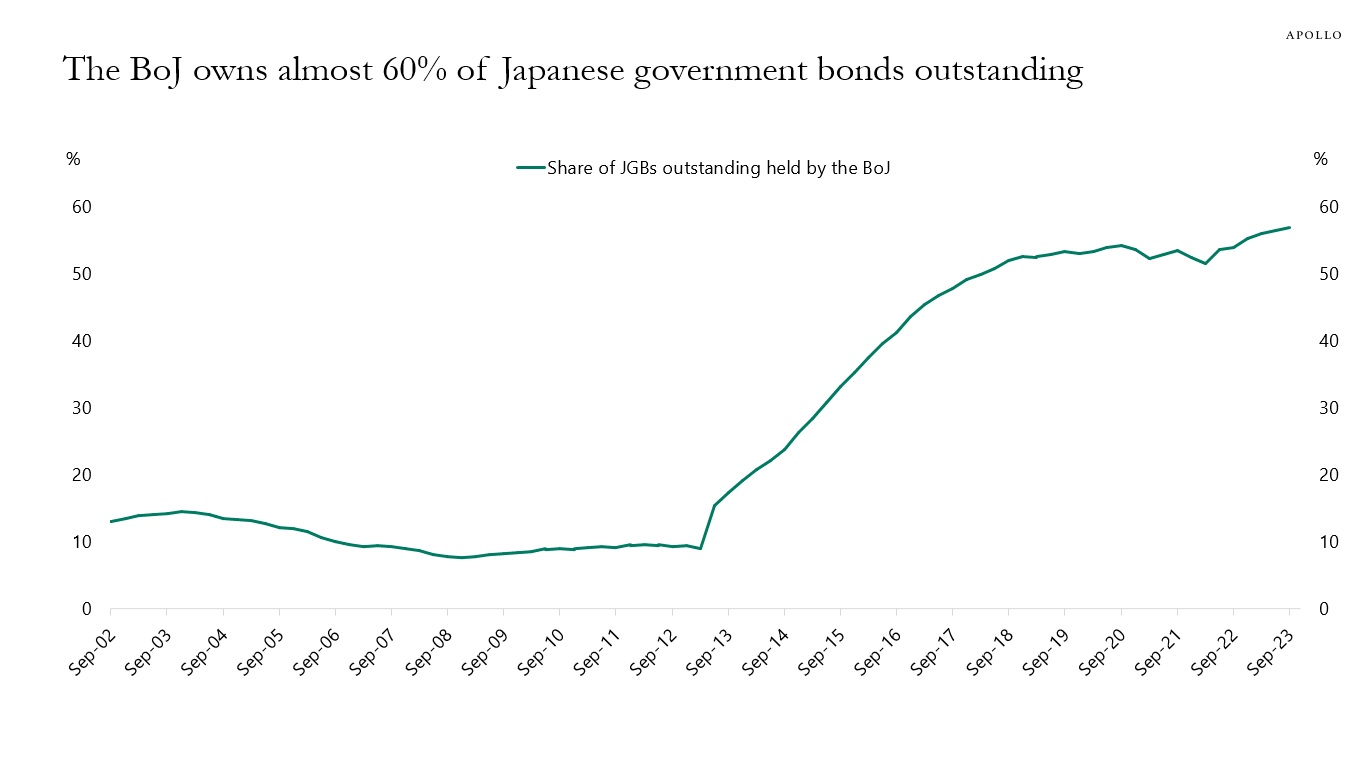
Source: BoJ, Bloomberg, Apollo Chief Economist 
See important disclaimers at the bottom of the page.
-
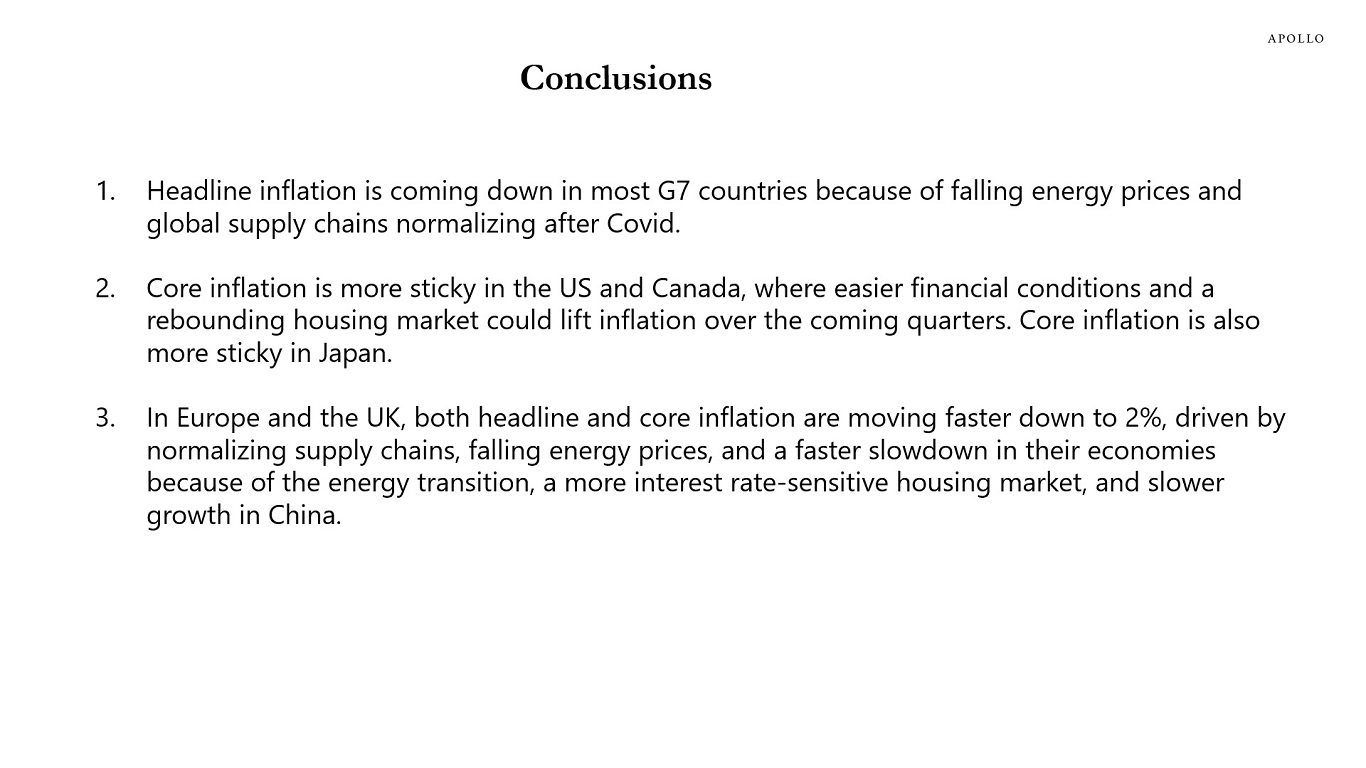
Our inflation outlook for the G7 is available here, there are three conclusions:
1. Headline inflation is coming down in most G7 countries because of falling energy prices and global supply chains normalizing after Covid.
2. Core inflation is more sticky in the US and Canada, where easier financial conditions and a rebounding housing market could lift inflation over the coming quarters. Core inflation is also more sticky in Japan.
3. In Europe and the UK, both headline and core inflation are moving faster down to 2%, driven by normalizing supply chains, falling energy prices, and a faster slowdown in their economies because of the energy transition, a more interest rate-sensitive housing market, and slower growth in China.
Source: Apollo Chief Economist 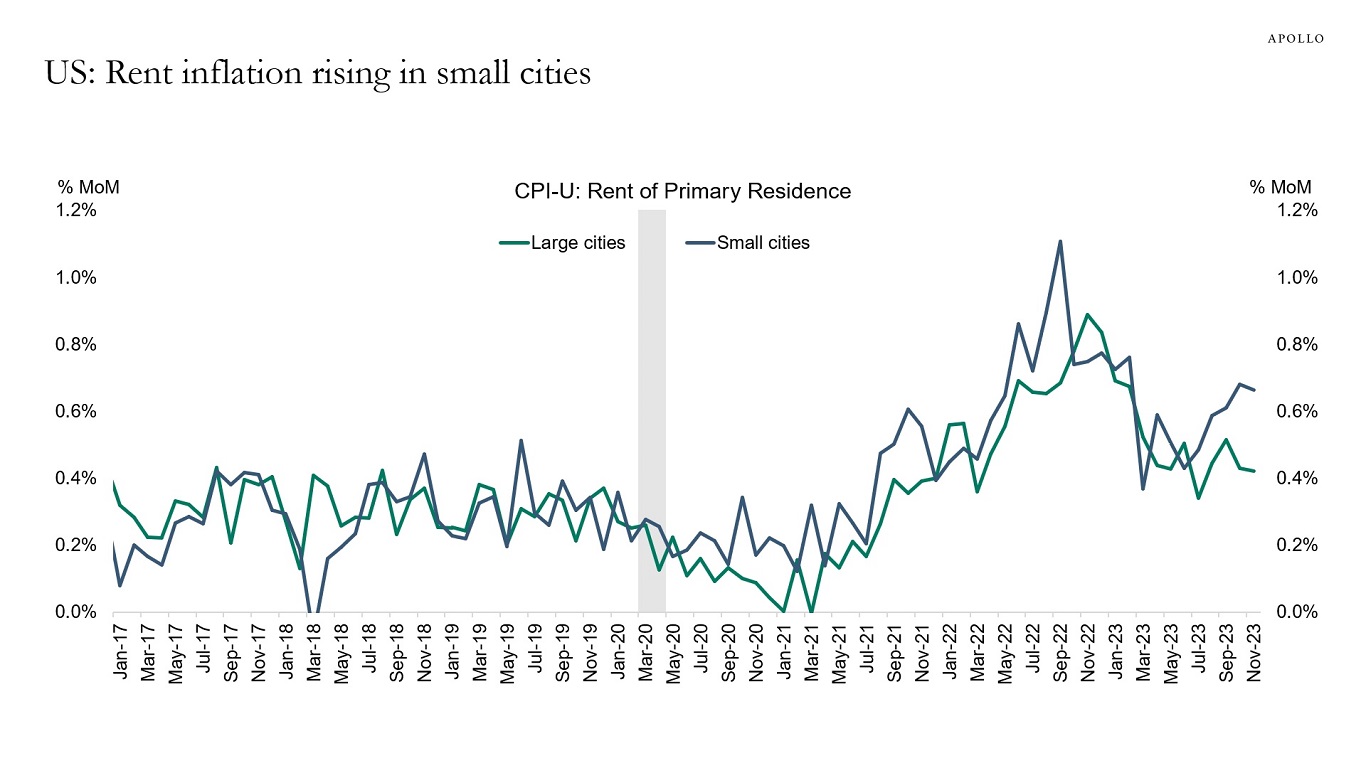
Source: BLS, Haver Analytics, Apollo Chief Economist 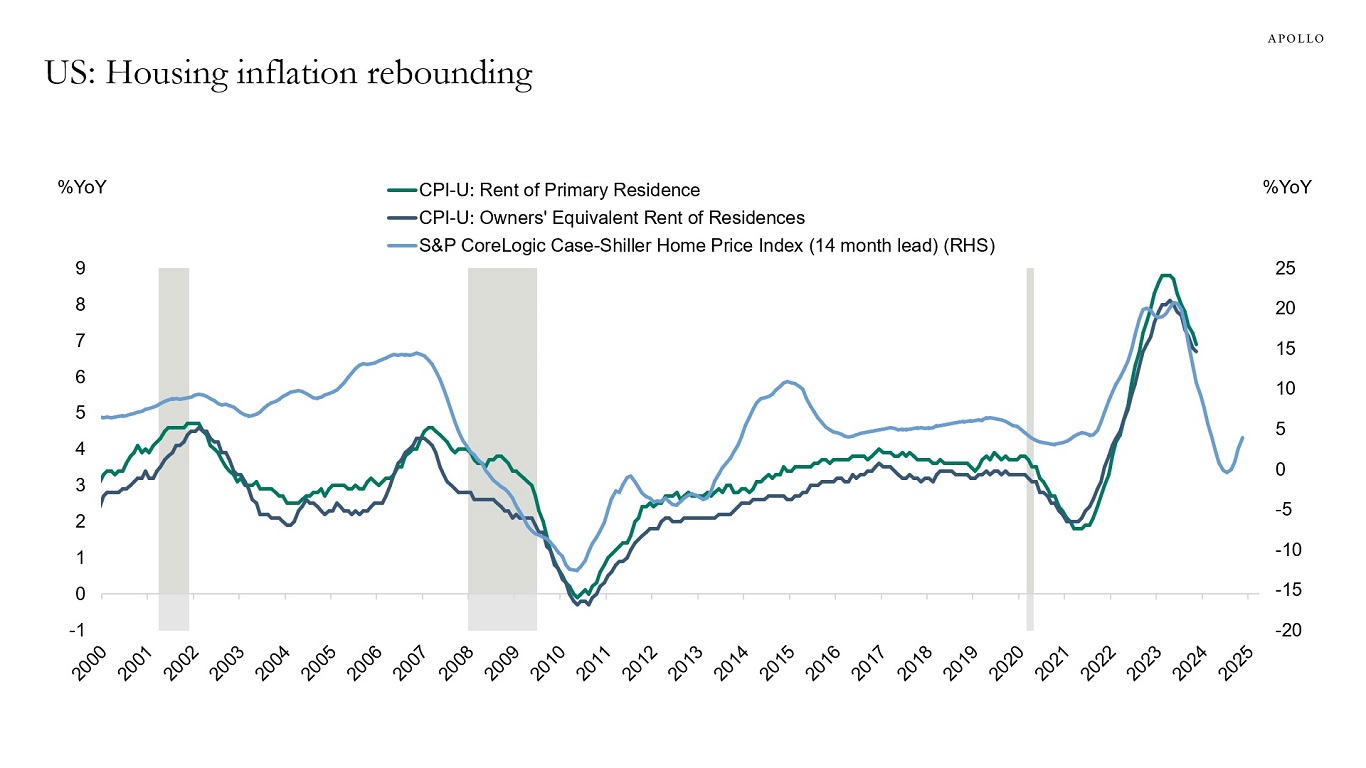
Source: BLS, Haver Analytics, Apollo Chief Economist See important disclaimers at the bottom of the page.
-
A majority of participants in the Apollo Academy class on my 2024 Economic and Capital Markets Outlook said that they are planning to allocate more to alternatives in 2024. In a poll taken during the live class on December 20, 59.7% of respondents said they planned to increase alts allocations in the year-ahead, while 20.3% said they didn’t plan to augment allocations (see chart).
Interestingly, a small majority of participants, 51.4%, said they were “more concerned” about the future course of inflation when planning client allocations than they were before the “Fed pivot” on December 13. Another 35.3% said they were “less concerned,” while 13.3% said they weren’t concerned (see chart). These results point to an interesting paradox: By signaling that they weren’t as concerned with the course of inflation as they had previously been, the FOMC’s board members may have inadvertently prompted an economic boomlet, leading to the increase of the very thing of which they themselves had expressed a decrease—concerns over inflation.
We asked a similar question about participants’ expectations of a US recession after the “Fed pivot.” A majority, 54.8%, said they were “less concerned” about a recession in 2024 than before the pivot; 32.4% were “more concerned” than previously; 12.8% said they weren’t concerned.
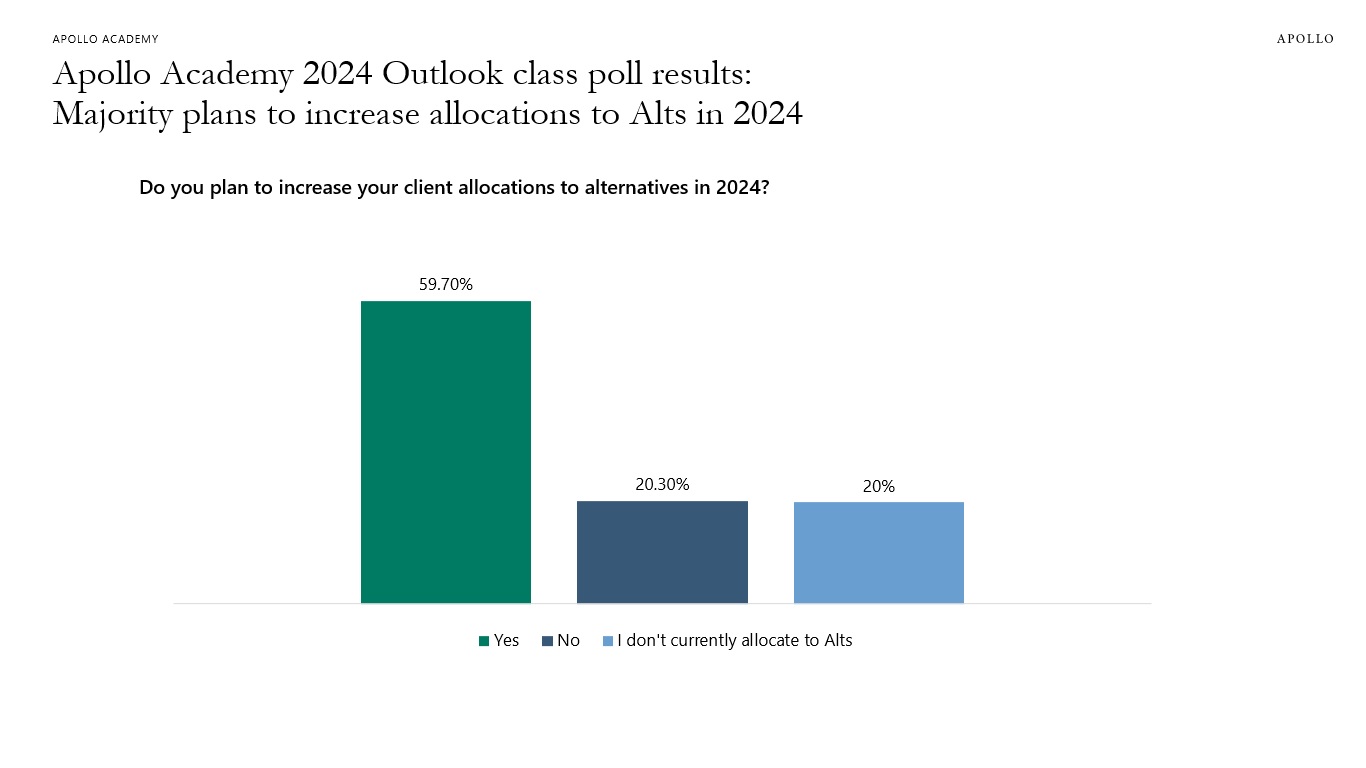
Survey taken from live participants in the Apollo Academy class on the 2024 Economic and Capital Markets Outlook on December 20, 2023. Results based on 672 total votes. 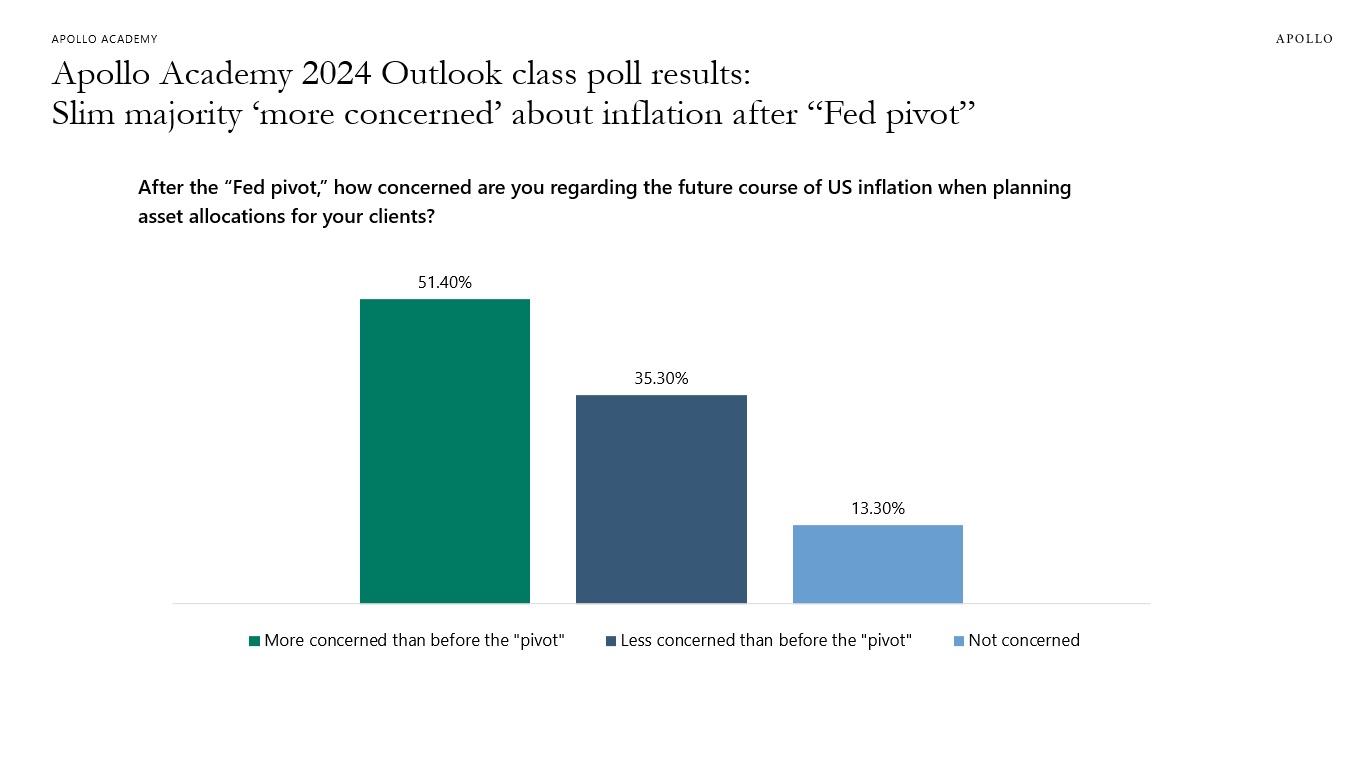
Survey taken from live participants in the Apollo Academy class on the 2024 Economic and Capital Markets Outlook on December 20, 2023. Results based on 711 total votes. 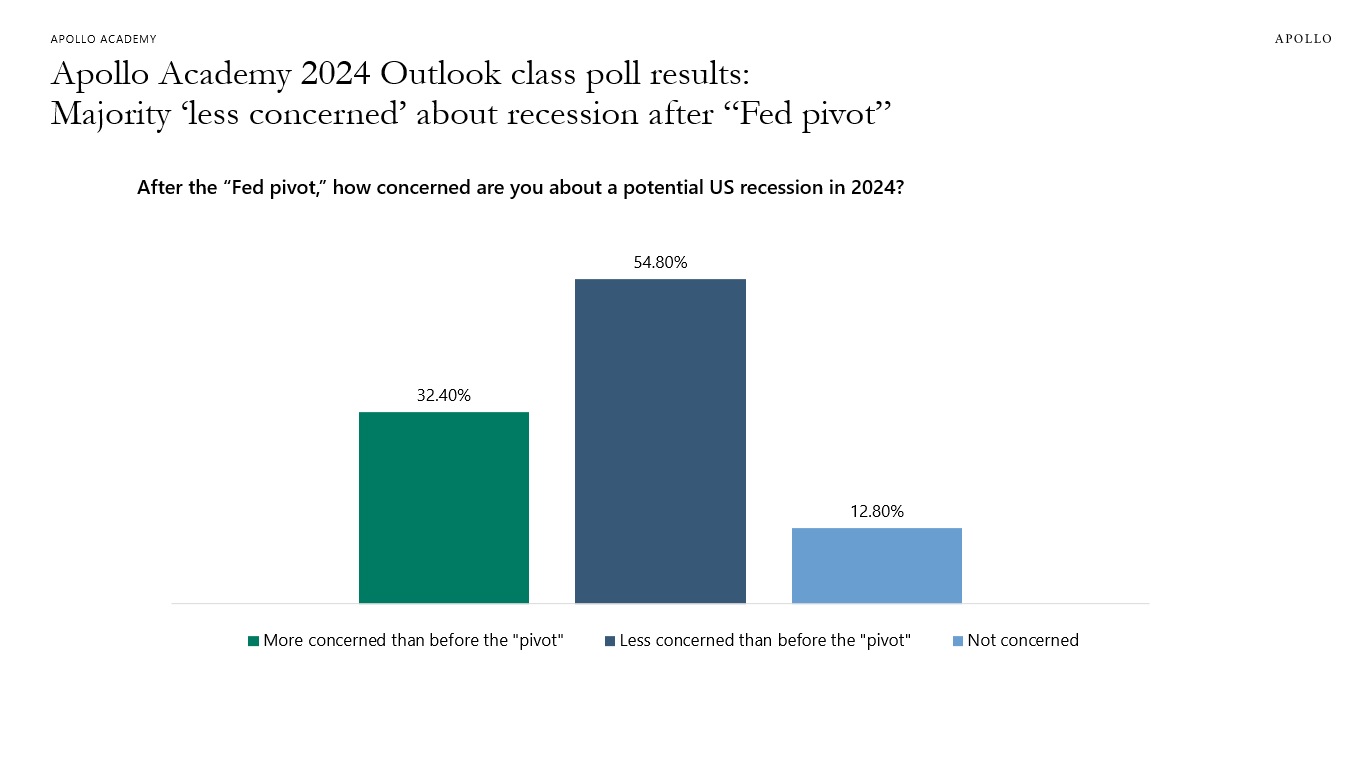
Survey taken from live participants in the Apollo Academy class on the 2024 Economic and Capital Markets Outlook on December 20, 2023. Results based on 690 total votes. See important disclaimers at the bottom of the page.
-
Financial conditions are easier today than when the Fed started raising rates in March 2022 (see chart below), and the same picture can be seen for the measures of financial conditions from the Chicago Fed, St. Louis Fed, and the Kansas City Fed. With core CPI inflation still at 4.0%, this will be a problem for the Fed in 2024.
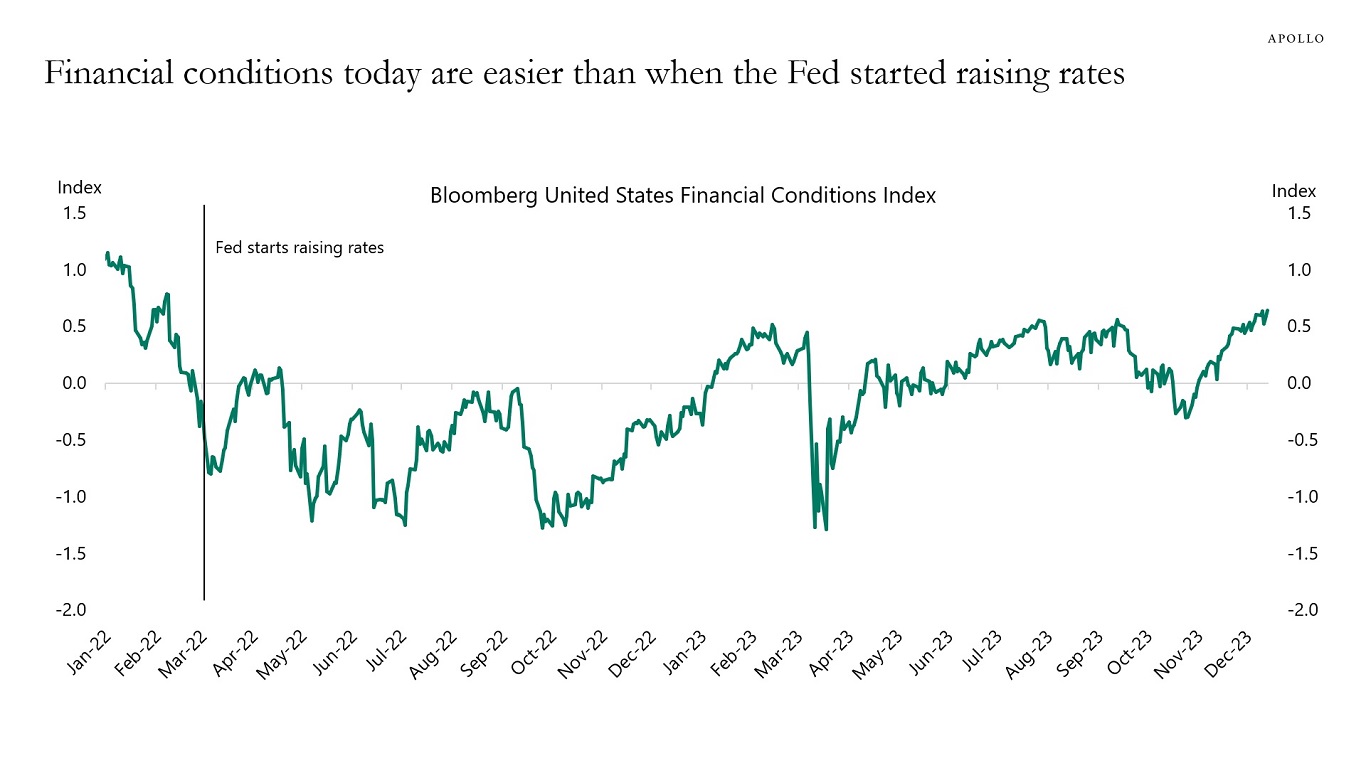
Source: Bloomberg, Apollo Chief Economist. Note: The Bloomberg US Financial Conditions Index tracks the overall level of financial stress in the US money, bond, and equity markets to help assess the availability and cost of credit. A positive value indicates accommodative financial conditions, while a negative value indicates tighter financial conditions relative to pre-crisis norms. See important disclaimers at the bottom of the page.
-
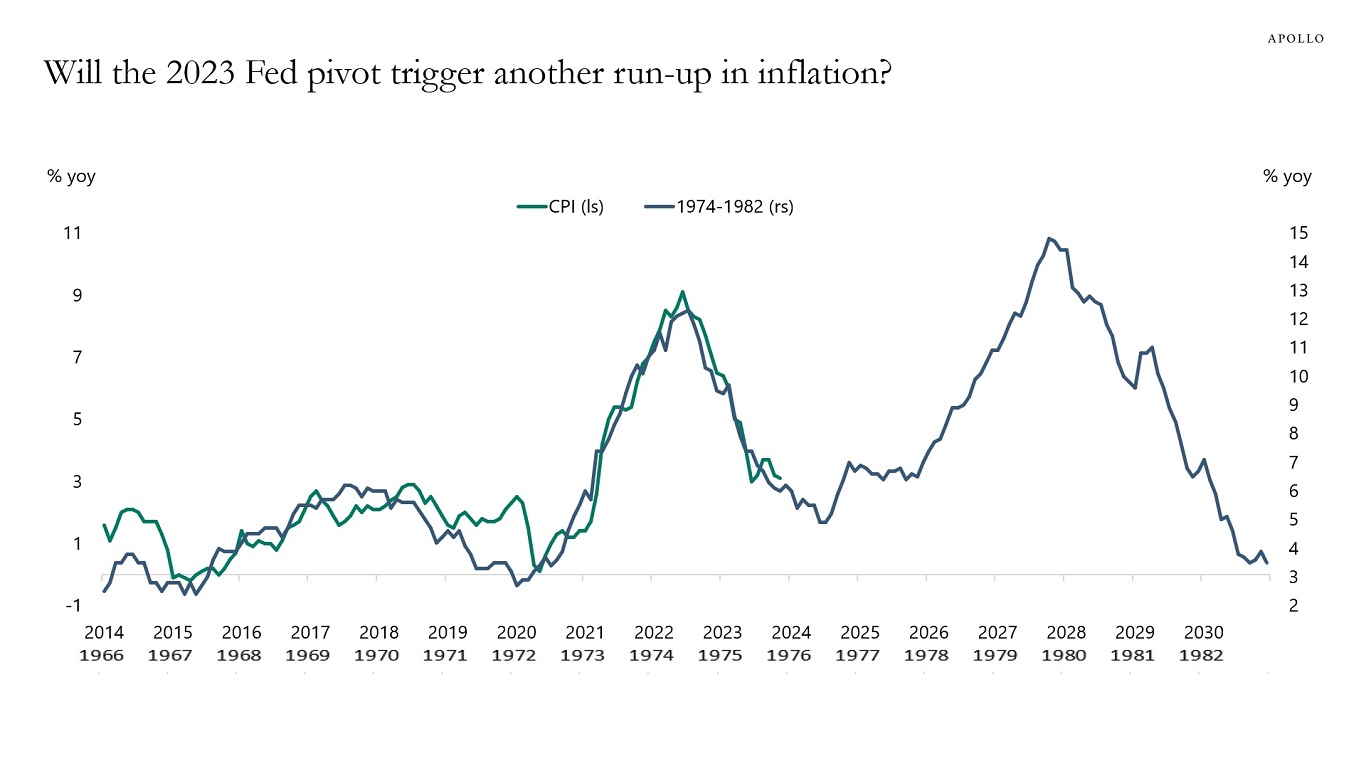
With the Fed worrying less about inflation and more about growth, the risks are rising that easier financial conditions triggered by the Fed’s pivot could start another rise in inflation driven by higher prices on housing, labor, services, and goods, see chart below.
Source: BLS, Haver Analytics, Apollo Chief Economist See important disclaimers at the bottom of the page.
-
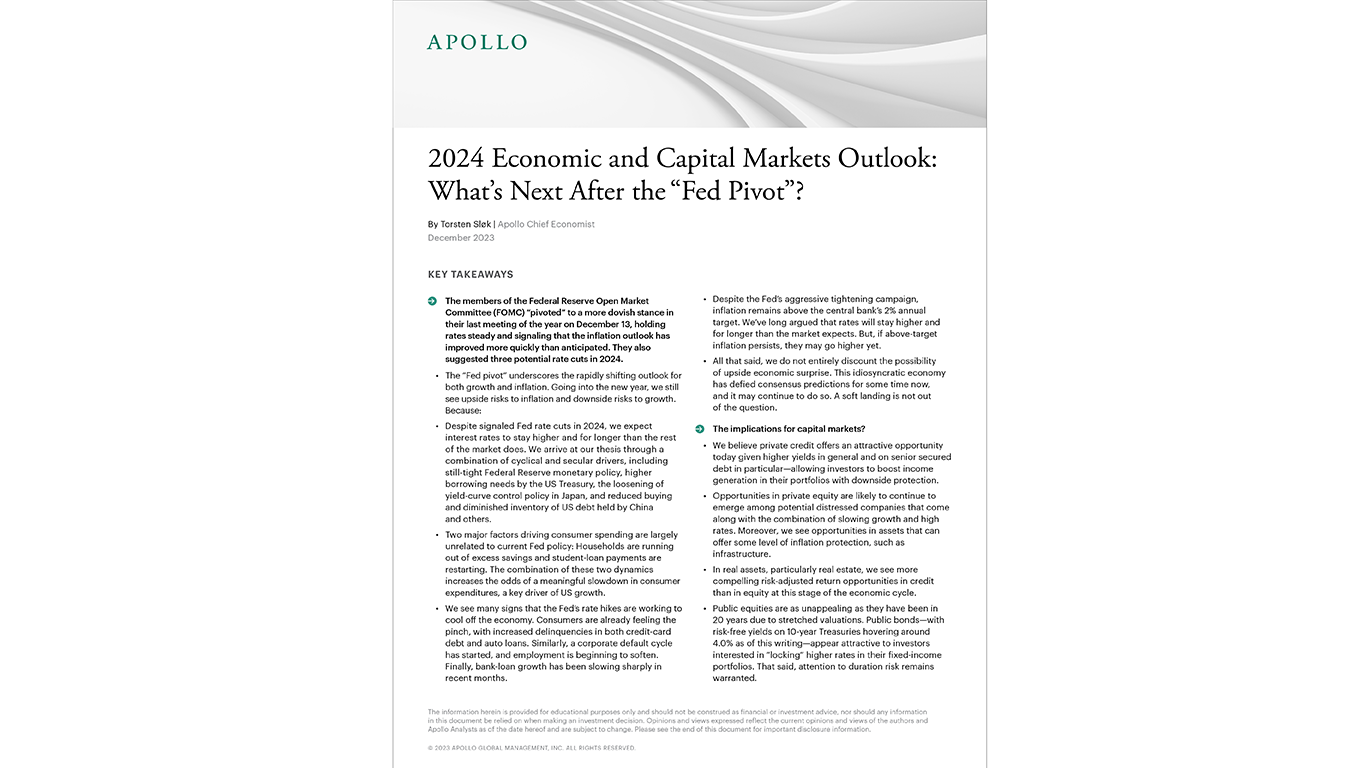
The “Fed pivot” on December 13 to a dovish stance underscored the rapidly shifting outlook for both growth and inflation. Markets have reacted in kind. But the bottom line is that going into 2024, we still see upside risks to inflation, downside risks to growth, and expect rates to stay higher and for longer than the rest of the market does.
We published our consolidated views in my newest white paper, 2024 Economic and Capital Markets Outlook: What’s Next After the “Fed Pivot”? You can download it here.
I will also be discussing the contents of the paper and my views in detail in an Apollo Academy class today, Dec. 20, at 11:00 ET (eligible for a CE credit). Register here.
See important disclaimers at the bottom of the page.
-
Last week, the Fed went from expecting another 25-basis point hike to now expecting 75-basis point cuts in 2024, and the chart below quantifies the impact of this 100-basis point pivot on the economy. At the same time, the market now expects 150 basis points in Fed cuts in 2024, and 10-year interest rates have declined by 100 basis points since they peaked at 5% in October.
The Fed pivot combined with a one standard deviation decline in VIX, a 60-basis point tightening in IG spreads since March, and a $20 decrease in oil prices since September will boost GDP growth by 1.5% over the coming quarters, see chart below.
The CBO estimates that potential growth in the US is 2%, so a 1.5% boost to GDP is significant. Stronger GDP growth will boost demand for housing, labor, airlines, hotels, restaurants, and goods, which ultimately will put renewed upward pressure on inflation.
The conclusion for markets is that the Fed pivot last week complicates the Fed’s goal of getting inflation back to 2%, and as we enter 2024, the pendulum will soon swing back from a dovish Fed to a more hawkish Fed.
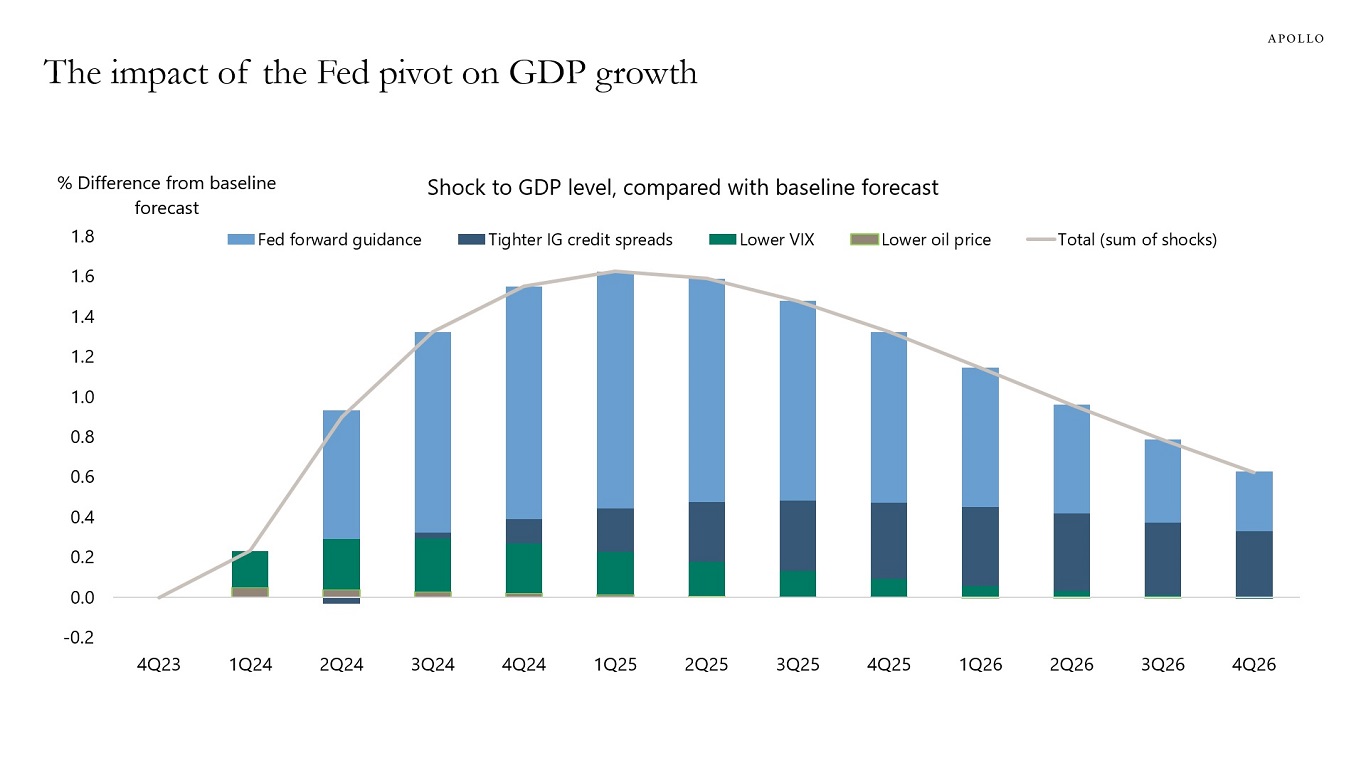
Source: Bloomberg SHOK, Apollo Chief Economist. Note: $20 oil price decline, 60bps tighter IG spreads, 1std decline in VIX, and 100bps lower rates via changed Fed forward guidance. See important disclaimers at the bottom of the page.
-
All supply chain indicators are now back near 2019 levels, see charts below and in this chart book.
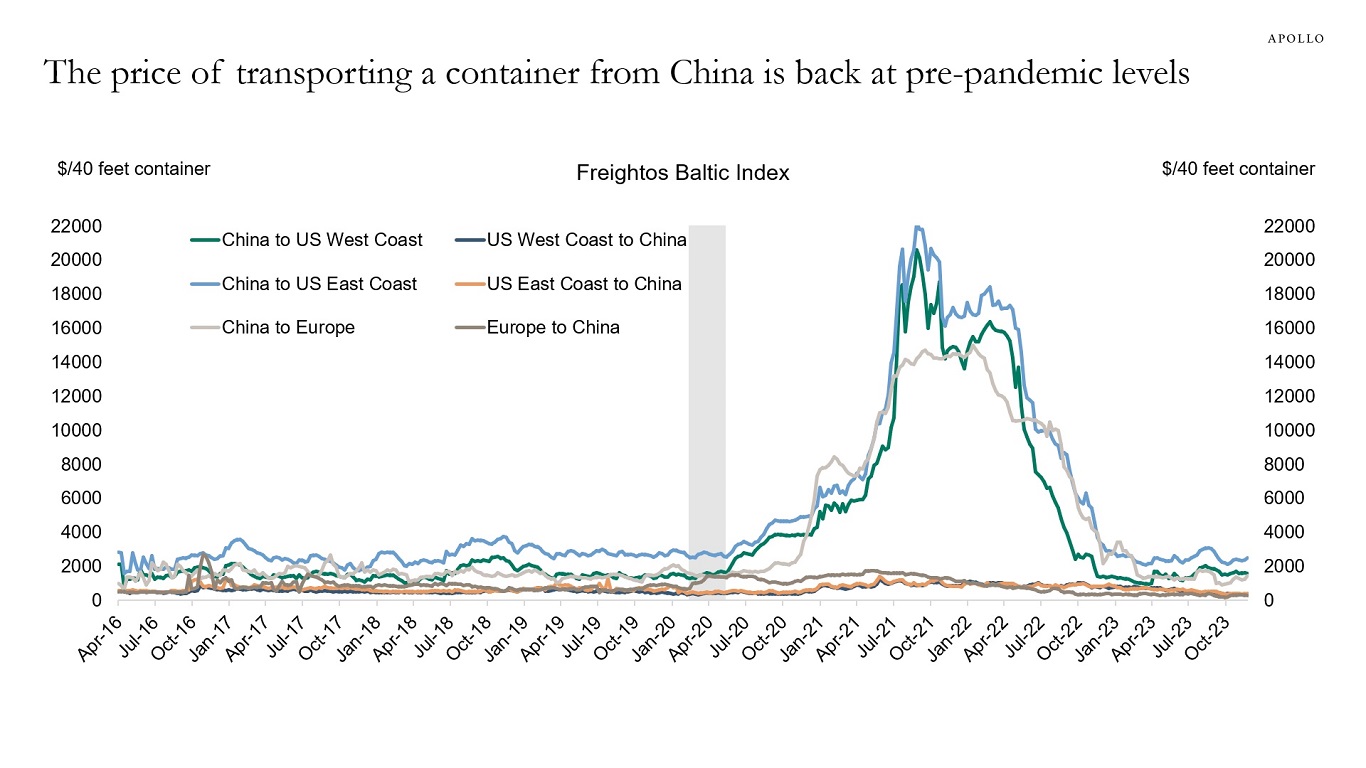
Source: Freightos, Bloomberg, Apollo Chief Economist 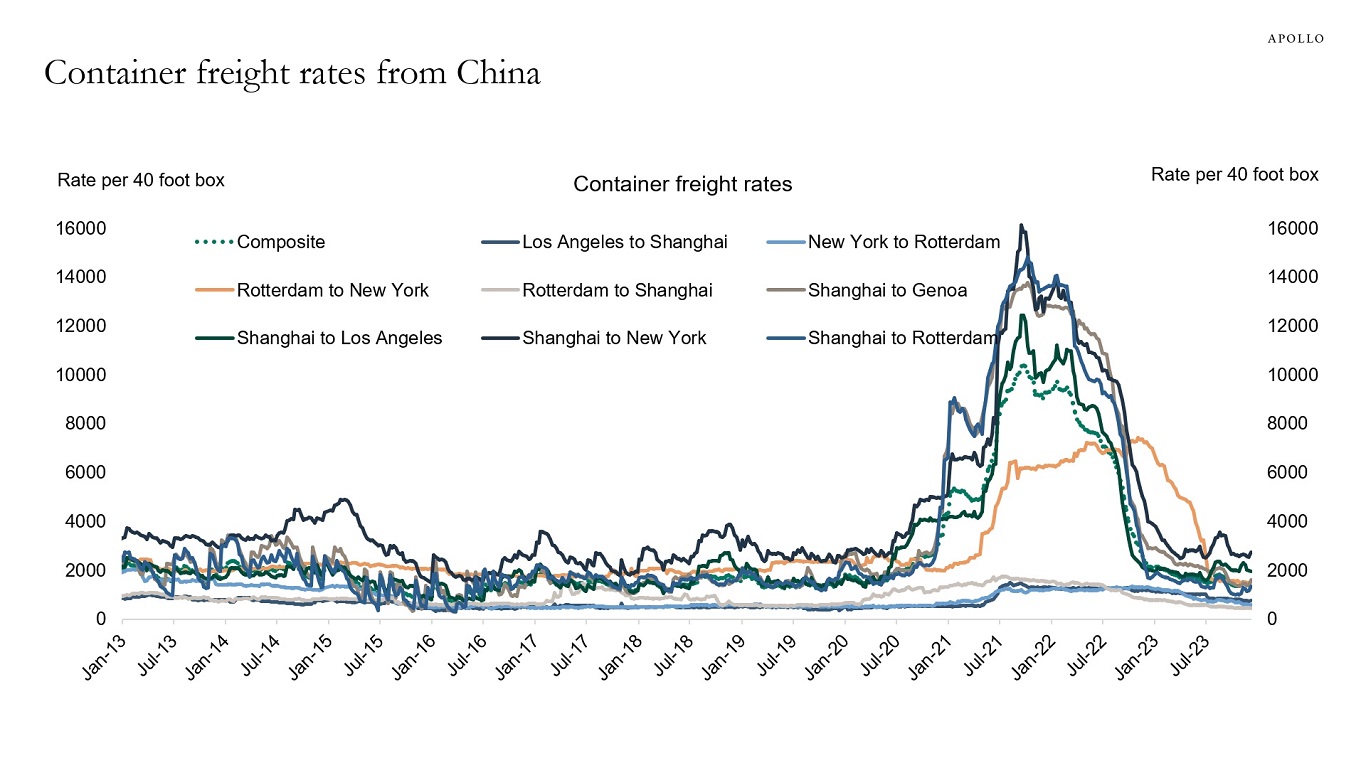
Source: WCI, Bloomberg, Apollo Chief Economist 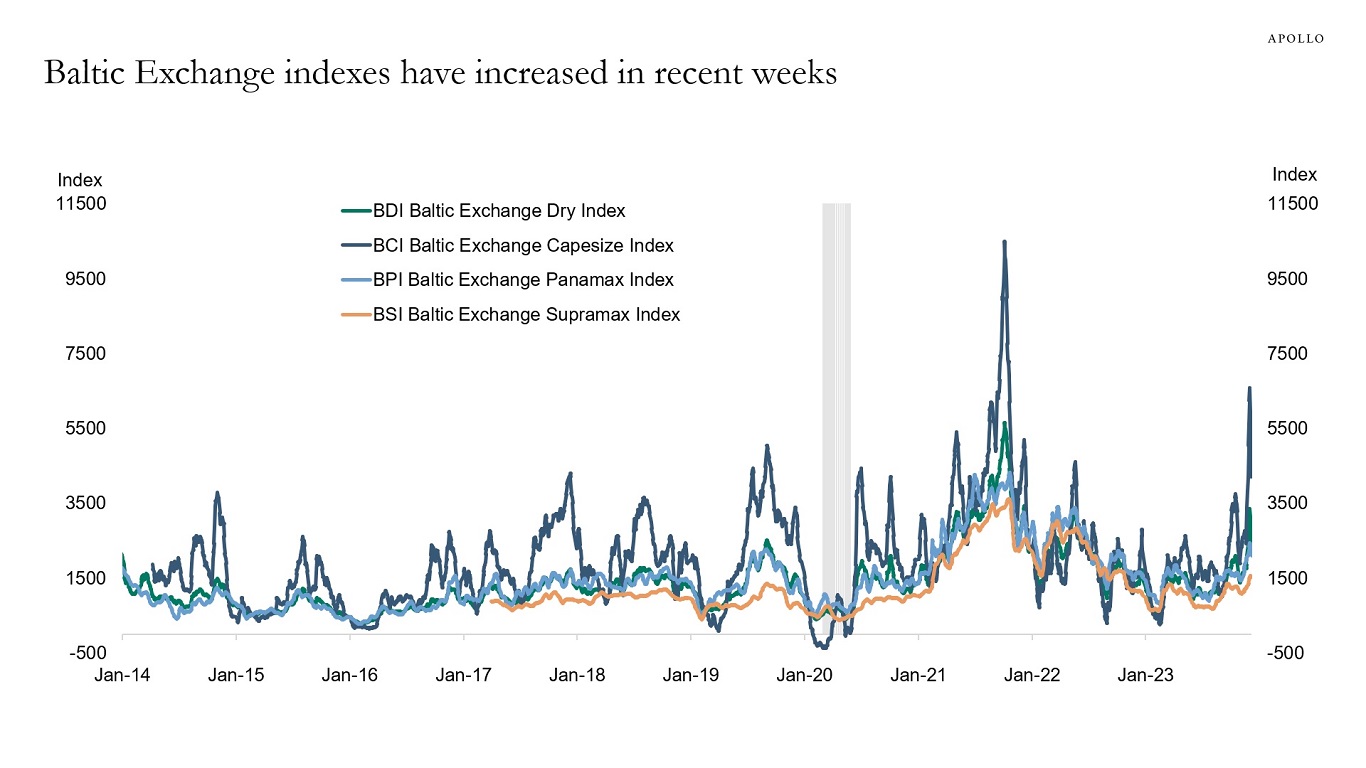
Source: Bloomberg, Apollo Chief Economist 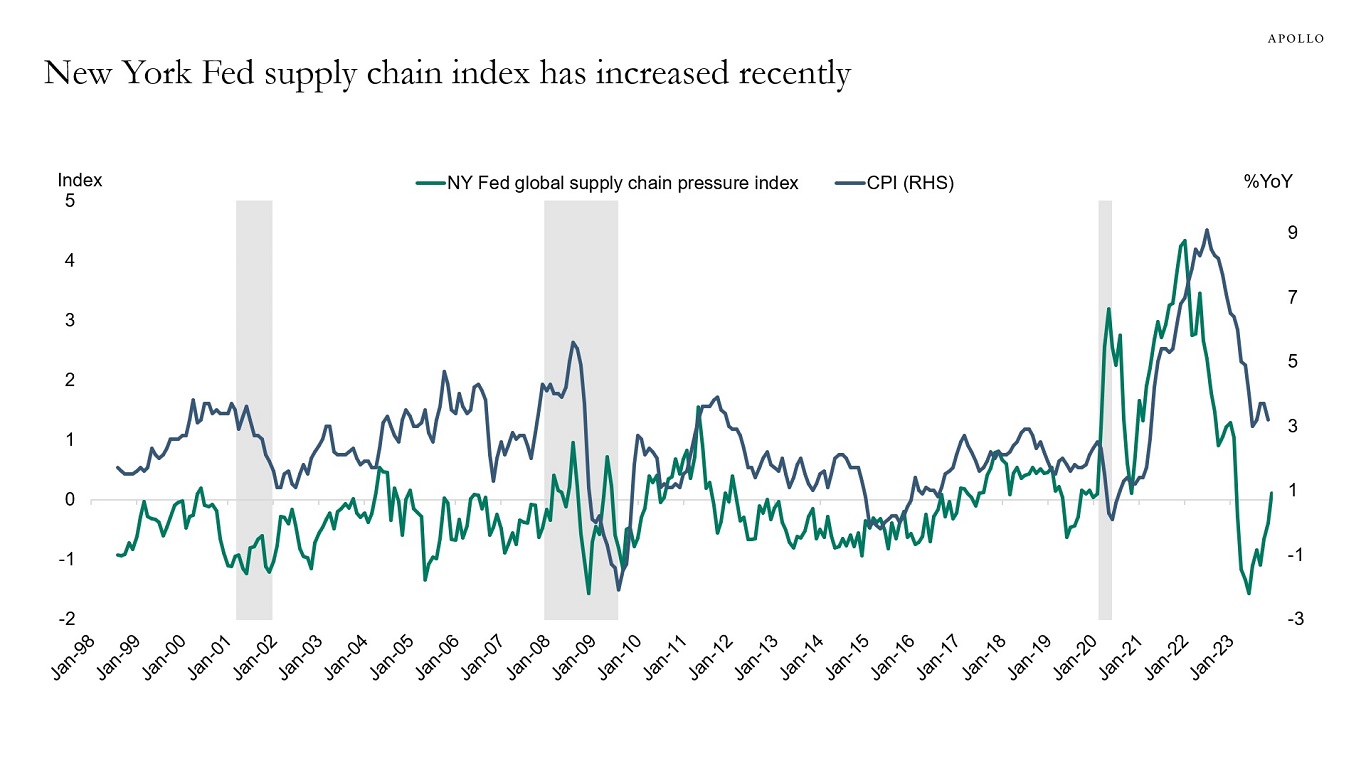
Source: NY Fed, BLS, Haver Analytics, Apollo Chief Economist See important disclaimers at the bottom of the page.

This presentation may not be distributed, transmitted or otherwise communicated to others in whole or in part without the express consent of Apollo Global Management, Inc. (together with its subsidiaries, “Apollo”).
Apollo makes no representation or warranty, expressed or implied, with respect to the accuracy, reasonableness, or completeness of any of the statements made during this presentation, including, but not limited to, statements obtained from third parties. Opinions, estimates and projections constitute the current judgment of the speaker as of the date indicated. They do not necessarily reflect the views and opinions of Apollo and are subject to change at any time without notice. Apollo does not have any responsibility to update this presentation to account for such changes. There can be no assurance that any trends discussed during this presentation will continue.
Statements made throughout this presentation are not intended to provide, and should not be relied upon for, accounting, legal or tax advice and do not constitute an investment recommendation or investment advice. Investors should make an independent investigation of the information discussed during this presentation, including consulting their tax, legal, accounting or other advisors about such information. Apollo does not act for you and is not responsible for providing you with the protections afforded to its clients. This presentation does not constitute an offer to sell, or the solicitation of an offer to buy, any security, product or service, including interest in any investment product or fund or account managed or advised by Apollo.
Certain statements made throughout this presentation may be “forward-looking” in nature. Due to various risks and uncertainties, actual events or results may differ materially from those reflected or contemplated in such forward-looking information. As such, undue reliance should not be placed on such statements. Forward-looking statements may be identified by the use of terminology including, but not limited to, “may”, “will”, “should”, “expect”, “anticipate”, “target”, “project”, “estimate”, “intend”, “continue” or “believe” or the negatives thereof or other variations thereon or comparable terminology.