


Want it delivered daily to your inbox?
-
The 60/40 portfolio continues to underperform, and households are getting more worried about their retirement, see chart below.
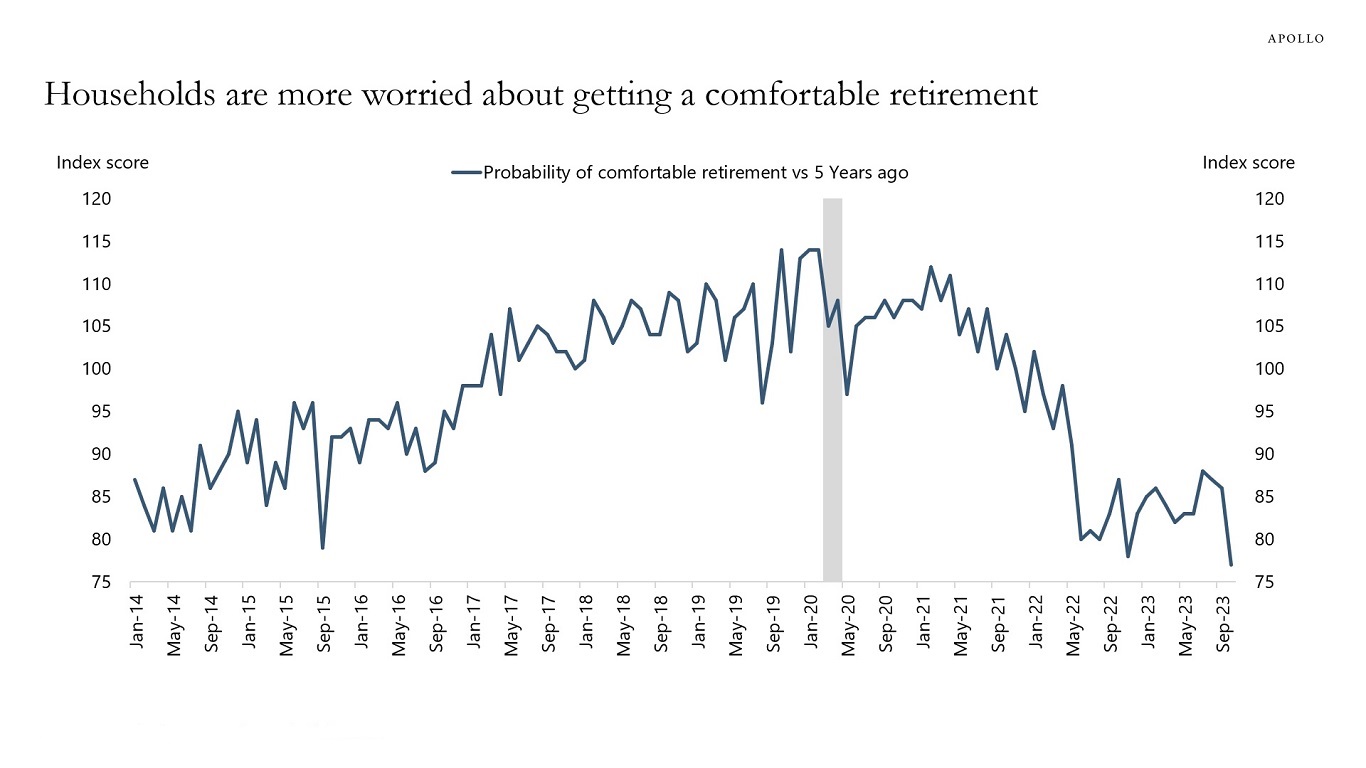
Source: University of Michigan, Haver Analytics, Apollo Chief Economist See important disclaimers at the bottom of the page.
-
European credit is more vulnerable to higher rates because the share of IG and HY bonds maturing within three years is higher in Europe than in the US, see charts below.
For US IG, the share has, for the past decade, been stable between 15% and 20%.
The bottom line is that Fed hikes and ECB hikes are having a negative impact on credit, but the impact is going to be more significant in Europe, which increases the likelihood of a harder landing in Europe.
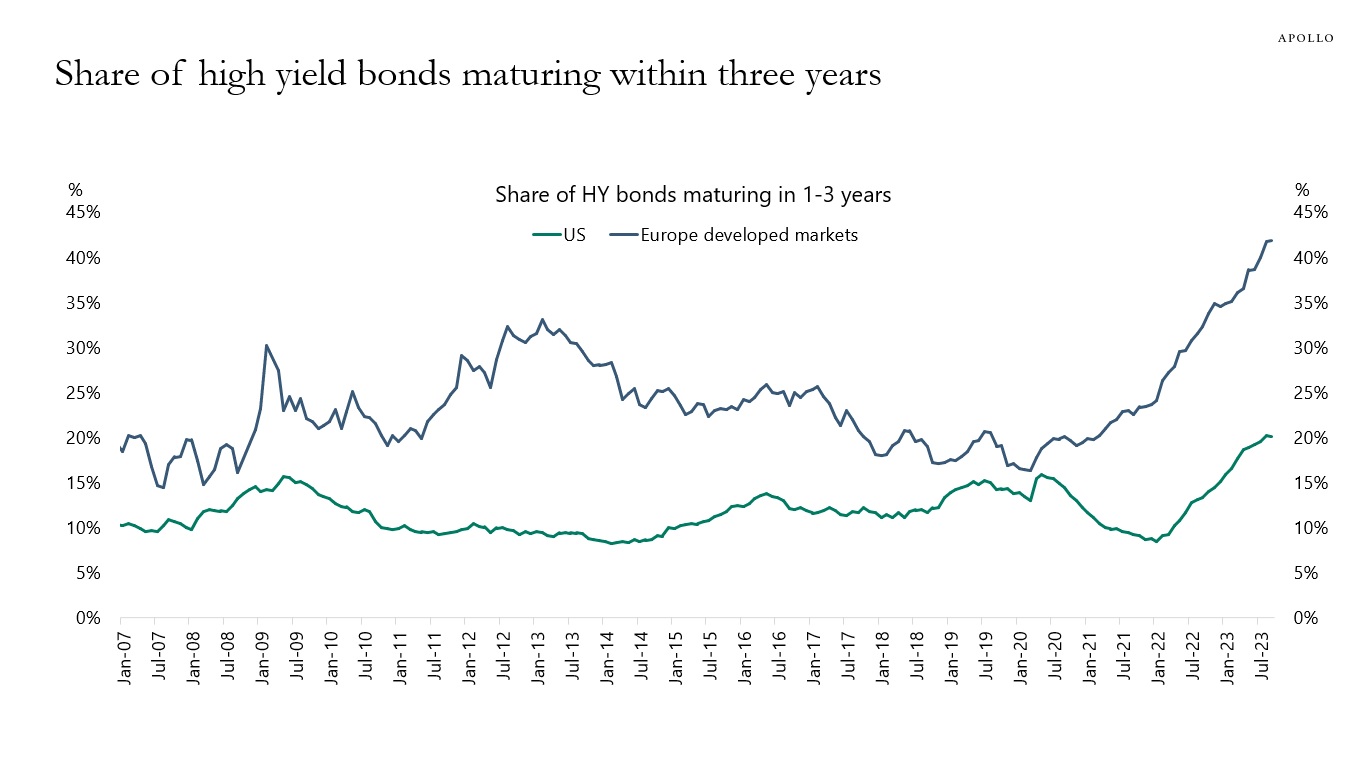
Source: ICE BofA, Bloomberg, Apollo Chief Economist 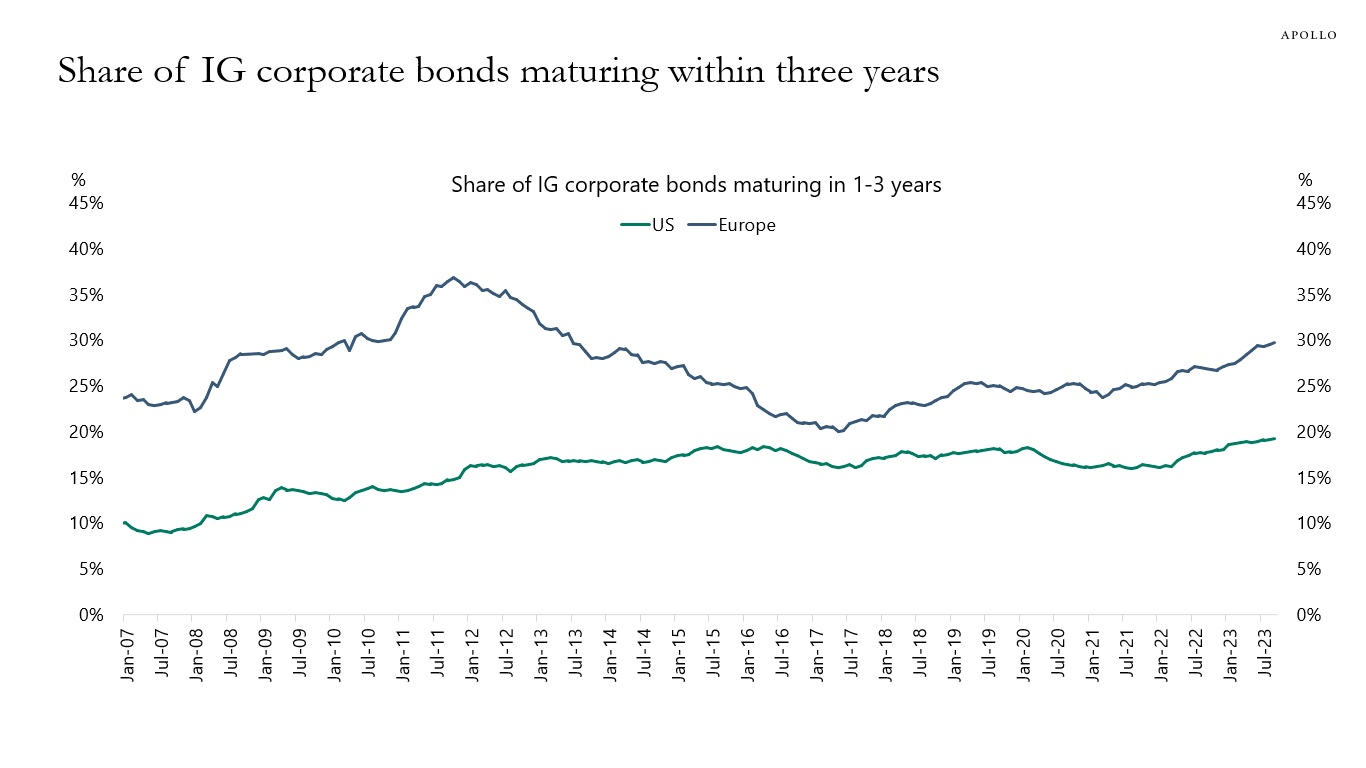
Source: ICE BofA, Bloomberg, Apollo Chief Economist See important disclaimers at the bottom of the page.
-
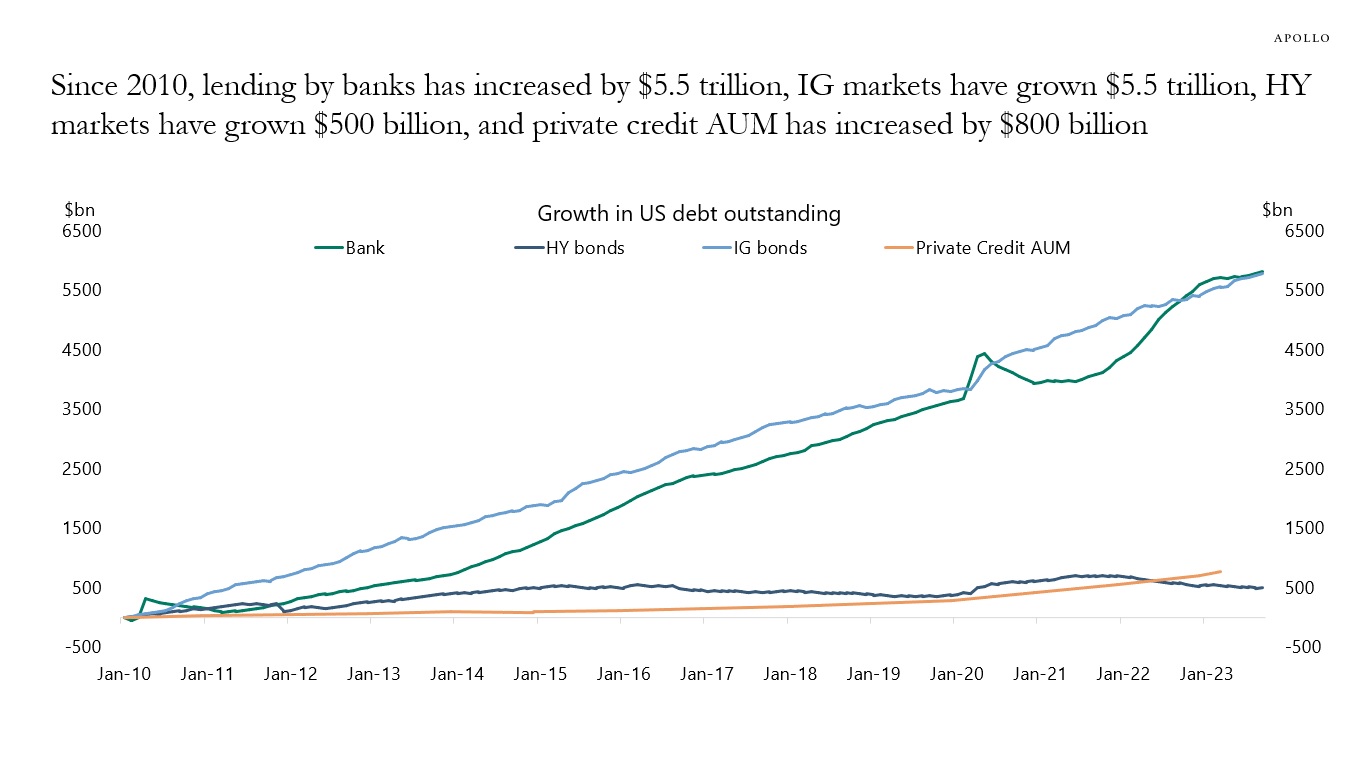
Since 2010, private credit has grown much slower than bank lending and IG markets, see chart below.
Our monthly outlook for private markets is available here.

Source: FRB, ICE BofA, Bloomberg, Apollo Chief Economist See important disclaimers at the bottom of the page.
-
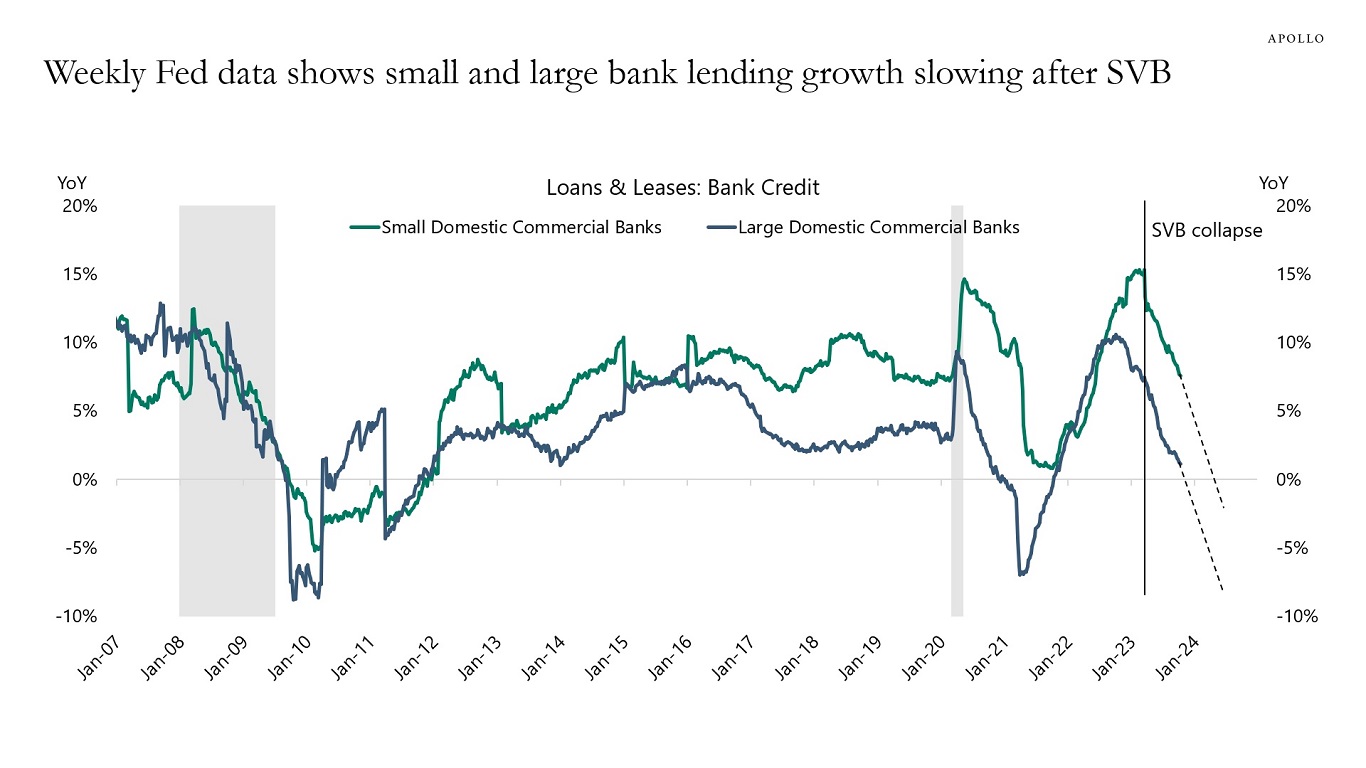
Our updated regional banking sector outlook is available here, and the weekly data shows a continued decline in loan growth in small and large banks, see the first chart.
The slowdown in loan growth is driven by Fed hikes and tighter lending standards following the SVB collapse.
With the Fed on hold until the middle of next year, these trends are likely to continue, and loan growth will soon turn negative.
Source: Federal Reserve Board, Haver Analytics, Apollo Chief Economist 
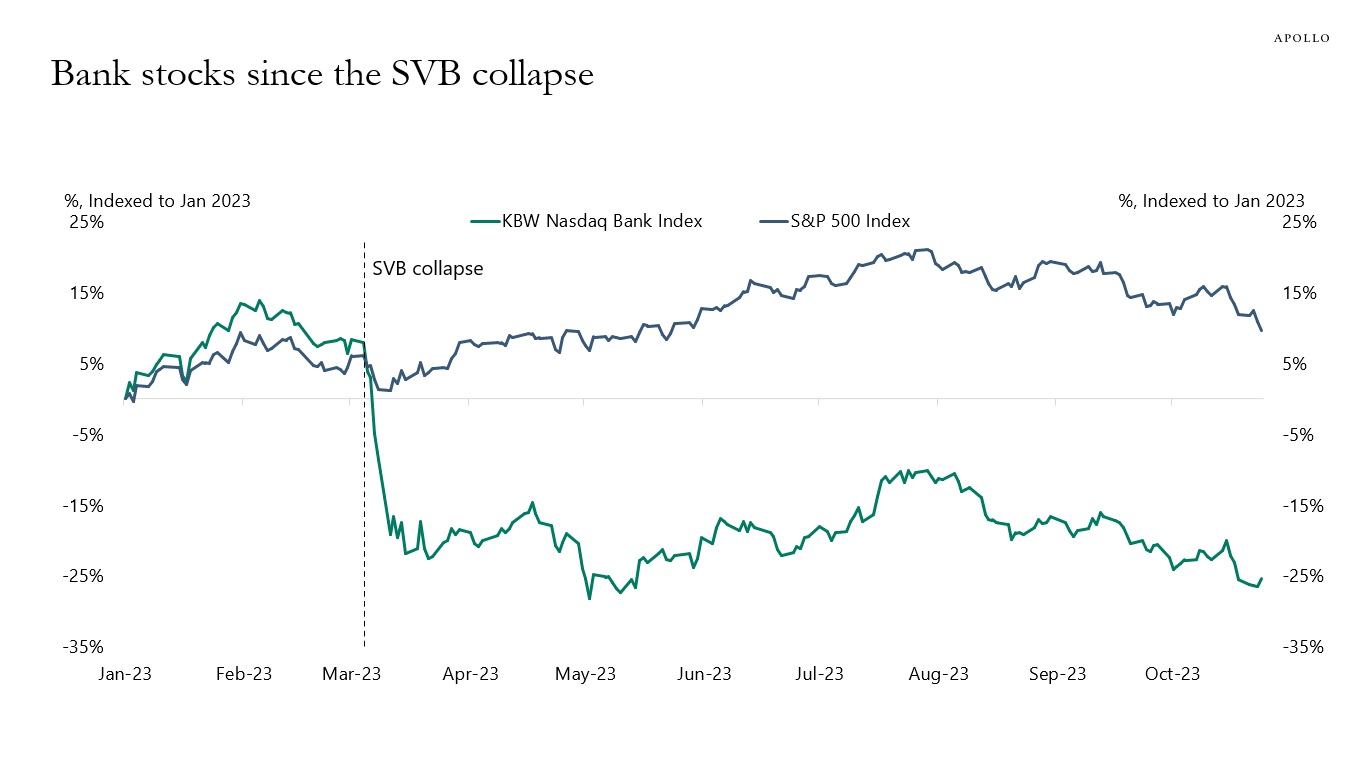
Source: Bloomberg, Apollo Chief Economist. Note: The KBW Bank Index consists of Bank of NY Mellon, Bank of America, Capital One Financial, Citigroup, Citizens Financial Group, Comerica, Fifth Third Bank, First Horizon, Huntington, JP Morgan Chase, Keycorp, M&T Bank, Northern Trust, PNC, People’s United Financial, Regions, State Street, Truist, US Bancorp, Wells Fargo, and Zions. 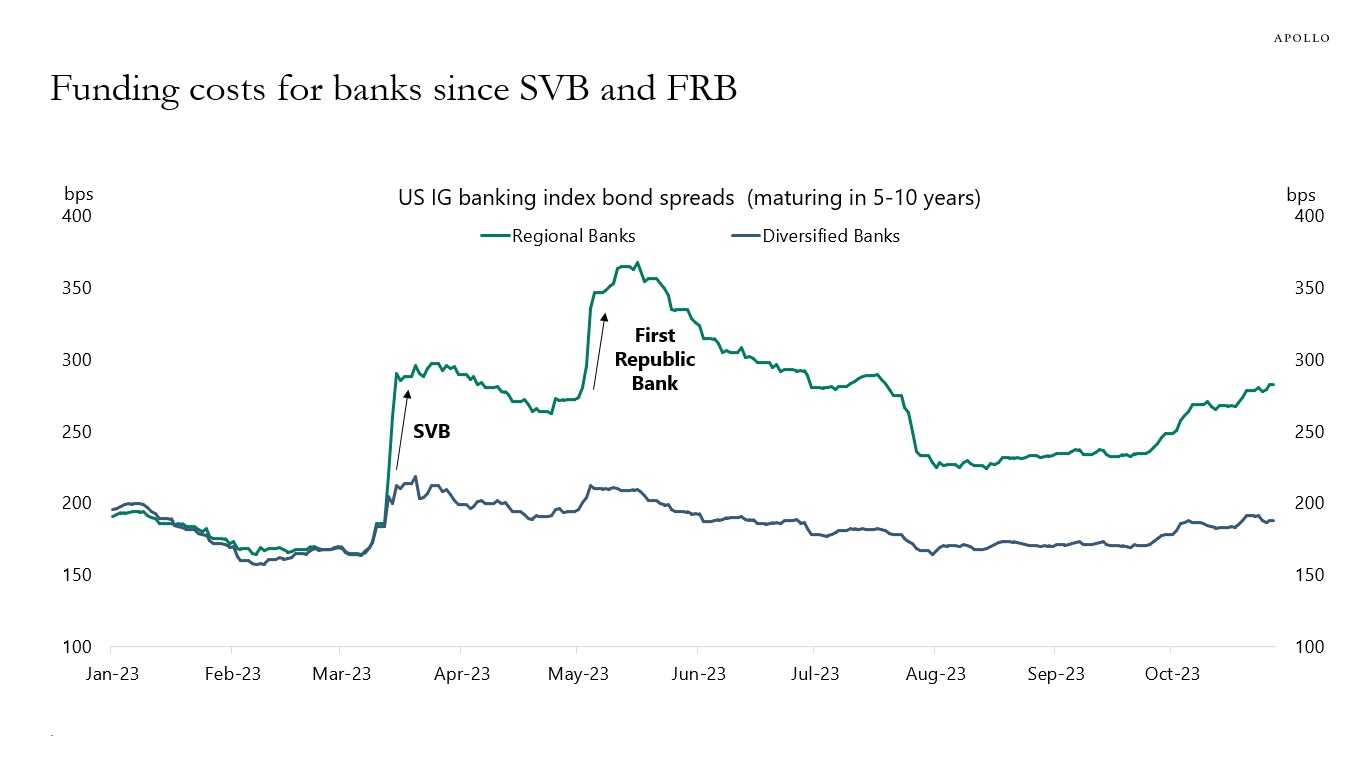
Source: ICE BofA, Bloomberg, Apollo Chief Economist. Note: Unweighted average spreads of bonds from ICE 5-10 Year US Banking Index, C6PX Index for bonds issued before January 1, 2023. There are eight banks in the Regional index and 41 banks in the Diversified index. Regional banks include BankUnited, Citizens Financial, Huntington, and Zions. Diversified banks include JP Morgan Chase, Citibank, and Bank of America. 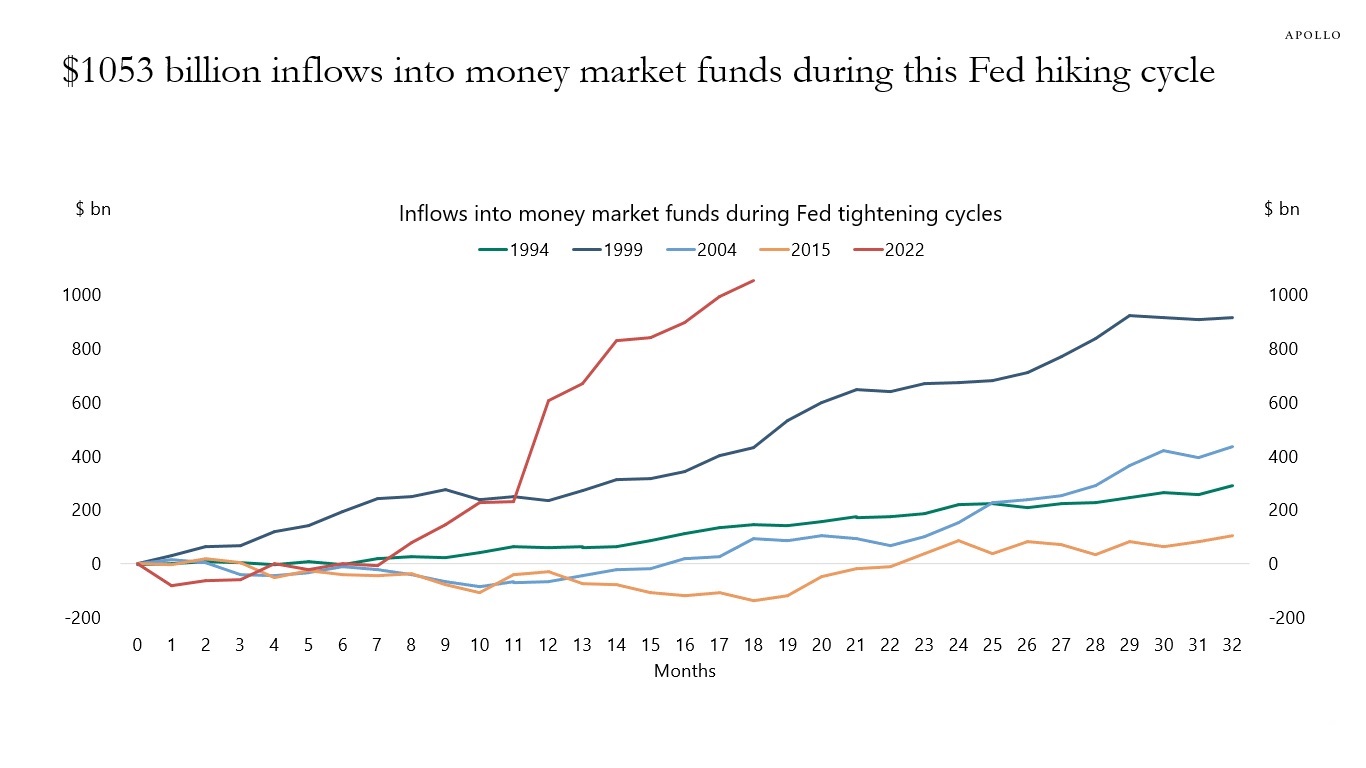
Source: FRB, ICI, Bloomberg, Apollo Chief Economist 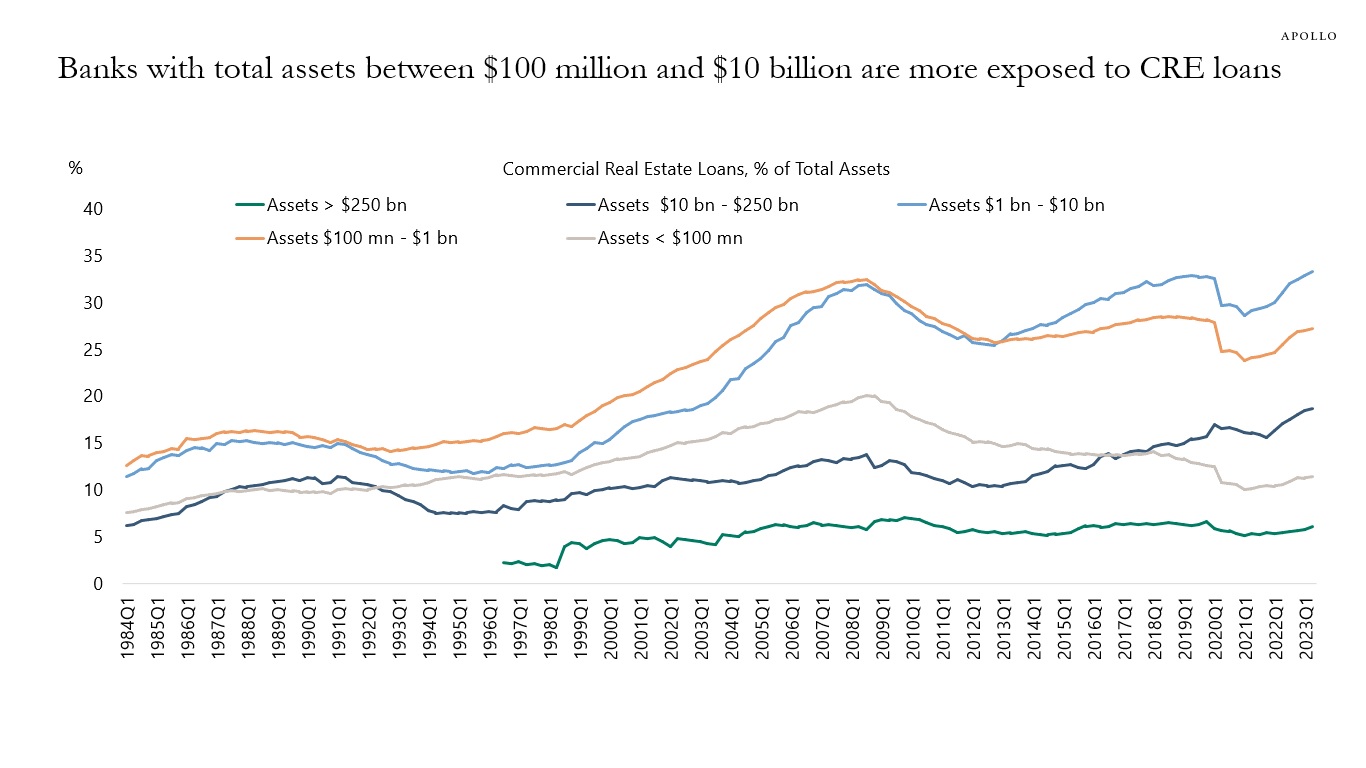
Source: FDIC, Apollo Chief Economist 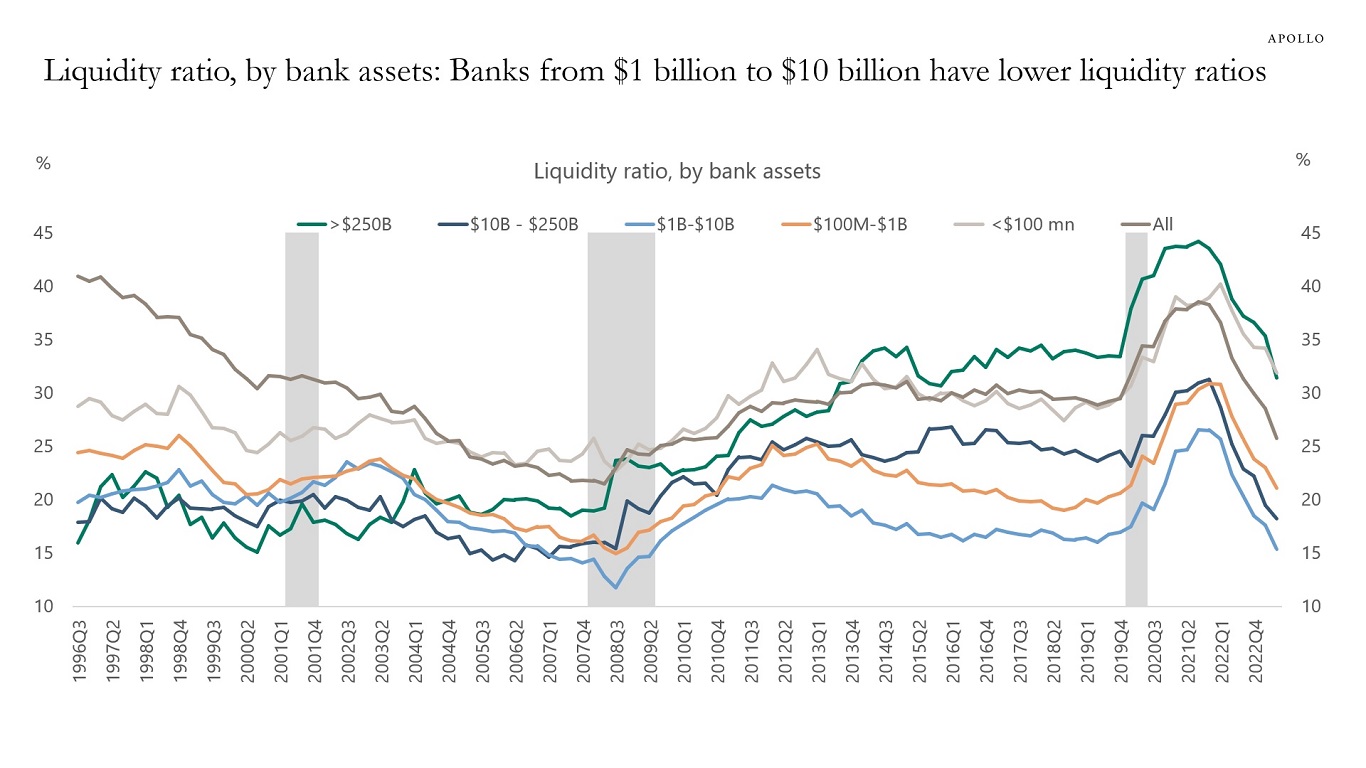
Source: FDIC, Bloomberg, Apollo Chief Economist See important disclaimers at the bottom of the page.
-
The Fed has since the beginning of 2023 steadily increased its estimate of the long-run fed funds rate, see chart below. The implication for investors is that the Fed is beginning to see the costs of capital as permanently higher. A permanent increase in the risk-free rate has important implications for firms, households, and asset allocation across equities and fixed income.
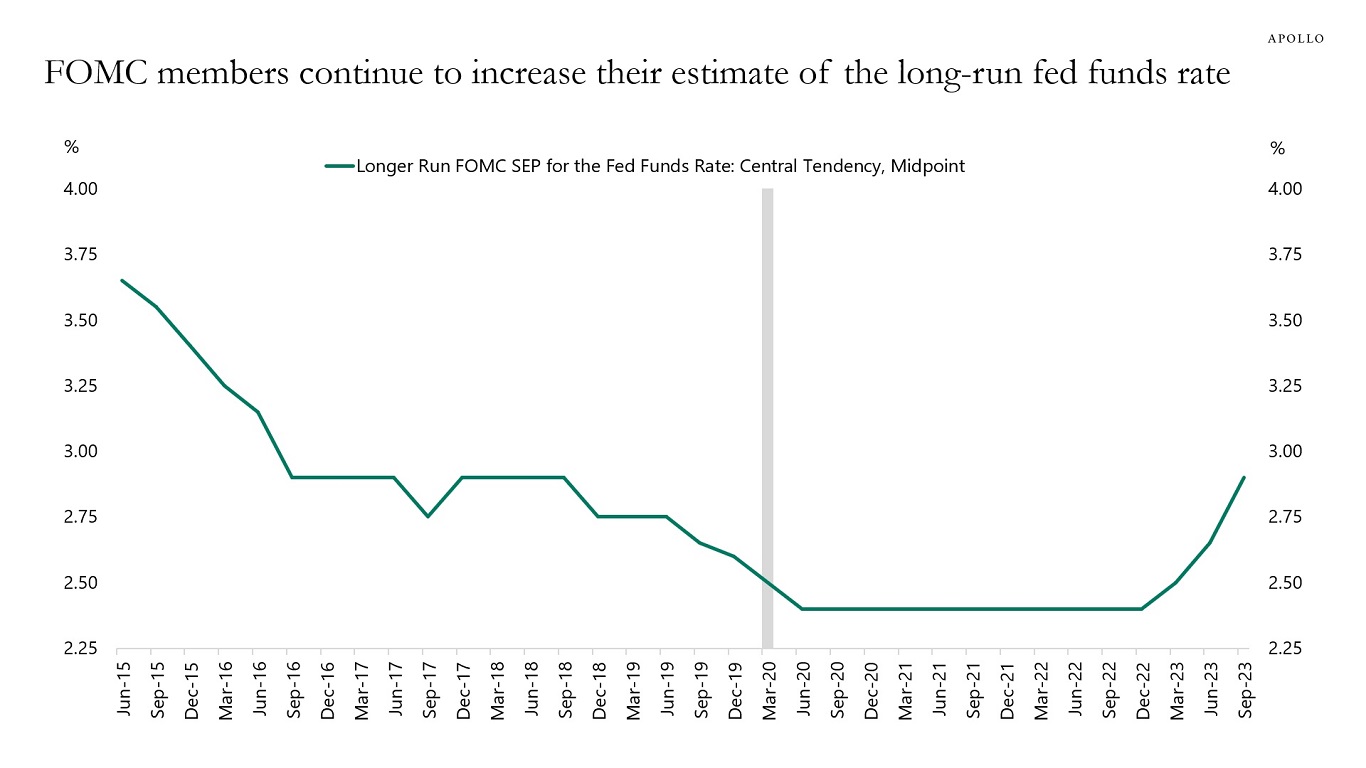
Source: FRB, Apollo Chief Economist See important disclaimers at the bottom of the page.
-
There is downward pressure on buybacks because of worries about a recession, the new tax on buybacks, and higher cost of capital.
These three forces make free cash flow more valuable for companies, see chart below.
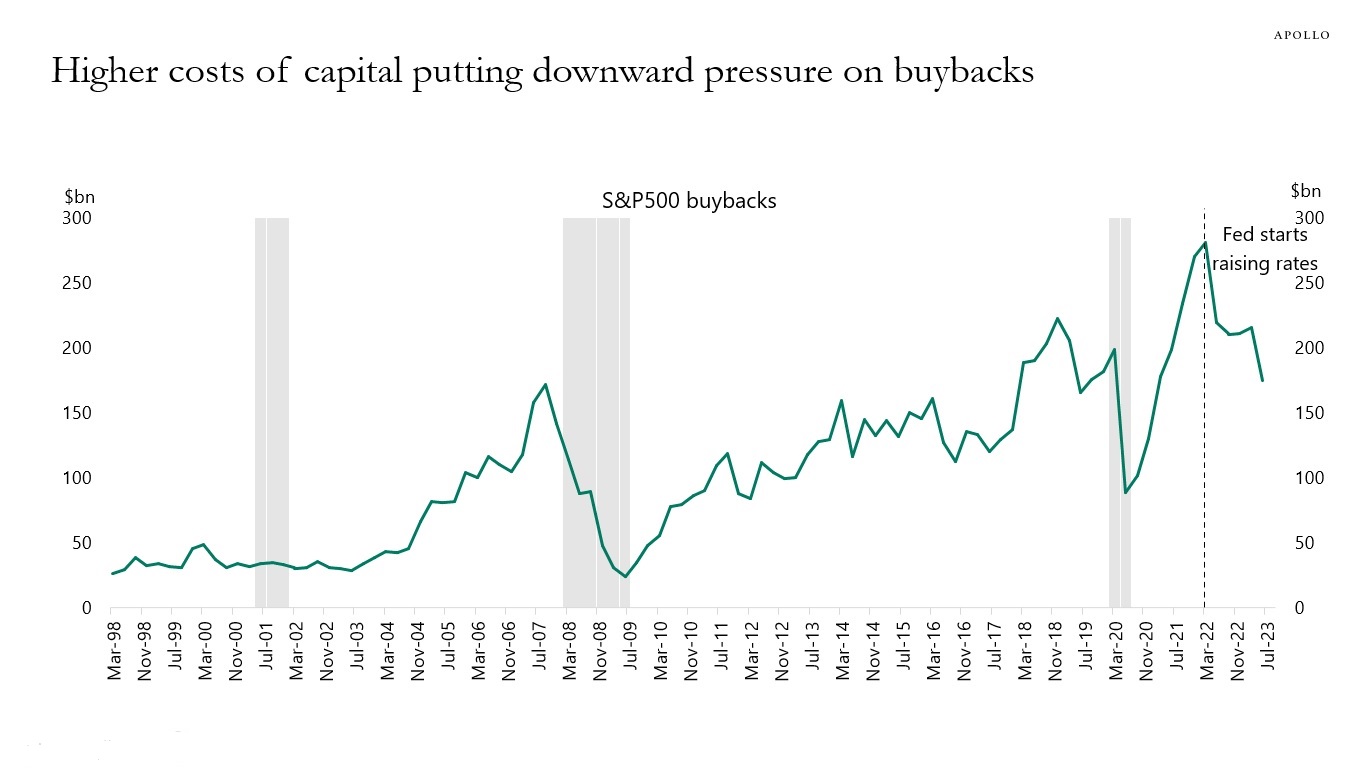
Source: Bloomberg, Apollo Chief Economist See important disclaimers at the bottom of the page.
-
Calculating the equity risk premium using trailing earnings and forward earnings shows that stocks are at their least-attractive levels in 20 years relative to bonds, see charts below.
The equity risk premium measures the return in the stock market minus the return of the risk-free rate, and it tells investors something about equity returns relative to fixed-income returns.
In the equity risk premium formula, equity returns are normally calculated by looking at the S&P500 earnings yield, i.e., the inverse of the P/E ratio. Using forward earnings expectations can be misleading when the consensus expects a 55% chance of a recession, so another variant is to look at the S&P500 earnings yield using trailing earnings.
Either way, the bottom line is that with 10-year interest rates close to 5%, the stock market today is more unappealing than it has been in 20 years, see again charts below.
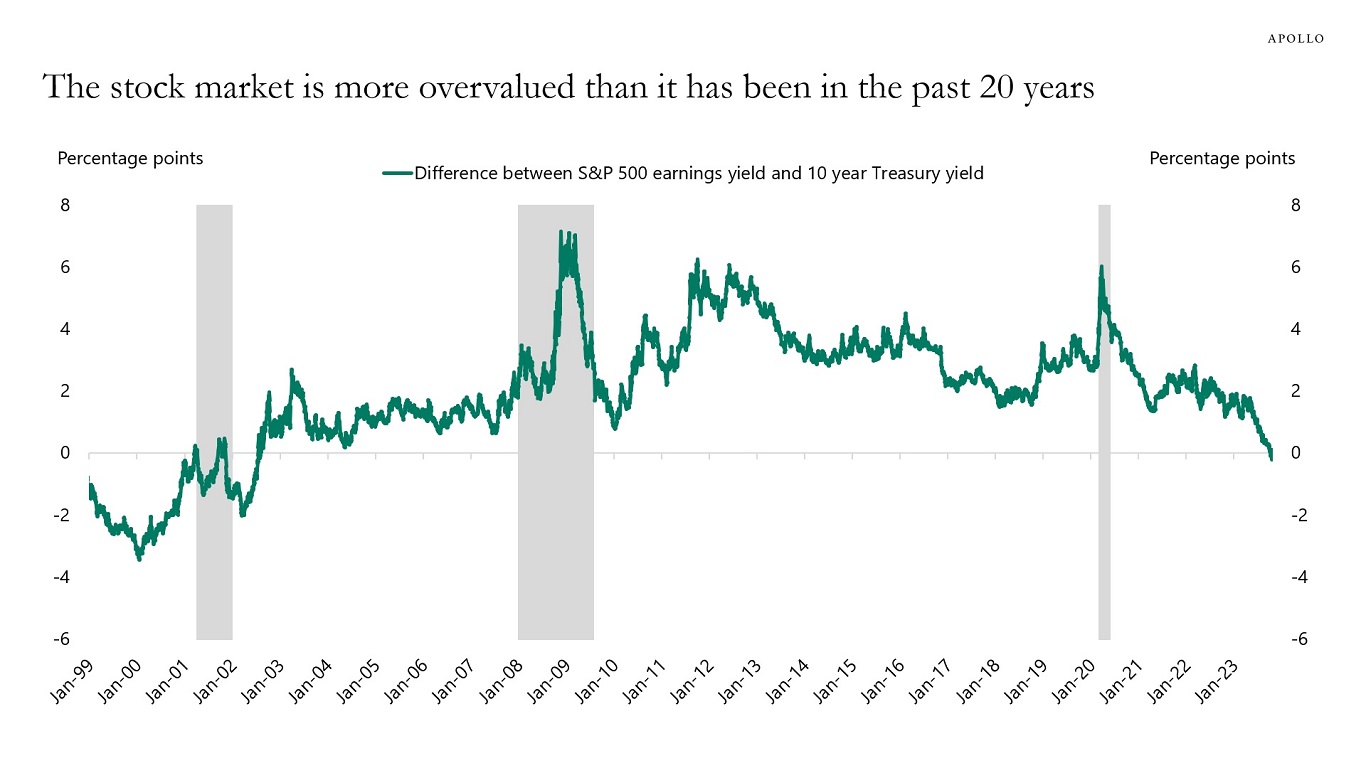
Source: Bloomberg, Apollo Chief Economist 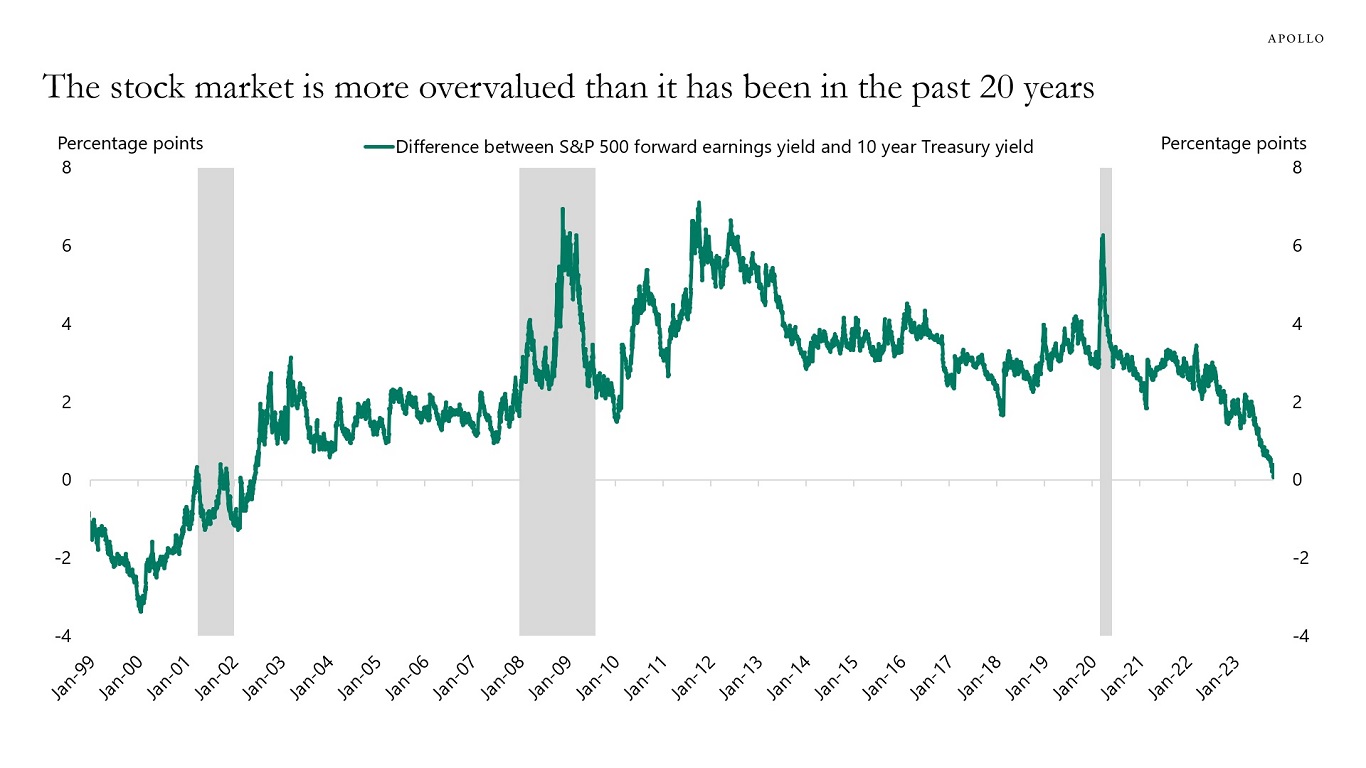
Source: Bloomberg, Apollo Chief Economist See important disclaimers at the bottom of the page.
-
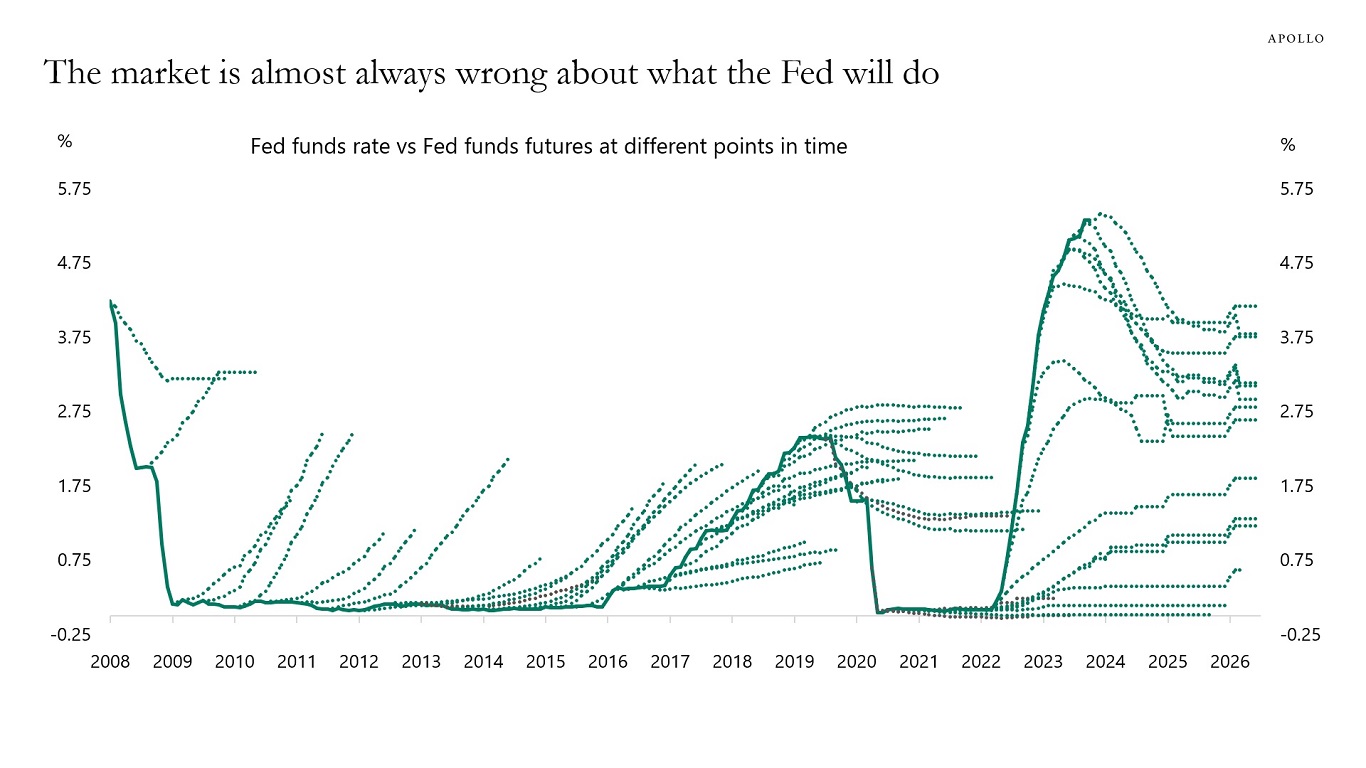
The market is currently pricing that the FOMC will start cutting rates in June 2024, but the chart below shows that the market is almost always wrong about what the Fed will do beyond the next FOMC meeting.
Looking at the chart, it is remarkable how mean reverting the error is.
When rates are low, the market is systematically pricing that the Fed will soon hike.
When rates are high, the market is systematically pricing that the next move from the Fed is to cut.
Maybe the Fed will cut rates next summer. Maybe not.
For now, investors should be planning on rates staying higher for longer.
Source: Bloomberg, Apollo Chief Economist See important disclaimers at the bottom of the page.
-
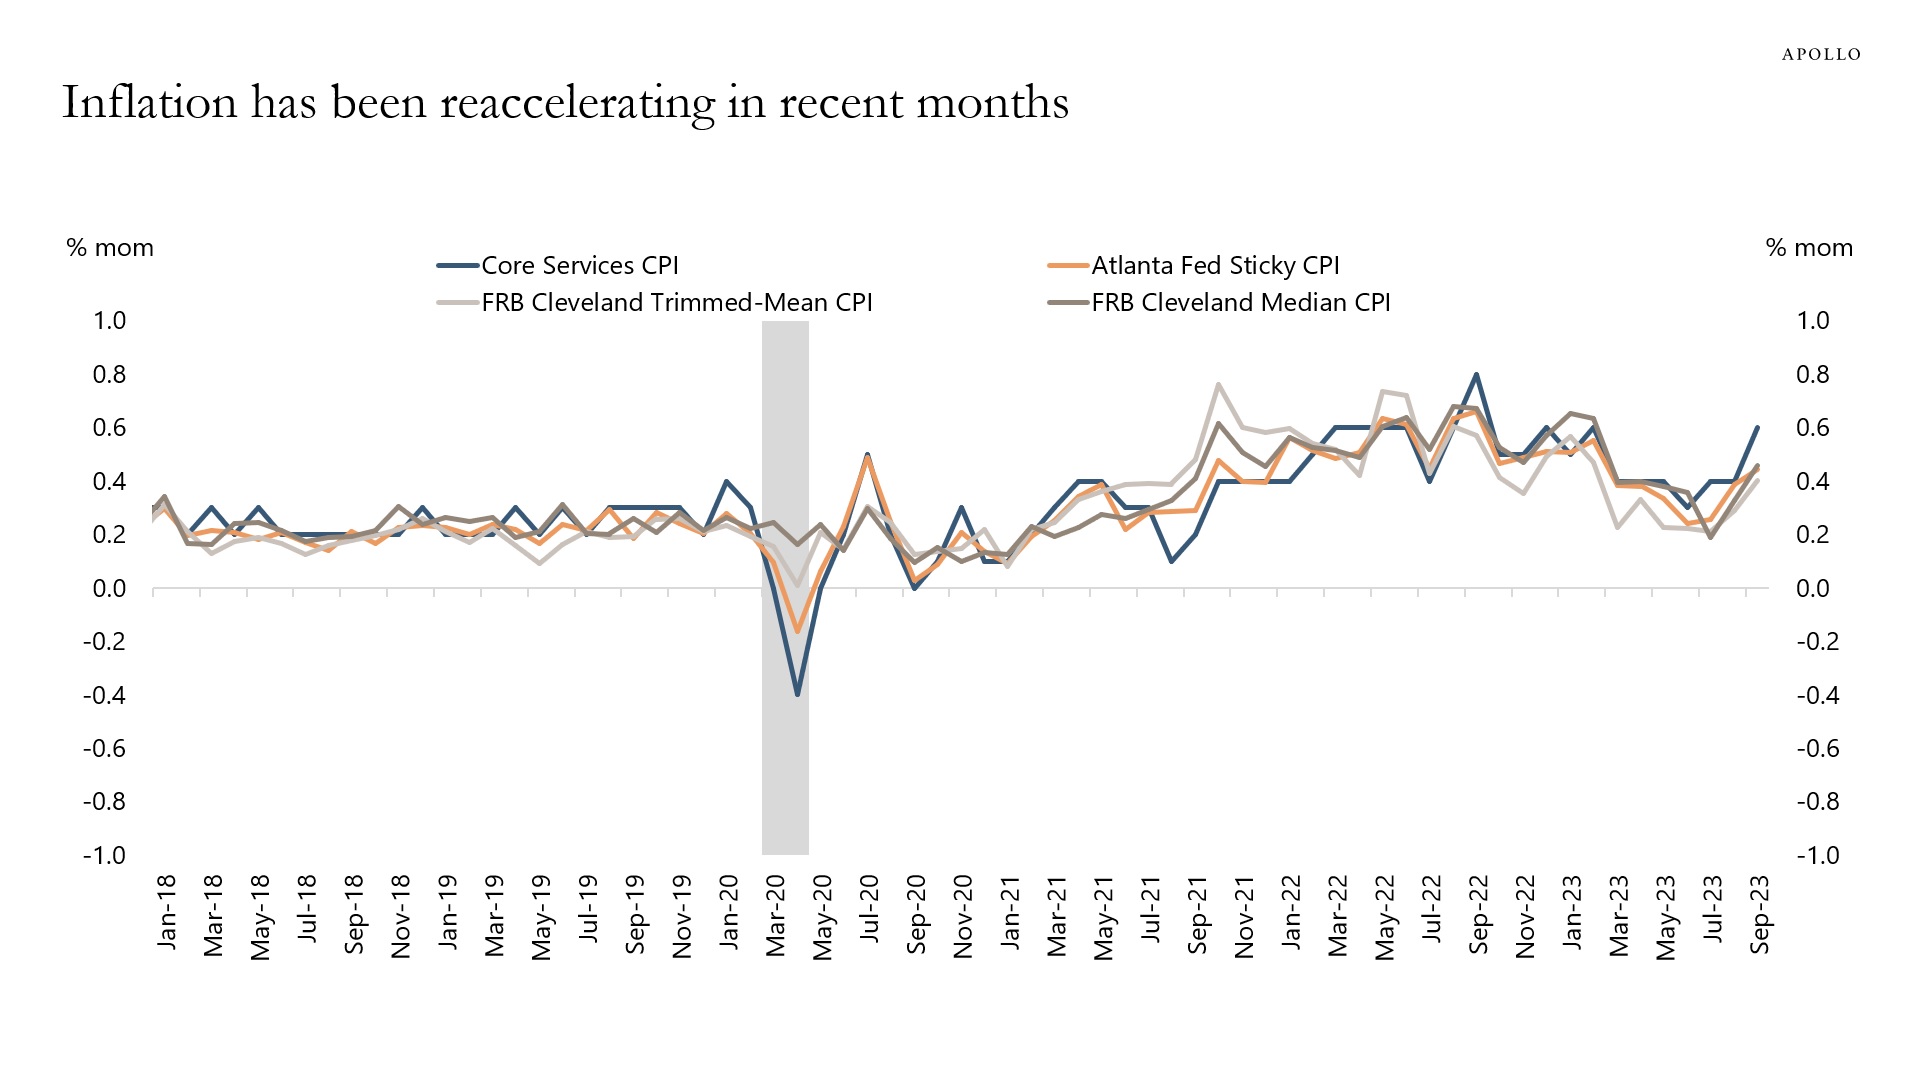
Key measures of inflation have reaccelerated in recent months, and supercore inflation at 4% is too high compared with the Fed’s 2% inflation target, see charts below.
The bottom line is that it is too early for the Fed to declare victory over inflation, and the Fed needs to slow down the economy further to get inflation under control.
The implication for investors is that the Fed will keep rates high until nonfarm payrolls go negative, because that is what is needed to get inflation under control, and this fact is generally underappreciated in markets.
Source: BLS, Haver Analytics, Apollo Chief Economist 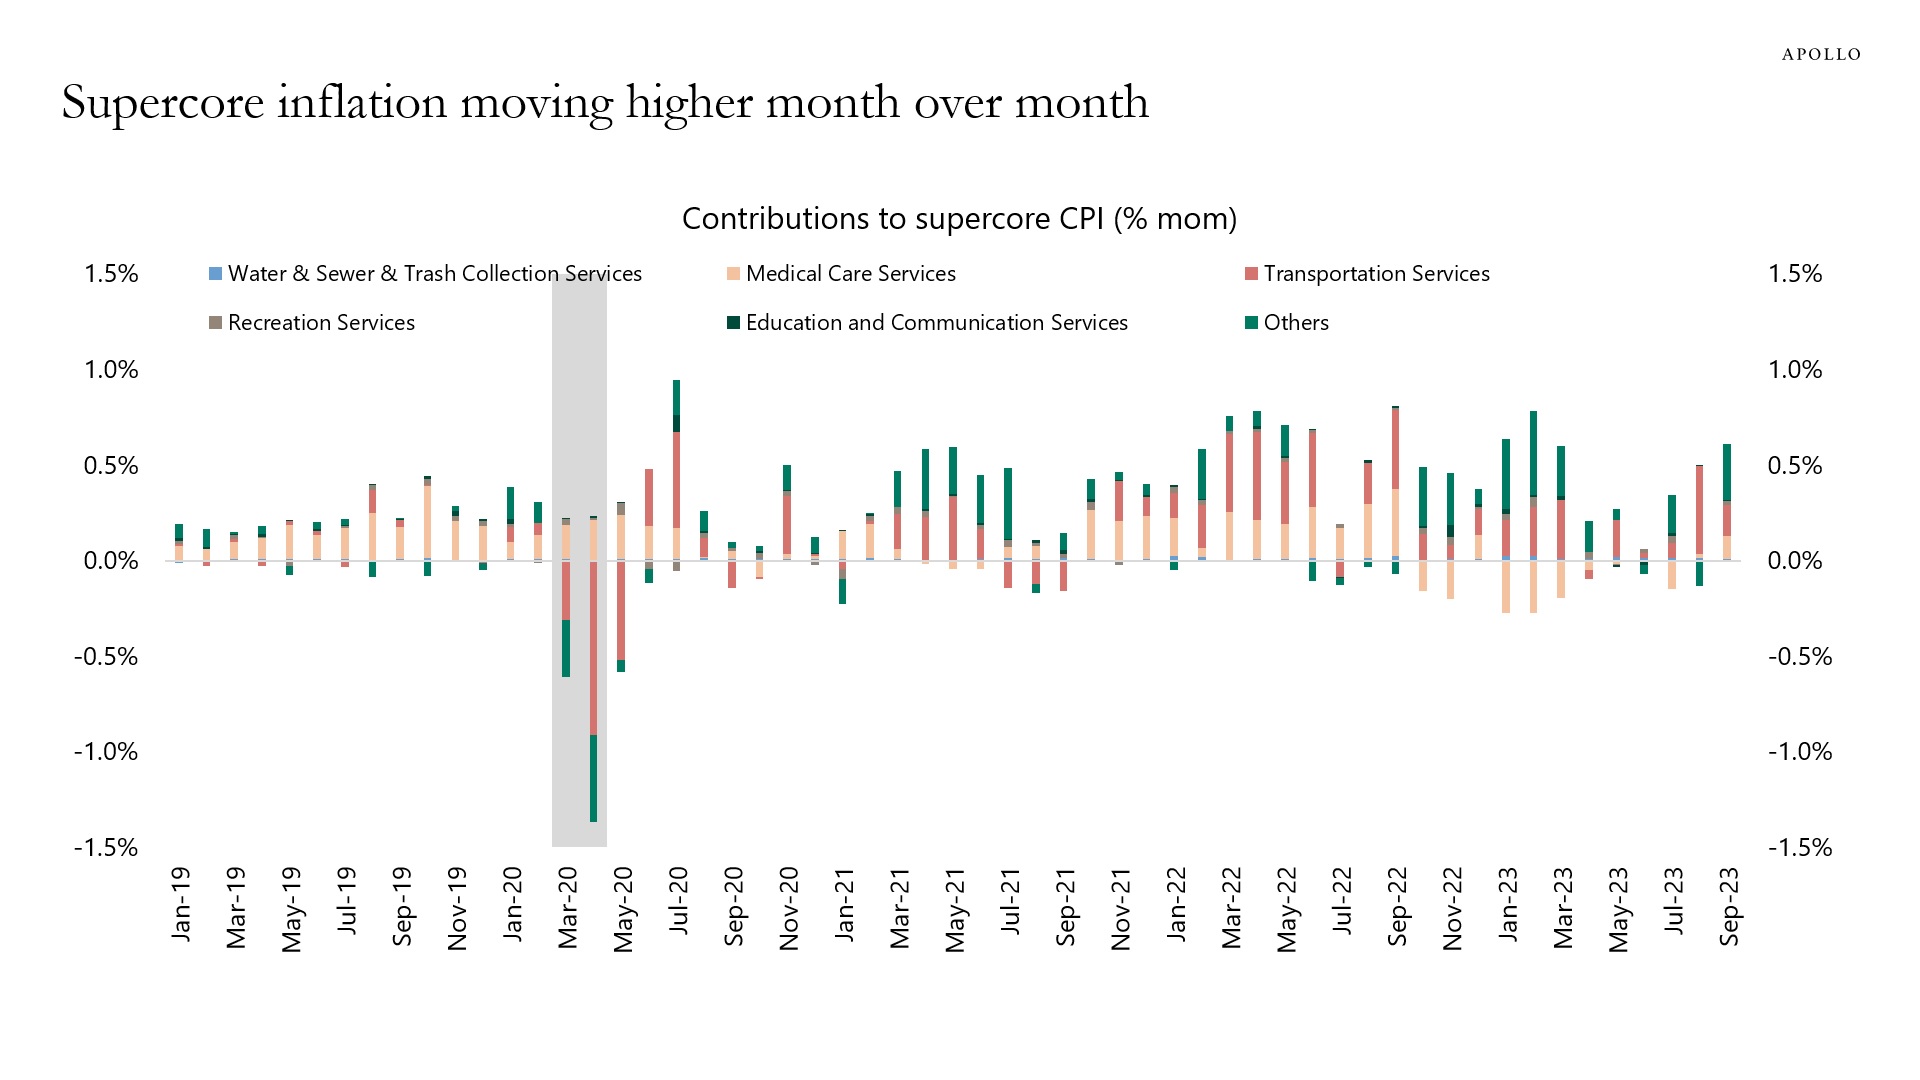
Source: BLS, Haver Analytics, Apollo Chief Economist 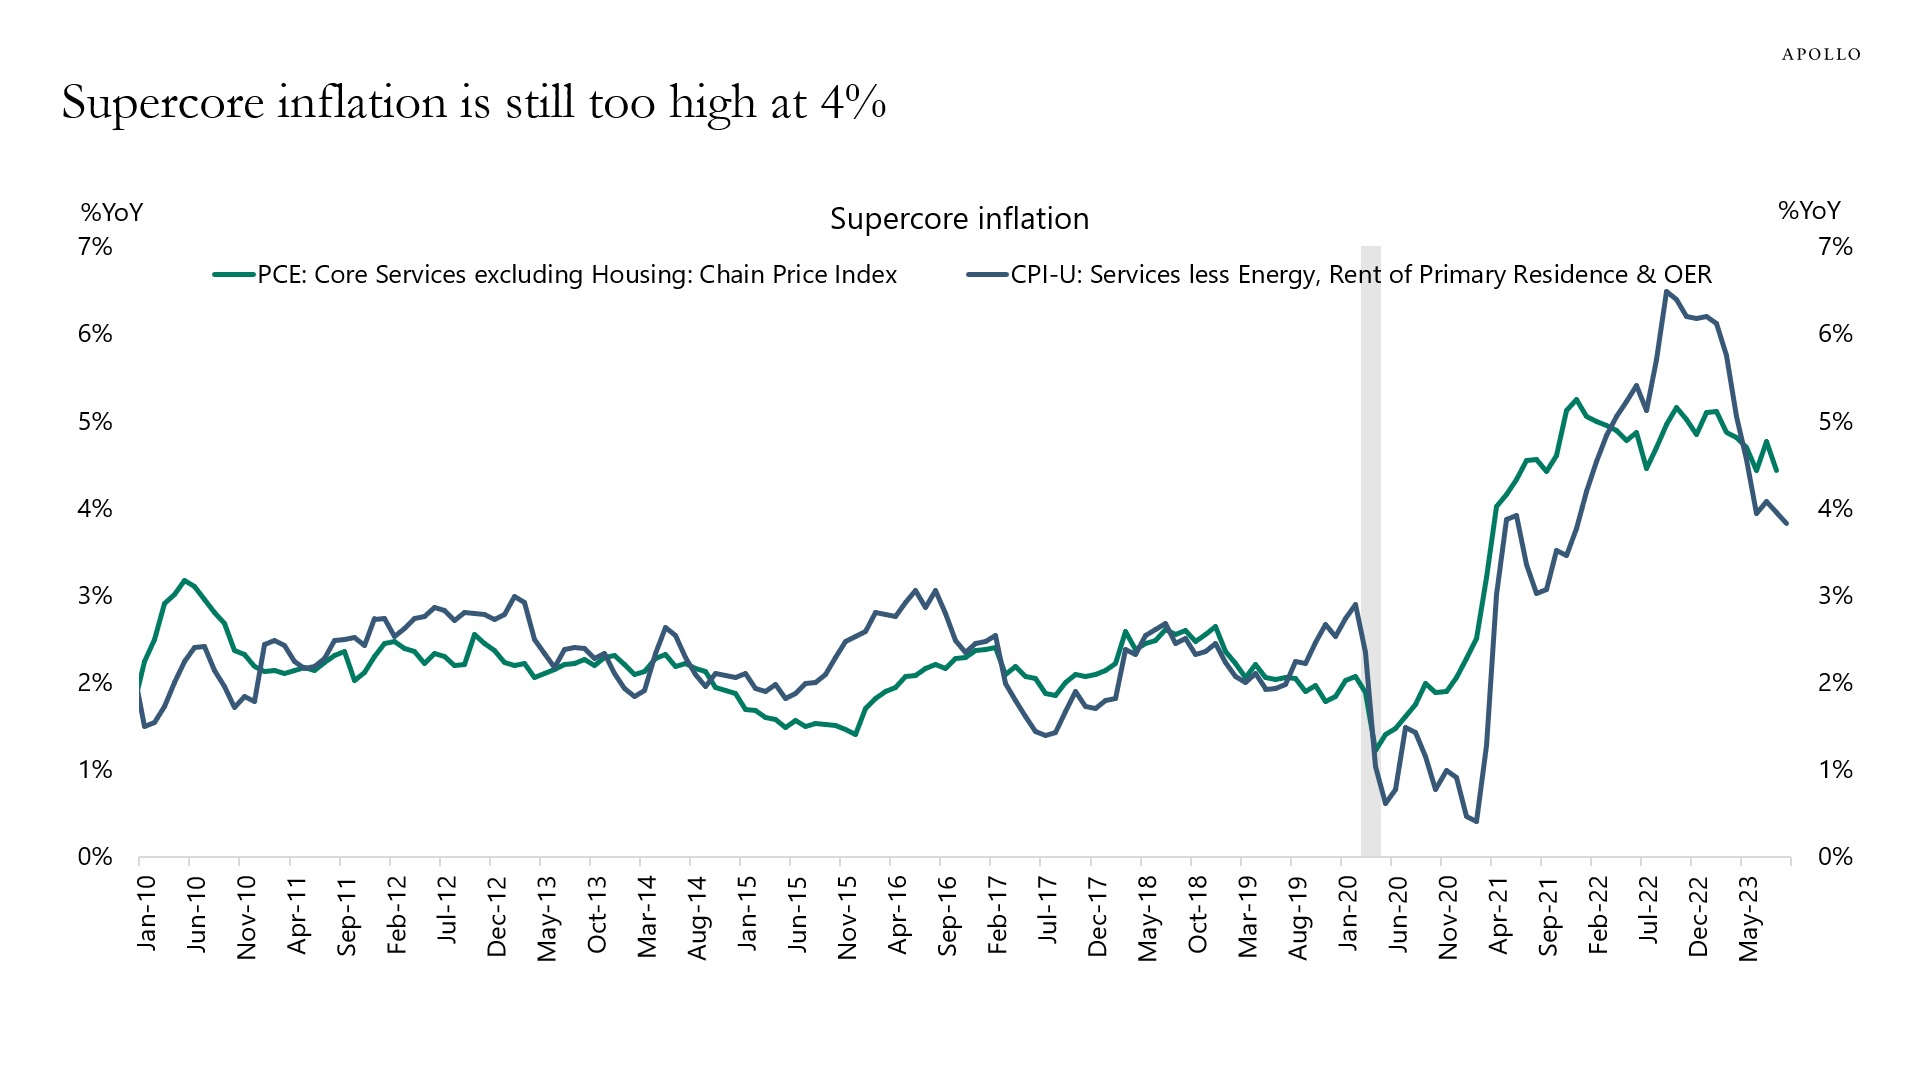
Source: BLS, Haver Analytics, Apollo Chief Economist See important disclaimers at the bottom of the page.
-
The Fed has quantified what their forward guidance and balance sheet policy mean for the fed funds rate, and their estimates show that the proxy fed funds rate is 7% rather than the official 5.5%, see chart below and here.
In other words, comparisons with history and discussions of how restrictive monetary policy is should not only look at the level of the fed funds rate but also include forward guidance and balance sheet policies, including their impact on long rates.
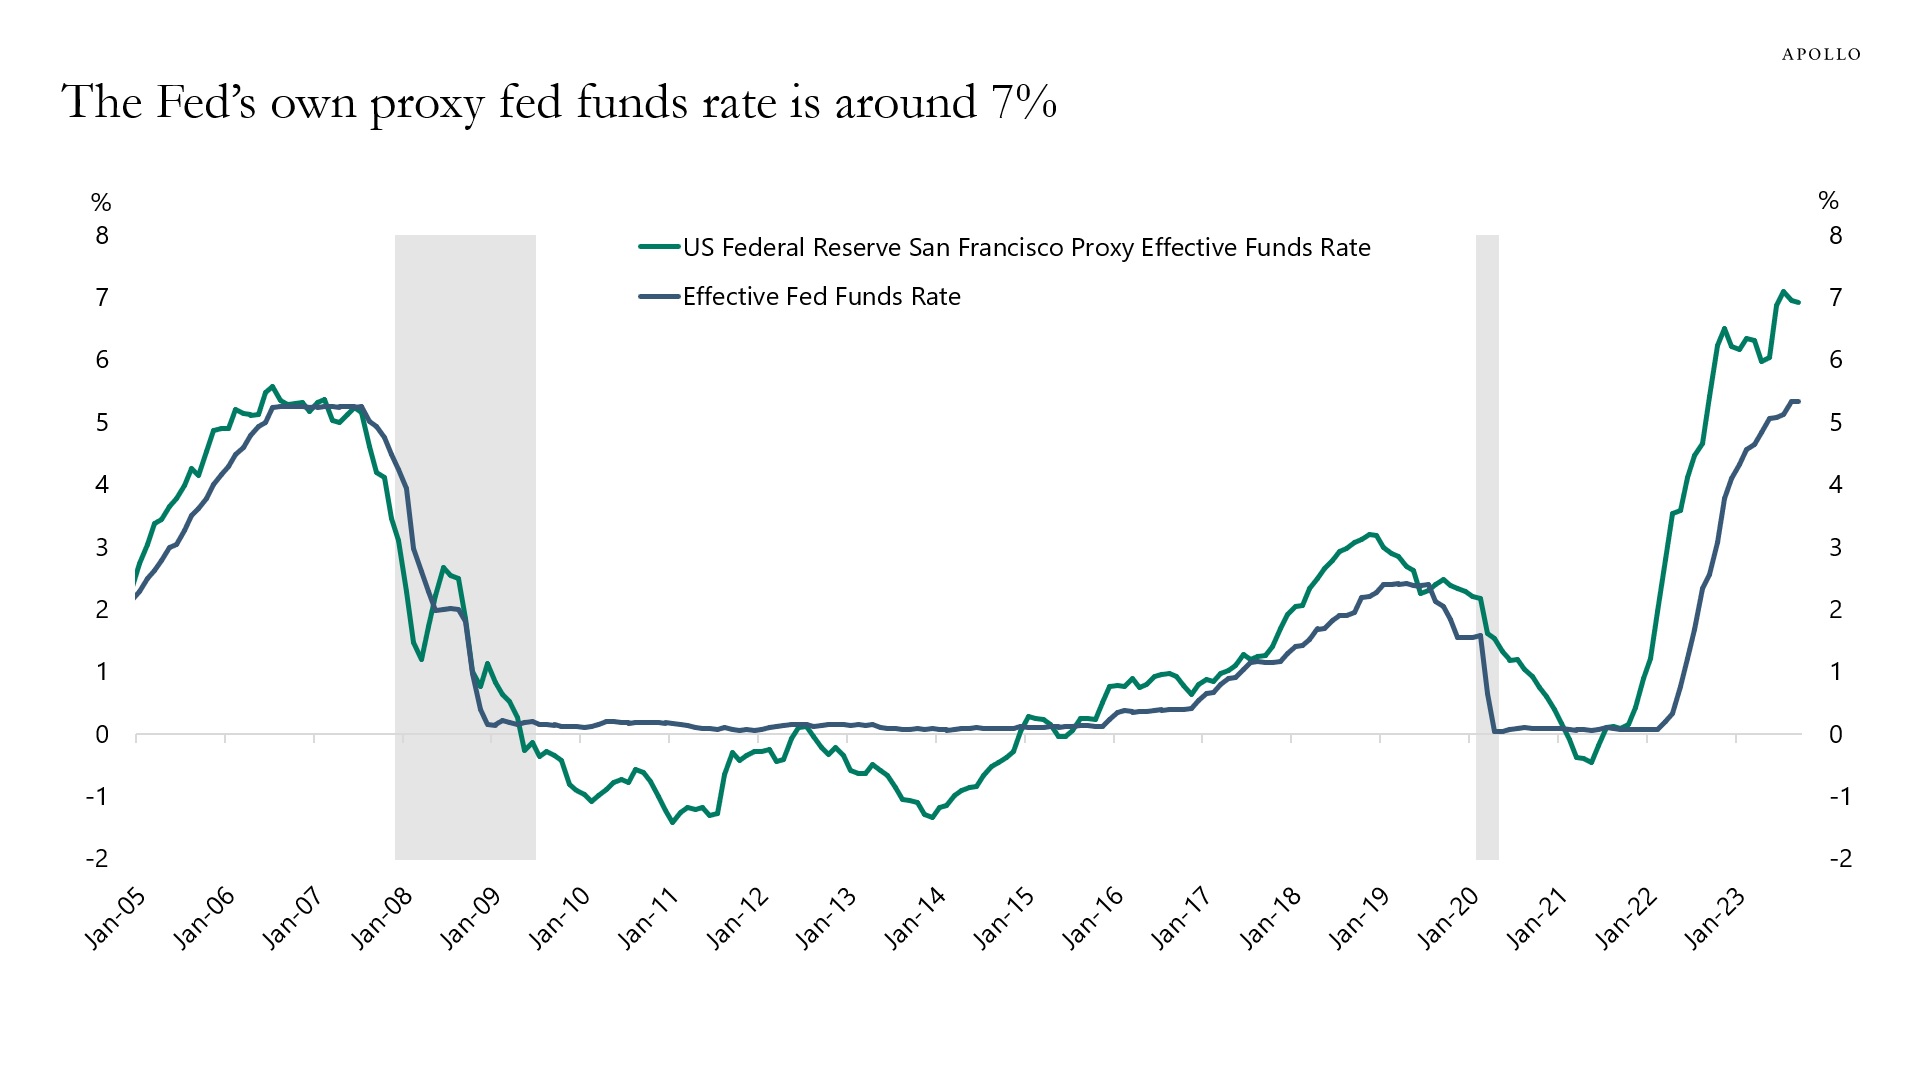
Source: Bloomberg, Apollo Chief Economist. Note: Source: Monthly series of the proxy funds rate, from Doh and Choi (2016) and Choi, Doh, Foerster, and Martinez (2022). This measure uses public and private borrowing rates and spreads to infer the broader stance of monetary policy. When the Federal Open Market Committee uses additional tools, such as forward guidance or changes in the balance sheet, these policy actions affect financial conditions, which the proxy rate translates into an analogous level of the federal funds rate. The proxy rate can be interpreted as indicating what the federal funds rate would typically be associated with prevailing financial market conditions if these conditions were driven solely by the funds rate. See important disclaimers at the bottom of the page.

This presentation may not be distributed, transmitted or otherwise communicated to others in whole or in part without the express consent of Apollo Global Management, Inc. (together with its subsidiaries, “Apollo”).
Apollo makes no representation or warranty, expressed or implied, with respect to the accuracy, reasonableness, or completeness of any of the statements made during this presentation, including, but not limited to, statements obtained from third parties. Opinions, estimates and projections constitute the current judgment of the speaker as of the date indicated. They do not necessarily reflect the views and opinions of Apollo and are subject to change at any time without notice. Apollo does not have any responsibility to update this presentation to account for such changes. There can be no assurance that any trends discussed during this presentation will continue.
Statements made throughout this presentation are not intended to provide, and should not be relied upon for, accounting, legal or tax advice and do not constitute an investment recommendation or investment advice. Investors should make an independent investigation of the information discussed during this presentation, including consulting their tax, legal, accounting or other advisors about such information. Apollo does not act for you and is not responsible for providing you with the protections afforded to its clients. This presentation does not constitute an offer to sell, or the solicitation of an offer to buy, any security, product or service, including interest in any investment product or fund or account managed or advised by Apollo.
Certain statements made throughout this presentation may be “forward-looking” in nature. Due to various risks and uncertainties, actual events or results may differ materially from those reflected or contemplated in such forward-looking information. As such, undue reliance should not be placed on such statements. Forward-looking statements may be identified by the use of terminology including, but not limited to, “may”, “will”, “should”, “expect”, “anticipate”, “target”, “project”, “estimate”, “intend”, “continue” or “believe” or the negatives thereof or other variations thereon or comparable terminology.