


Want it delivered daily to your inbox?
-
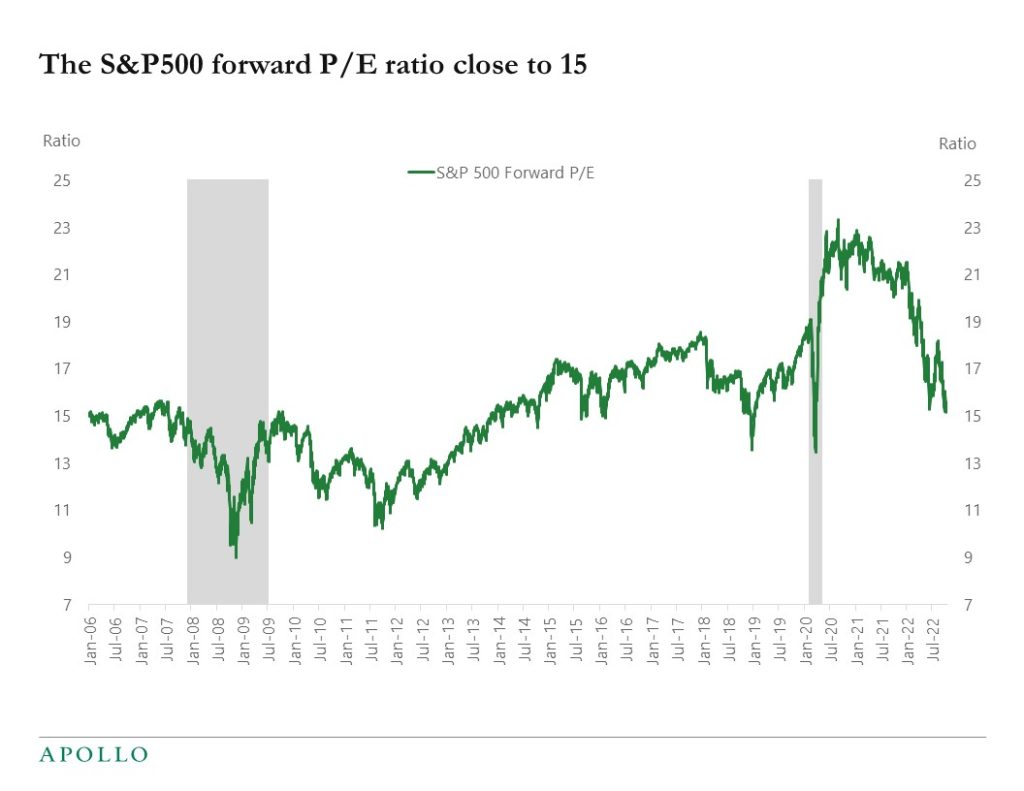
The forward P/E ratio for the S&P500 is currently 15, a level last seen in 2019 when inflation was 1.8%.
Inflation today is 8.2%, and the Fed is raising rates aggressively to slow down GDP growth and slow down growth in the “E” in the P/E ratio.
The Fed does not worry about how much or how little the S&P500 has declined since the peak in 2021. In other words, it is not important to the Fed if the P/E ratio today is 10, 15, or 20.
What the Fed worries about is that inflation at 8.2% is much higher than the FOMC’s 2% inflation target. And with the Fed stepping hard on the brakes, the downside risks to equity and credit markets remain significant.
Source: Bloomberg, Apollo Chief Economist See important disclaimers at the bottom of the page.
-
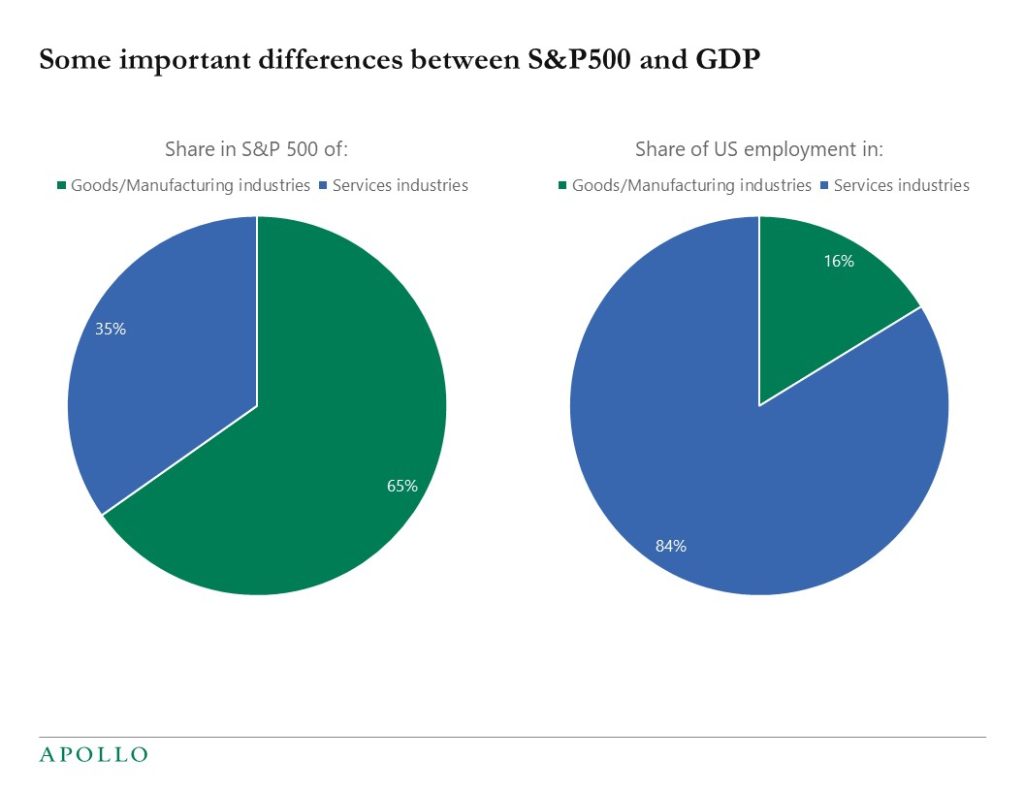
The goods sector of the US economy (housing, autos, capex spending, etc.) is more sensitive to interest rates, and Fed hikes are having a more negative effect on the S&P500 than on GDP because the goods sector makes up a much smaller share of GDP, see chart below. In addition, the service sector which is most vulnerable to higher interest rates is tech, and the tech sector has also responded very negatively to Fed hikes. The bottom line is that it is not surprising that Fed hikes have had a more negative effect on the stock market than on GDP.
Source: BLS, S&P, Bloomberg, Haver Analytics, Apollo Chief Economist. Note: S&P 500 services industries include Software, Interactive Media & Services, IT Services, Health Care Providers & Services Indus, Internet & Catalog Retail, Specialty Retail, Hotels Restaurants & Leisure, Life Sciences Tools& Services, Diversified Financial Services, Diversified Telecom Services, Multiline Retail, Commercial Services & Supplies, Professional Services, Wireless Telecommunication Services, Diversified Consumer Services. See important disclaimers at the bottom of the page.
-
People age 55 and older are getting more worried about having a comfortable retirement, likely driven by covid, high inflation, and a falling stock market, see chart below.
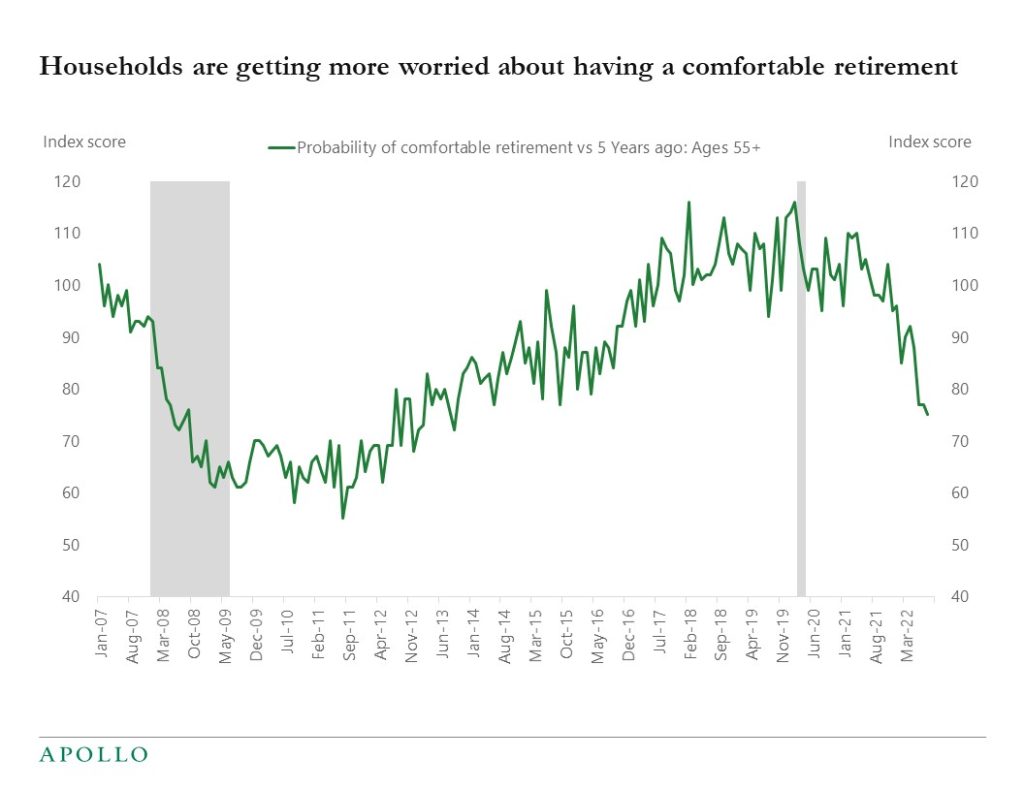
Source: U. of Michigan Sentiment, Haver, Apollo Chief Economist (Q: Compared with 5 years ago, do you think the chances that you (and your husband/wife) will have a comfortable retirement have gone up, gone down, or remained about the same?) See important disclaimers at the bottom of the page.
-
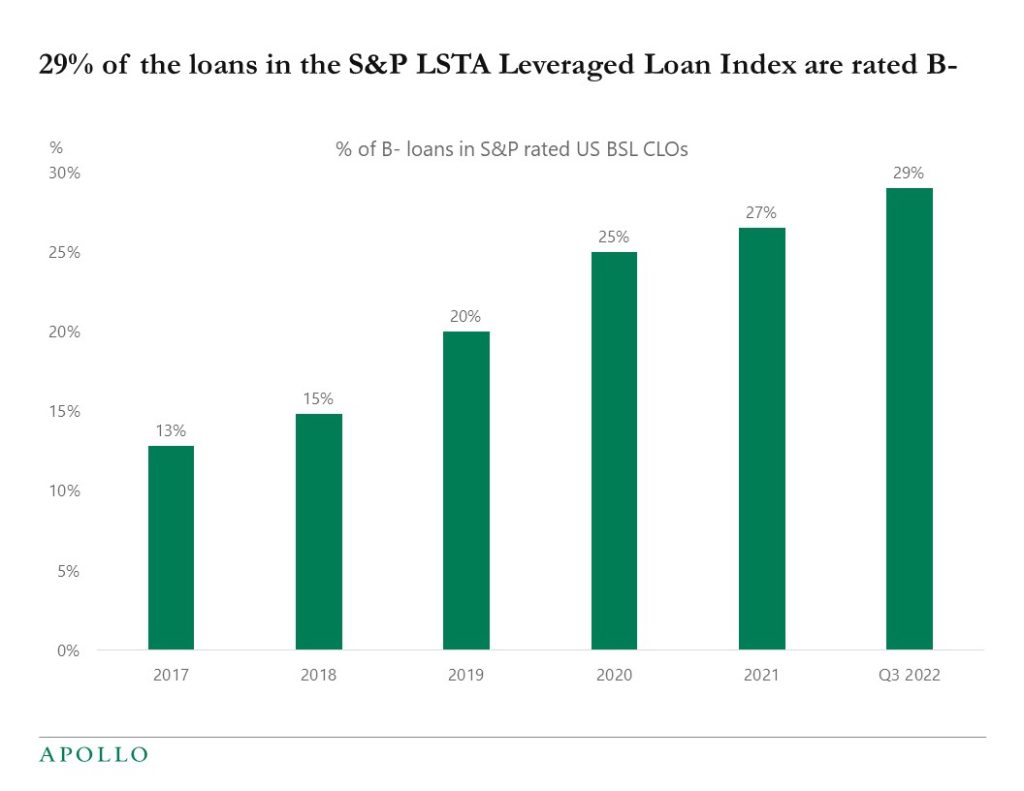
The share of loans rated B- in the leveraged loan index has increased from 13% in 2017 to 29% today, see chart below. The implication is that if there is a recession with a spike in the unemployment rate, then CLOs will be more vulnerable.
Source: S&P, Apollo Chief Economist See important disclaimers at the bottom of the page.
-
The charts below show the maturity wall for the individual sectors in the IG and HY indexes. The maturity wall seems particularly steep for highly leveraged technology companies in both IG and HY.
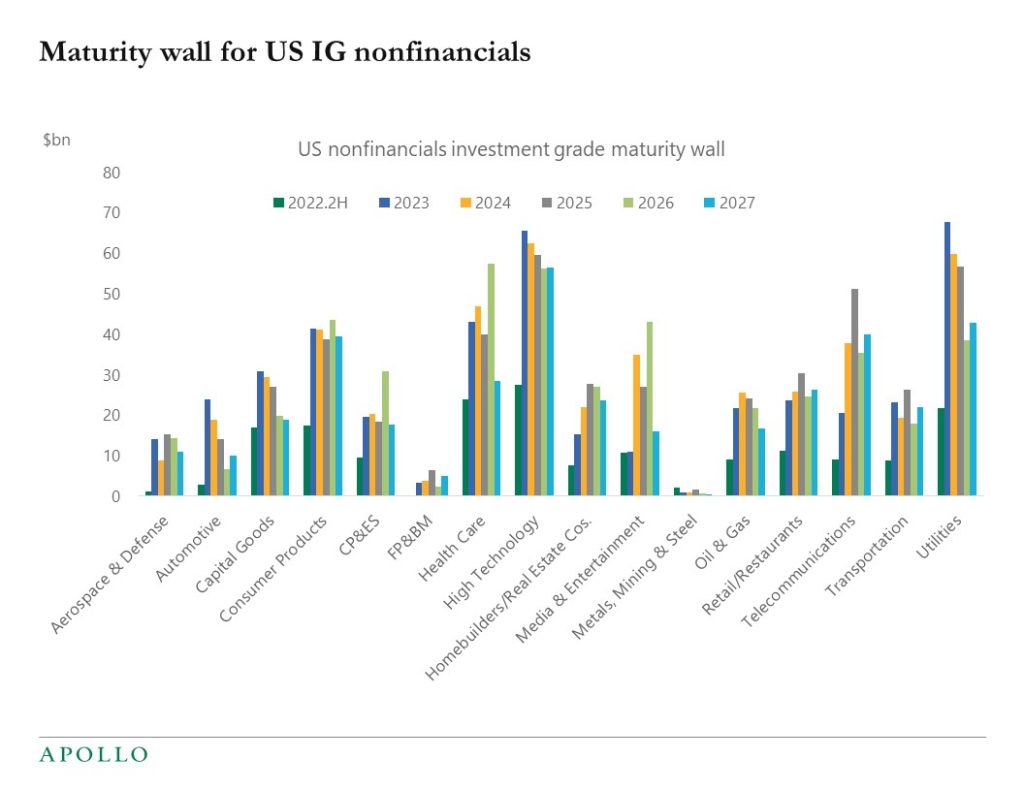
Source: S&P, Apollo Chief Economist. Note: CP&ES–Chemicals, packaging, and environmental services. FP&BM–Forest products and building materials. Media and entertainment includes the leisure sector. Includes bonds, loans, and revolving credit facilities that are rated by S&P Global Ratings. Data as of July 1, 2022. 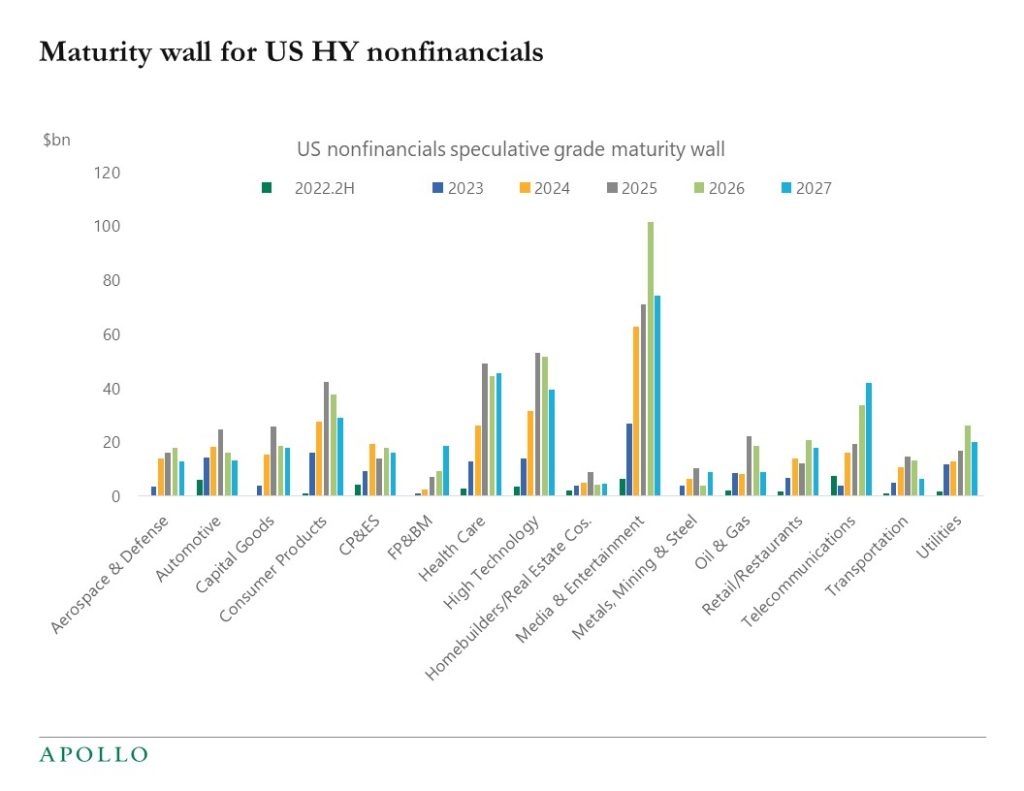
Source: S&P, Apollo Chief Economist. Note: CP&ES–Chemicals, packaging, and environmental services. FP&BM–Forest products and building materials. Media and entertainment includes the leisure sector. Includes bonds, loans, and revolving credit facilities that are rated by S&P Global Ratings. Data as of July 1, 2022. See important disclaimers at the bottom of the page.
-
The level of government debt outstanding limits how much the Fed can raise rates. With total debt held by the public at $24.3trn, the 2% increase in the entire yield curve over the past six months will increase debt servicing costs by $486bn, see chart below. With net interest expenses expected on government debt in FY2023 at $442bn, the total annual debt servicing costs would rise to roughly $1trn. The bottom line for markets is that rising interest rates are becoming a significant drag on US GDP growth. For more, see also links here: Debt to the Penny, Interest Expense on the Debt Outstanding and CBO projections.
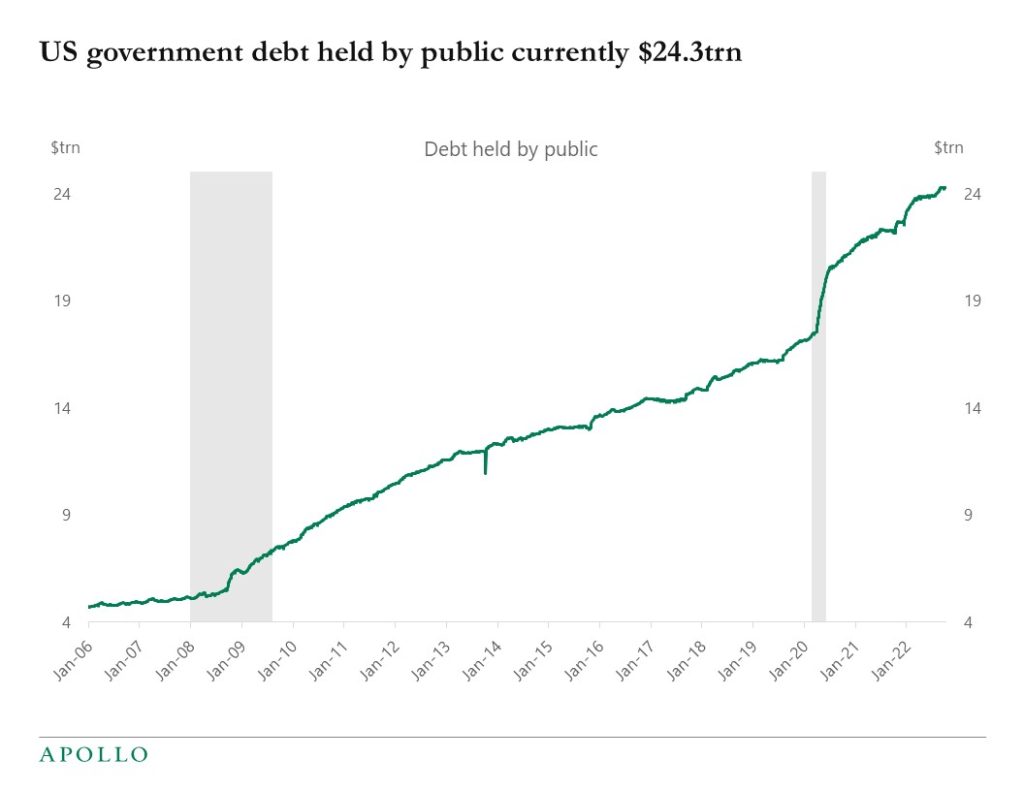
Source: Treasury, Bloomberg, Apollo Chief Economist See important disclaimers at the bottom of the page.
-
The goods sector makes up 20% of US GDP and the services sector makes up 80%.
The goods sector of the economy is slowing down because growth in goods production and goods sales was very high during covid, and the goods sector consists of the more interest rate-sensitive components of GDP such as housing, autos, and capex.
The service sector, on the other hand, such as air travel, hotels, restaurants, concerts, sporting events, continues to show no signs of slowing down.
These diverging trends between goods and services are also visible in the inflation data we got earlier this week, see chart below. Goods inflation is slowing. Services inflation is rising.
The Fed is waiting for the services sector to slow down, which is not happening yet, see also our Slowdown Watch PDF with daily and weekly indicators for the US economy.
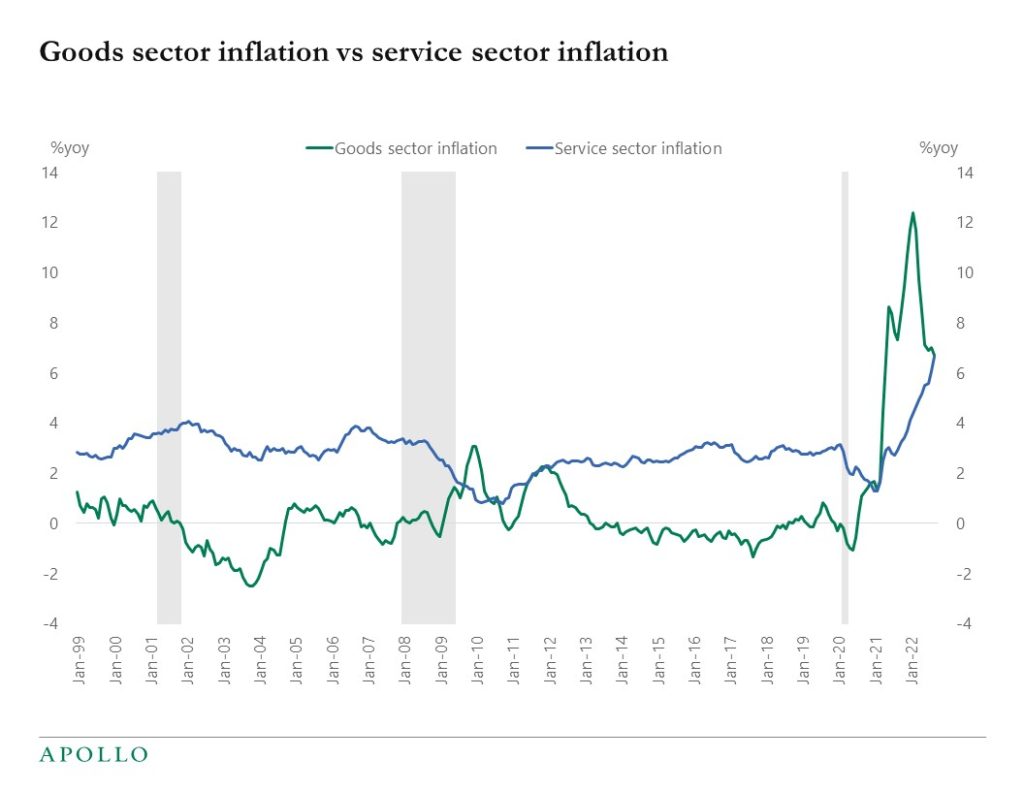
Source: BLS, Haver Analytics, Apollo Chief Economist (Note: Goods = Commodities Less Food & Energy Commodities; Service = Services Less Energy Services See important disclaimers at the bottom of the page.
-
A key reason inflation remains so high is that households still have significant savings left, and the market underappreciates this strong tailwind for consumer spending, see charts below. Combined with solid job and wage growth, it will take many quarters before the level of household savings is back at pre-pandemic levels.
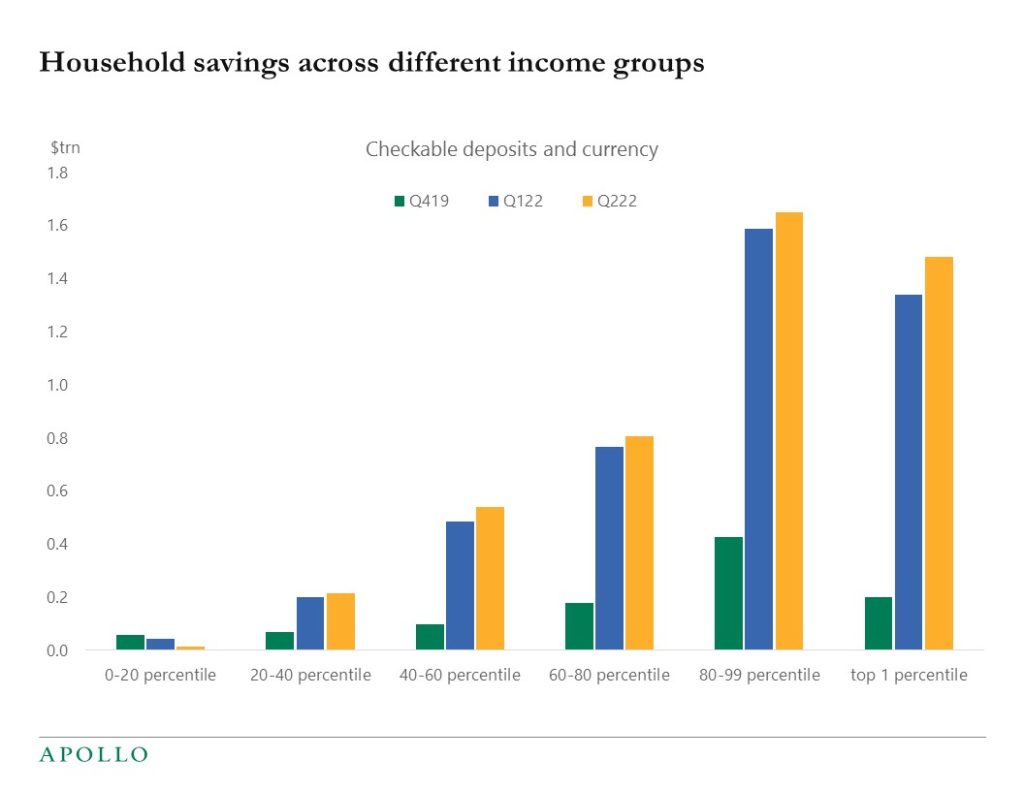
Source: FRB, Haver Analytics, Apollo Chief Economist 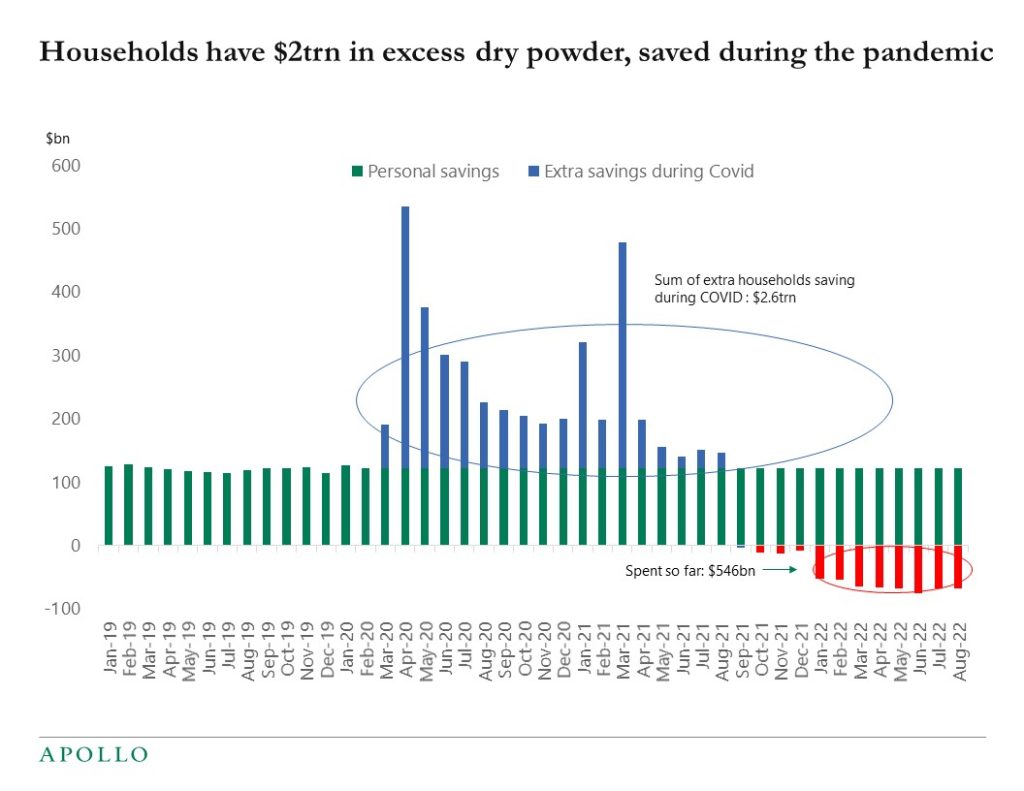
Source: Bloomberg, Apollo Chief Economist See important disclaimers at the bottom of the page.
-
Liquidity is getting worse in government bond markets, credit markets, and equity markets see charts below. The sources of low liquidity in financial markets are passive investment strategies, high-frequency trading, and less risk-taking by some brokers.
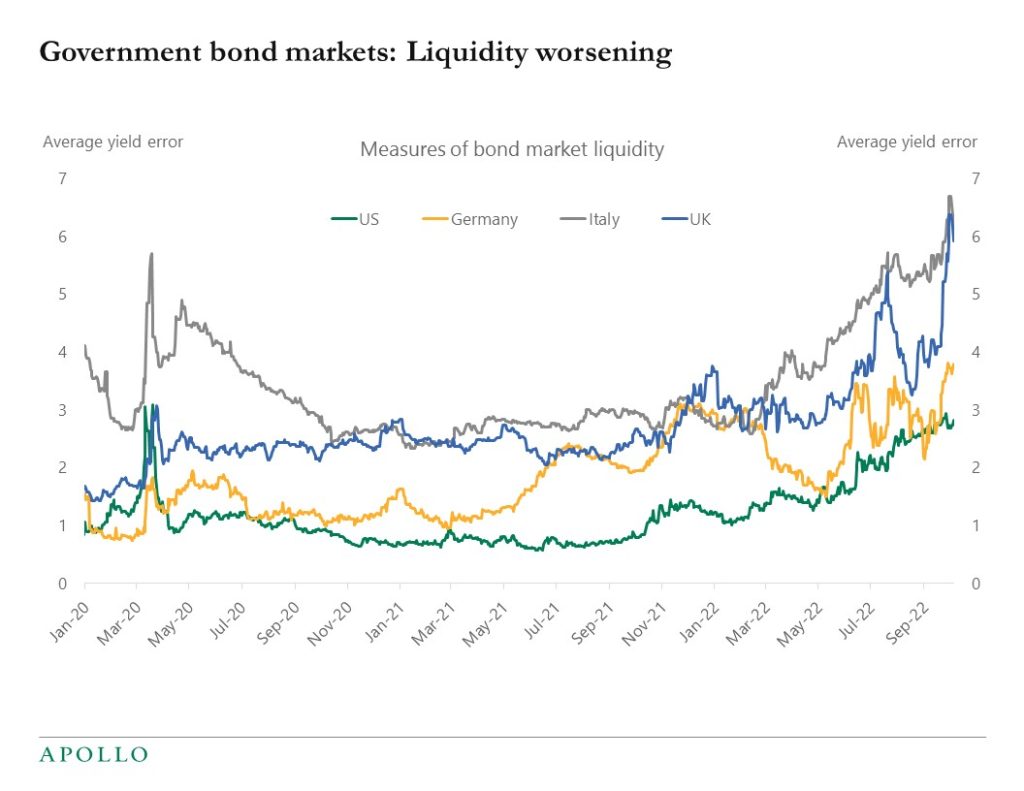
Source: Bloomberg, Apollo Chief Economist (Note: The index displays the average yield error across the universe of government notes and bonds with remaining maturity 1-year or greater, based off the intra-day Bloomberg relative value curve fitter. When liquidity conditions are favorable the average yield errors are small as any dislocations from fair values are normalized within a short time frame. Average yield error is defined as an aggregate measure for dislocations in Treasury securities across the curve.) 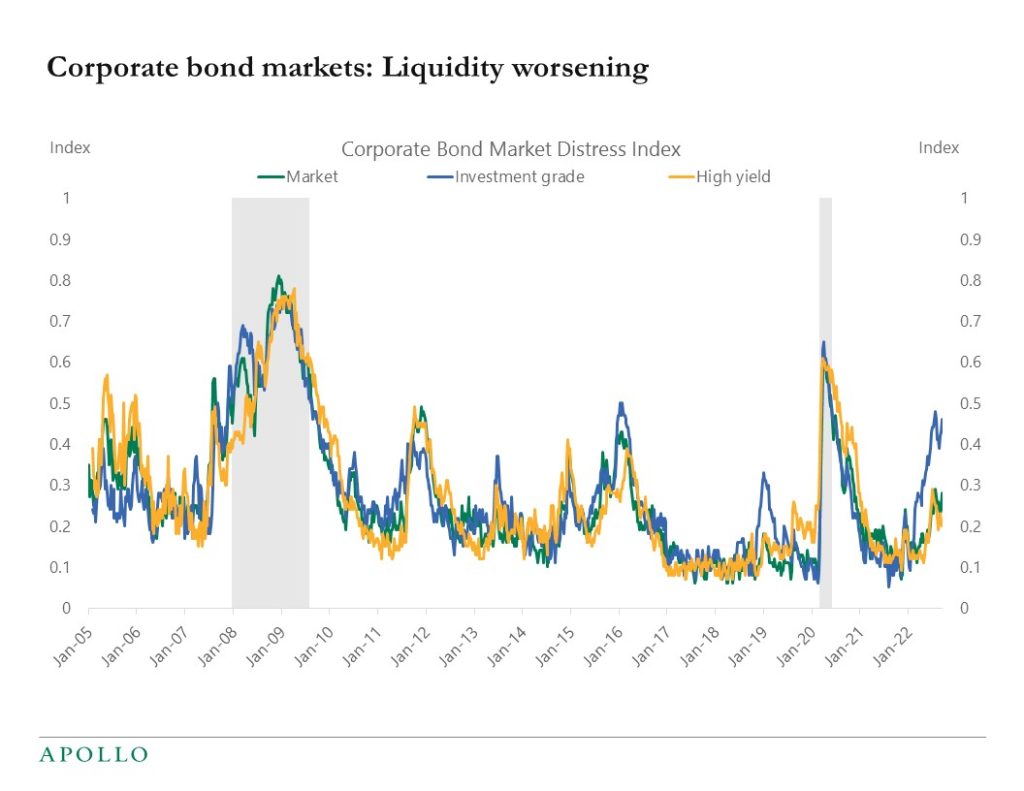
Source: FRB of New York, Apollo Chief Economist (Note: Corporate bonds are a key source of funding for U.S. non-financial corporations and a key investment security for insurance companies, pension funds, and mutual funds. Distress in the corporate bond market can thus both impair access to credit for corporate borrowers and reduce investment opportunities for key financial sub-sectors. CMDI offers a single measure to quantify joint dislocations in the primary and secondary corporate bond markets. Ranging from 0 to 1, a higher level of CMDI corresponds with historically extreme levels of dislocation. CMDI links bond market functioning to future economic activity through a new measure. 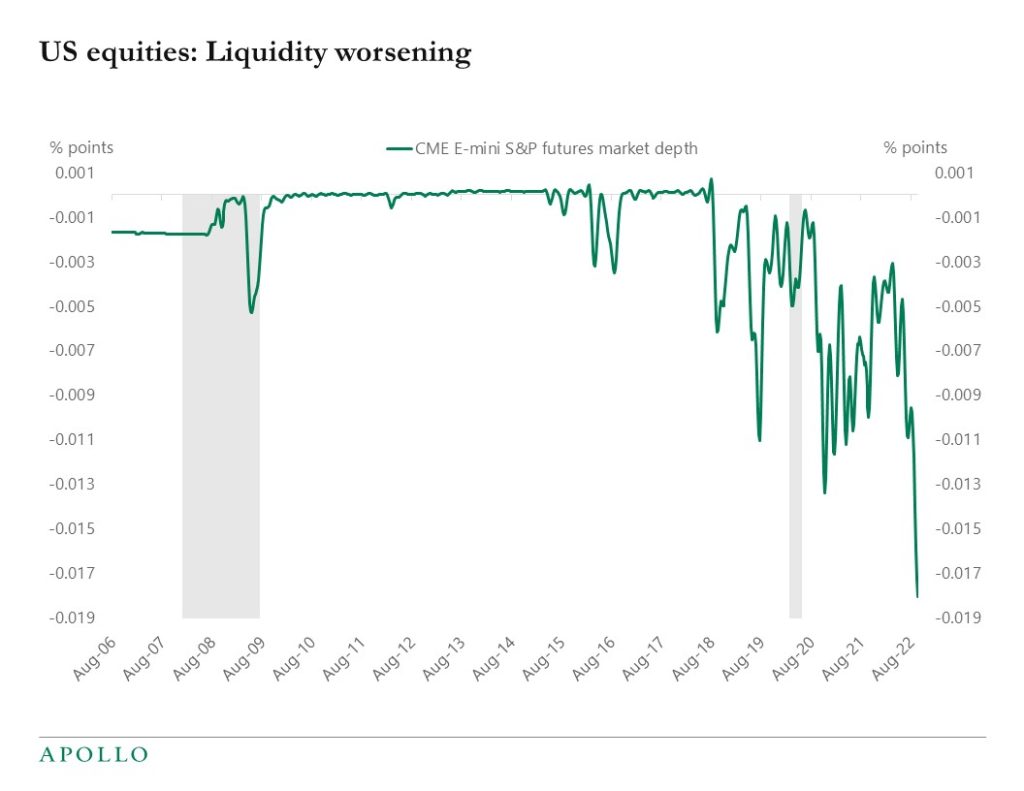
Source: Bloomberg, Apollo Chief Economist See important disclaimers at the bottom of the page.
-
Tomorrow, Thursday, we get inflation data for September, and the Fed’s forecast is that headline inflation will decline from 8.3% to 8.1%, and core inflation will rise from 6.3% to 6.6%, see chart below and here.
These numbers are all significantly above the FOMC’s 2% inflation target.
For financial markets, the implication is that the FOMC will continue to raise rates until inflation starts to move meaningfully down toward 2%.
Based on the consensus inflation forecast in the chart below, the Fed will likely pause rate hikes once we get to the middle of 2023. Seen from this perspective, the equity bear market will continue for now, but we could get a sustained rally in stocks and credit starting in 2023.
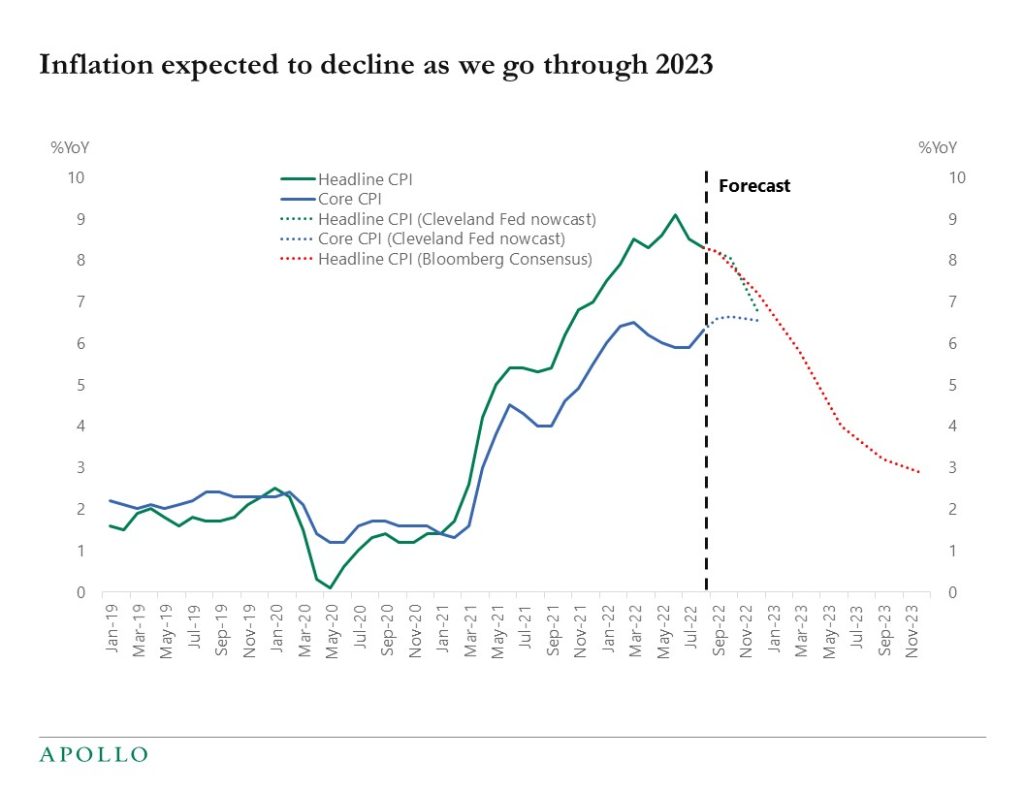
Source: Cleveland Fed, Bloomberg, Haver Analytics, Apollo Chief Economist See important disclaimers at the bottom of the page.

This presentation may not be distributed, transmitted or otherwise communicated to others in whole or in part without the express consent of Apollo Global Management, Inc. (together with its subsidiaries, “Apollo”).
Apollo makes no representation or warranty, expressed or implied, with respect to the accuracy, reasonableness, or completeness of any of the statements made during this presentation, including, but not limited to, statements obtained from third parties. Opinions, estimates and projections constitute the current judgment of the speaker as of the date indicated. They do not necessarily reflect the views and opinions of Apollo and are subject to change at any time without notice. Apollo does not have any responsibility to update this presentation to account for such changes. There can be no assurance that any trends discussed during this presentation will continue.
Statements made throughout this presentation are not intended to provide, and should not be relied upon for, accounting, legal or tax advice and do not constitute an investment recommendation or investment advice. Investors should make an independent investigation of the information discussed during this presentation, including consulting their tax, legal, accounting or other advisors about such information. Apollo does not act for you and is not responsible for providing you with the protections afforded to its clients. This presentation does not constitute an offer to sell, or the solicitation of an offer to buy, any security, product or service, including interest in any investment product or fund or account managed or advised by Apollo.
Certain statements made throughout this presentation may be “forward-looking” in nature. Due to various risks and uncertainties, actual events or results may differ materially from those reflected or contemplated in such forward-looking information. As such, undue reliance should not be placed on such statements. Forward-looking statements may be identified by the use of terminology including, but not limited to, “may”, “will”, “should”, “expect”, “anticipate”, “target”, “project”, “estimate”, “intend”, “continue” or “believe” or the negatives thereof or other variations thereon or comparable terminology.